Explore data using Metrics Drilldown
Welcome to the Explore data using Metrics Drilldown learning journey. Grafana Metrics Drilldown is a query-less experience for browsing Prometheus-compatible metrics offering a fast and easy way to verify metric flow into Grafana Cloud. Quickly find related metrics without needing to write PromQL queries to retrieve metrics and identify potential causes of problems with system performance.
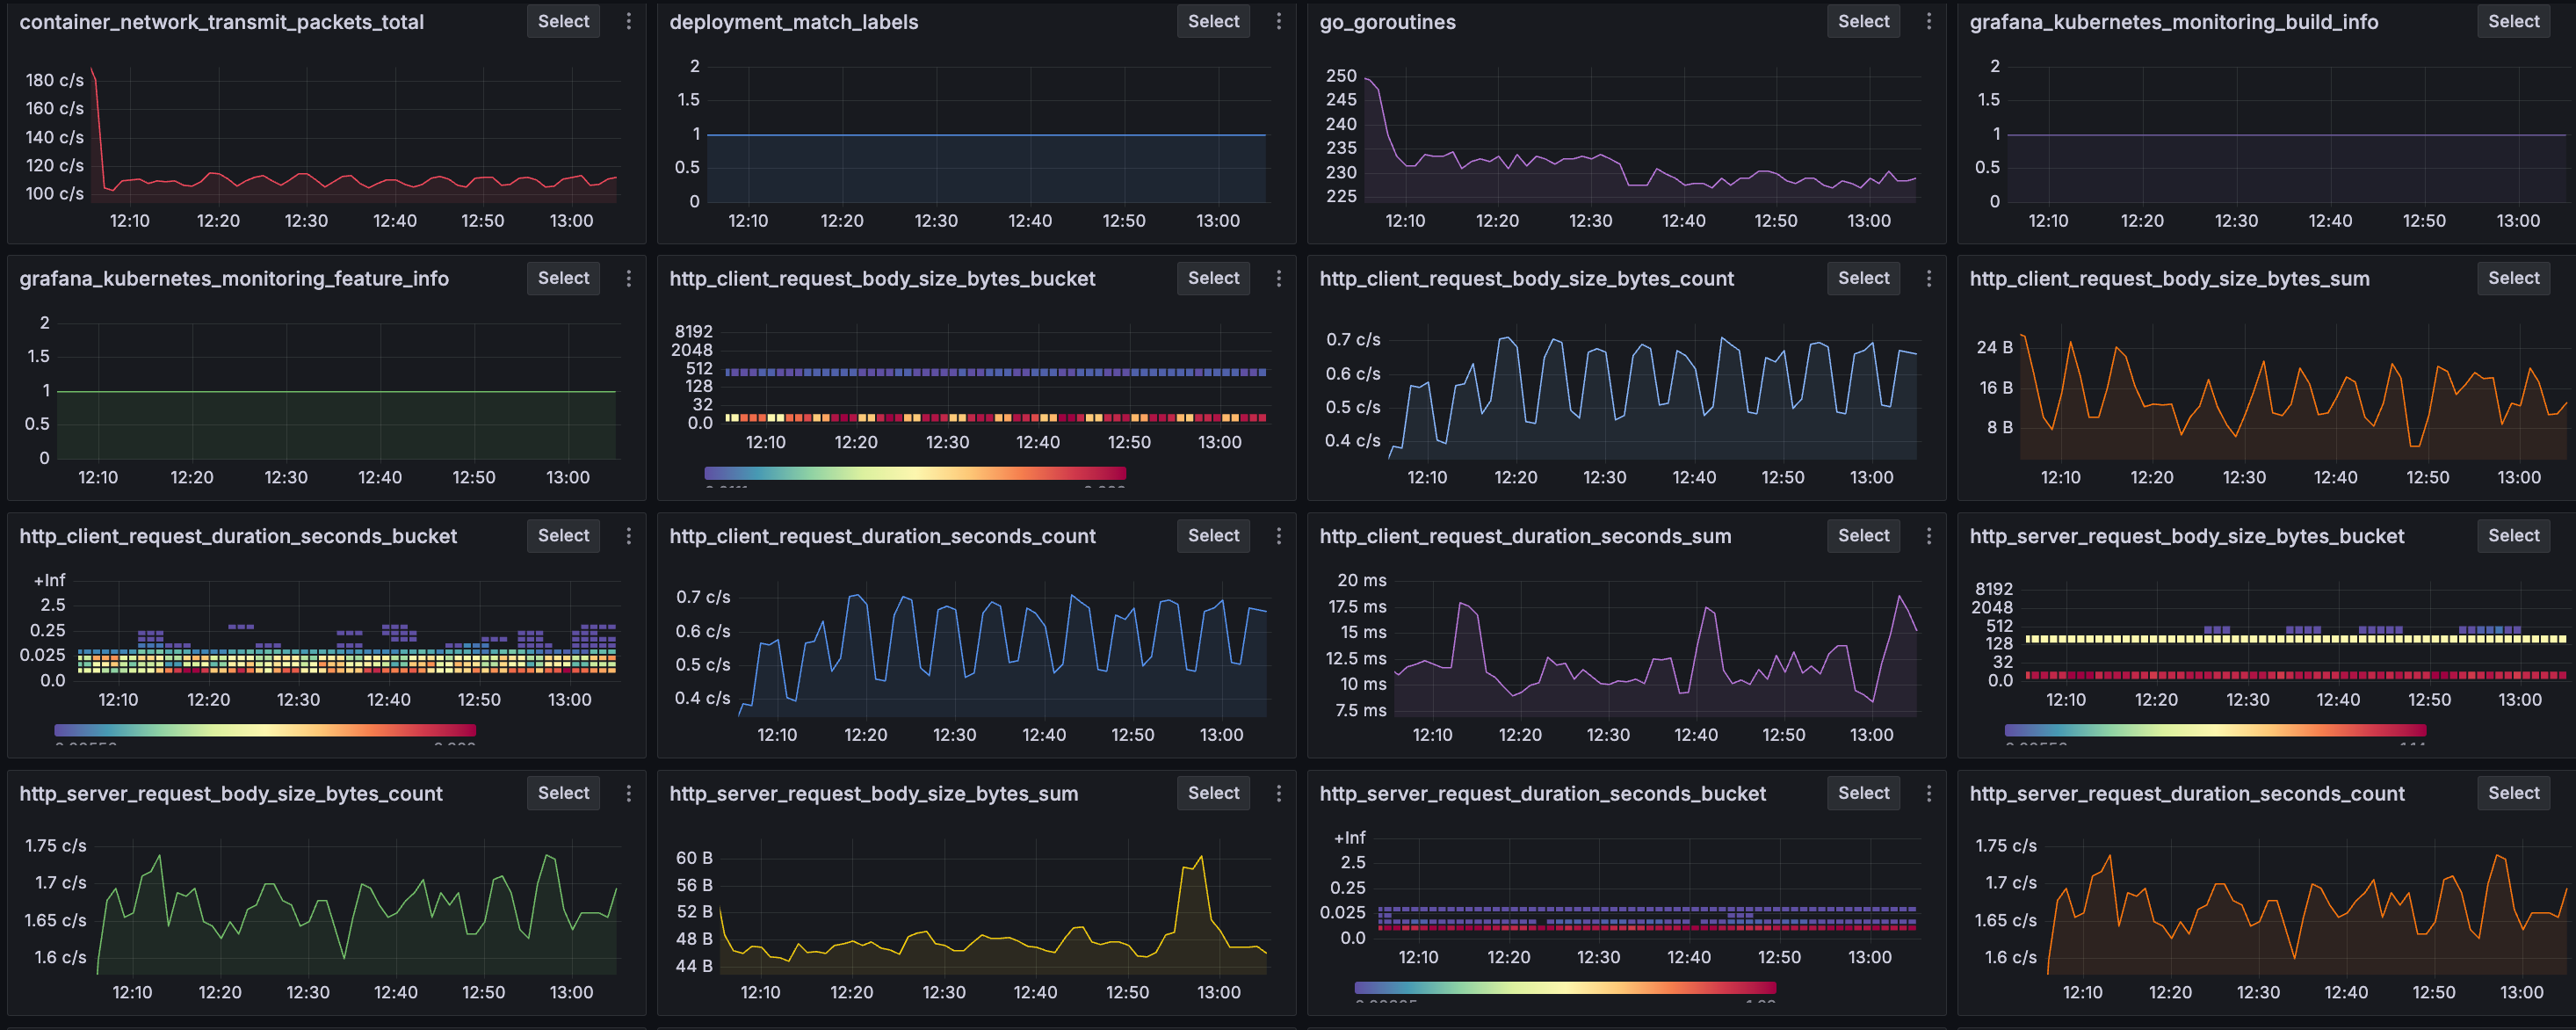
The Metrics Drilldown image below displays metrics related to network utilization, Kubernetes deployment details, and the duration of HTTP client and server requests and responses.
Here’s what to expect
When you complete this journey, you’ll be able to:
- Navigate to Metrics Drilldown
- Search for and filter specific metrics you want to investigate
- Learn how to drill down into a metric and investigate related metrics
- Add a metric visualization to a dashboard
Troubleshooting
If you get stuck, we’ve got your back! Where appropriate, troubleshooting information is just a click away.
More to explore
We understand you might want to explore other capabilities not strictly on this path. We’ll provide you opportunities where it makes sense.
Before you begin
Before you use Metrics Drilldown, ensure that you have:
- A Grafana Cloud account. To create an account, refer to Grafana Cloud.
- Prometheus metrics sent to Grafana Cloud.
- A familiarity with the metrics you plan to examine. Understanding what these metrics measure and how they typically behave will help you identify the significance of any changes.