
Create a metrics alert from a Grafana dashboard visualization
In this milestone, you’ll learn how to navigate from an existing dashboard visualization to create an alert rule. This approach allows you to leverage the queries and thresholds you’ve already configured in your dashboards, making alert creation faster and more accurate.
Starting from a dashboard visualization ensures your alert rule uses the same data source and query logic that you’ve already validated in your dashboard, reducing the risk of configuration errors.
To navigate from a dashboard visualization to create an alert rule, complete the following steps:
Navigate to the dashboard containing the visualization you want to create an alert for.
Locate the panel with the metric you want to monitor.
For example, find a panel showing CPU usage or memory consumption that indicates system health.
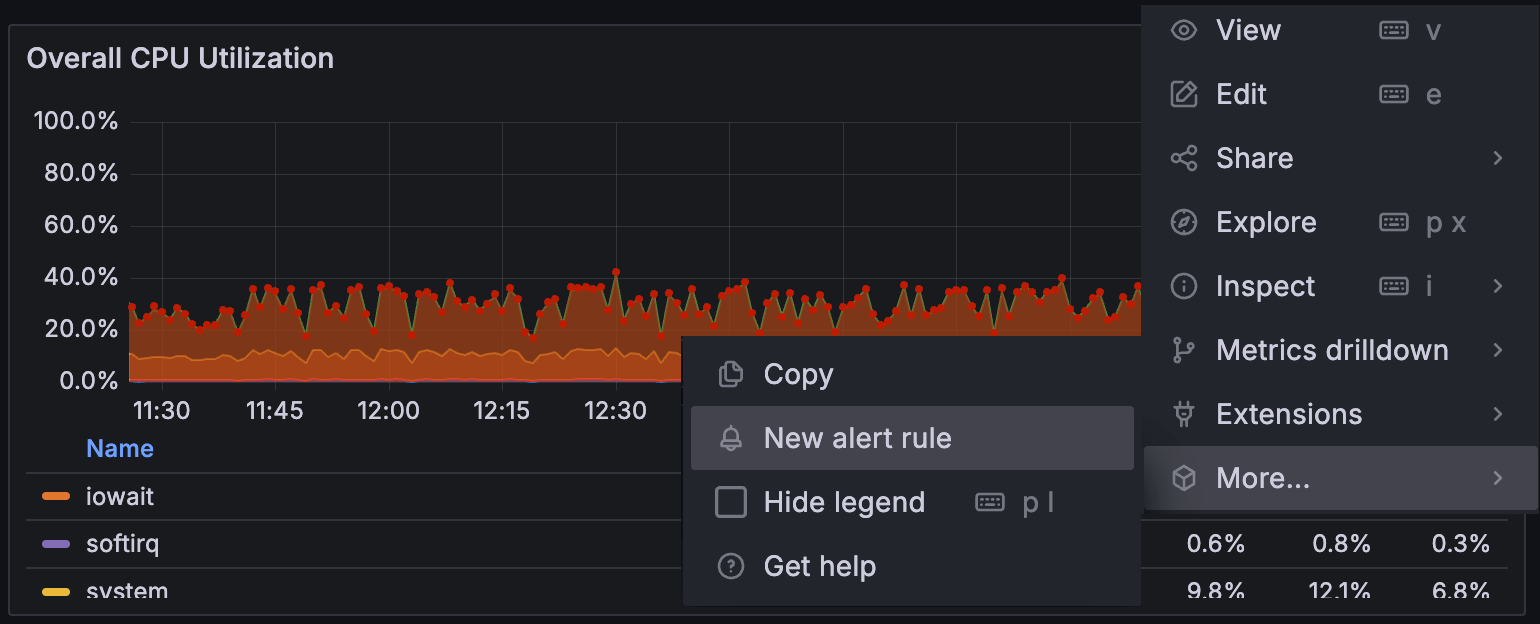
In the panel, click the menu icon and select More > New alert rule.
This opens the alert rule creation interface with the panel’s query and data source already configured.
Verify that the query and data source information has been correctly imported from your dashboard panel.
The query should match what you see in your dashboard visualization, ensuring consistency between your dashboard and alert rule.
The following image shows how to create a new alert rule from a metrics visualization.
In the next milestone, you’ll learn how to name your alert and define the alert rule conditions.