Important: This documentation is about an older version. It's relevant only to the release noted, many of the features and functions have been updated or replaced. Please view the current version.
What’s new in Grafana v8.5
We’re excited to announce Grafana v8.5, with a variety of improvements that focus on Grafana’s usability, performance, and security.
We’ve summarized what’s new in the release here, but you might also be interested in the announcement blog post as well. If you’d like all the details you can check out the complete changelog.
OSS
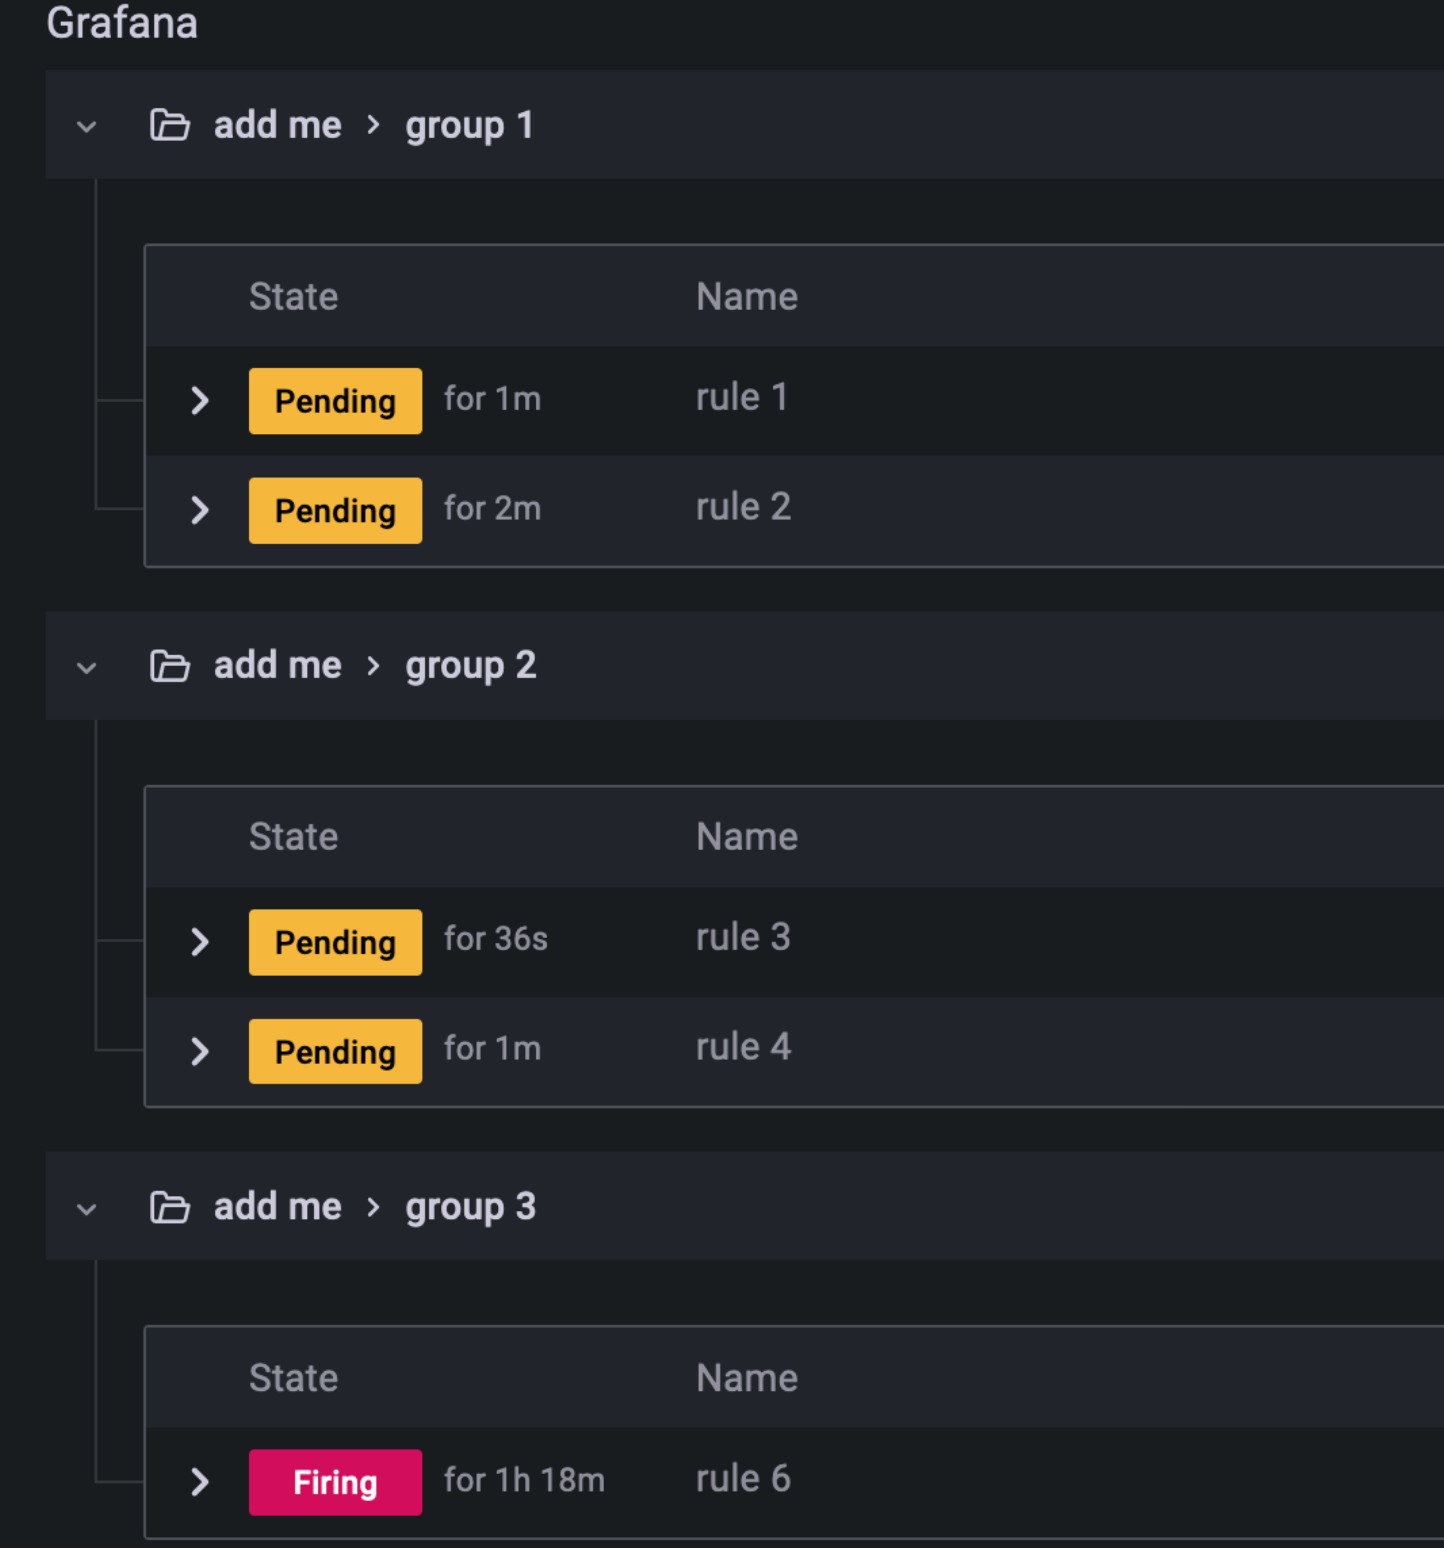
Alerting - group names for Grafana-managed alert rules
It’s been tricky to work with more than a small number of Grafana-managed alert rules without groups in namespaces. They’ve also been inconsistent with the Prometheus Alert Generator Compliance Specification, which made working with Grafana-managed and Prometheus-managed alerts a confusing experience. With this release, you can still see flattened Grafana-managed alerts in the “List” tab, or use the new “Grouped” tab to work with groups:
Choose useful group names, and move alert rules between groups.

Rules in a group are evaluated together, so you can also set the interval for the entire group.
Analytics
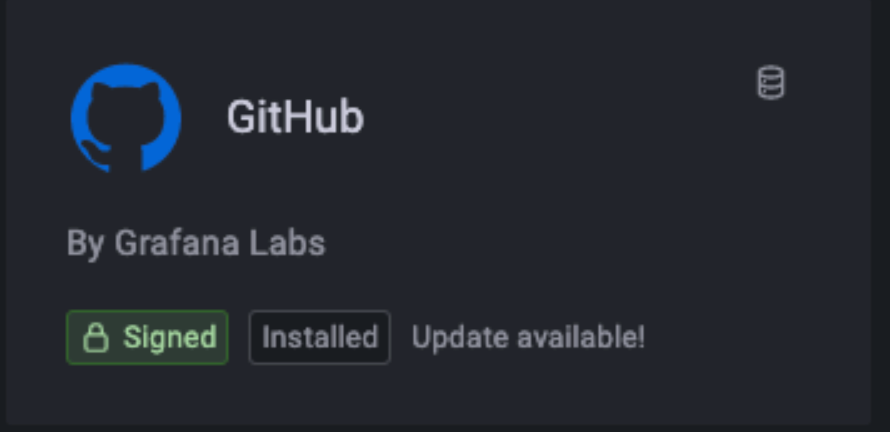
You can now enable Grafana version update checking and Grafana plugins version update checking separately using a new configuration option to separately enable plugin version update checks. The prior version update checking configuration now only controls Grafana version update checks.
When enabled, a check runs every 10 minutes. It will notify, via the UI, when a new version is available. The checks will not prompt any auto-updates of the Grafana software, nor will it send any sensitive information.
Plugin update available:
Grafana update available:

Dashboard Panels
In addition to RSS feeds, the News panel now supports Atom feeds, allowing you to display a wider range of data and information in Grafana.
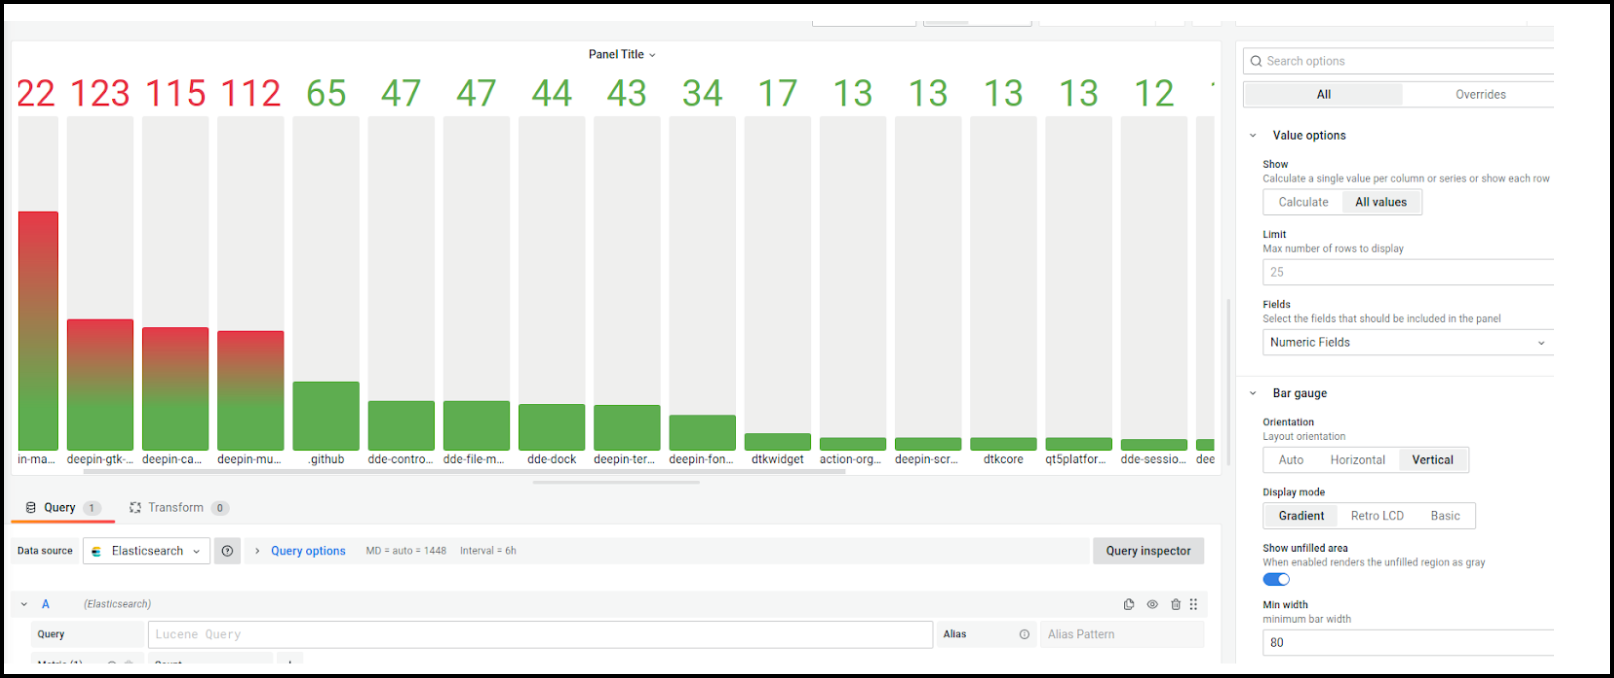
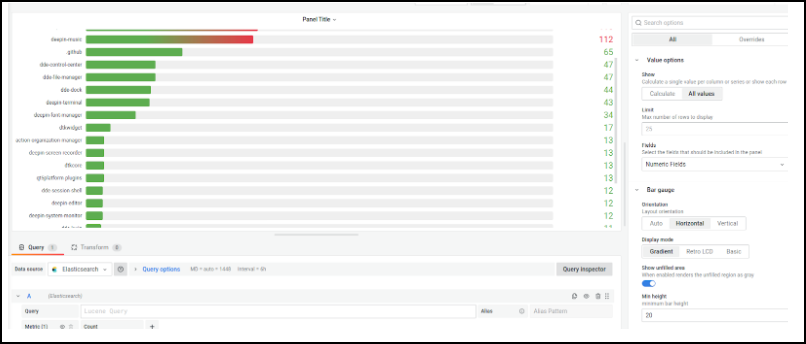
Scrolling in the Bar gauge panel
The Bar gauge panel now supports scrolling to support displaying large datasets while maintaining the readability of labels. You can set a min width or height for the bars (depending on the chart’s orientation), allowing the content to overflow in the container and become scrollable.
Transformations
Template variable substitution
We’ve added support to substitute template variables to transformations. This allows dashboards to be more interactive with transformations when a user inputs calculations and $__interval and $__interval_ms.
Grouping to matrix
A new transformation is available that helps you structure data in a matrix format, using the Grafana table plugin.
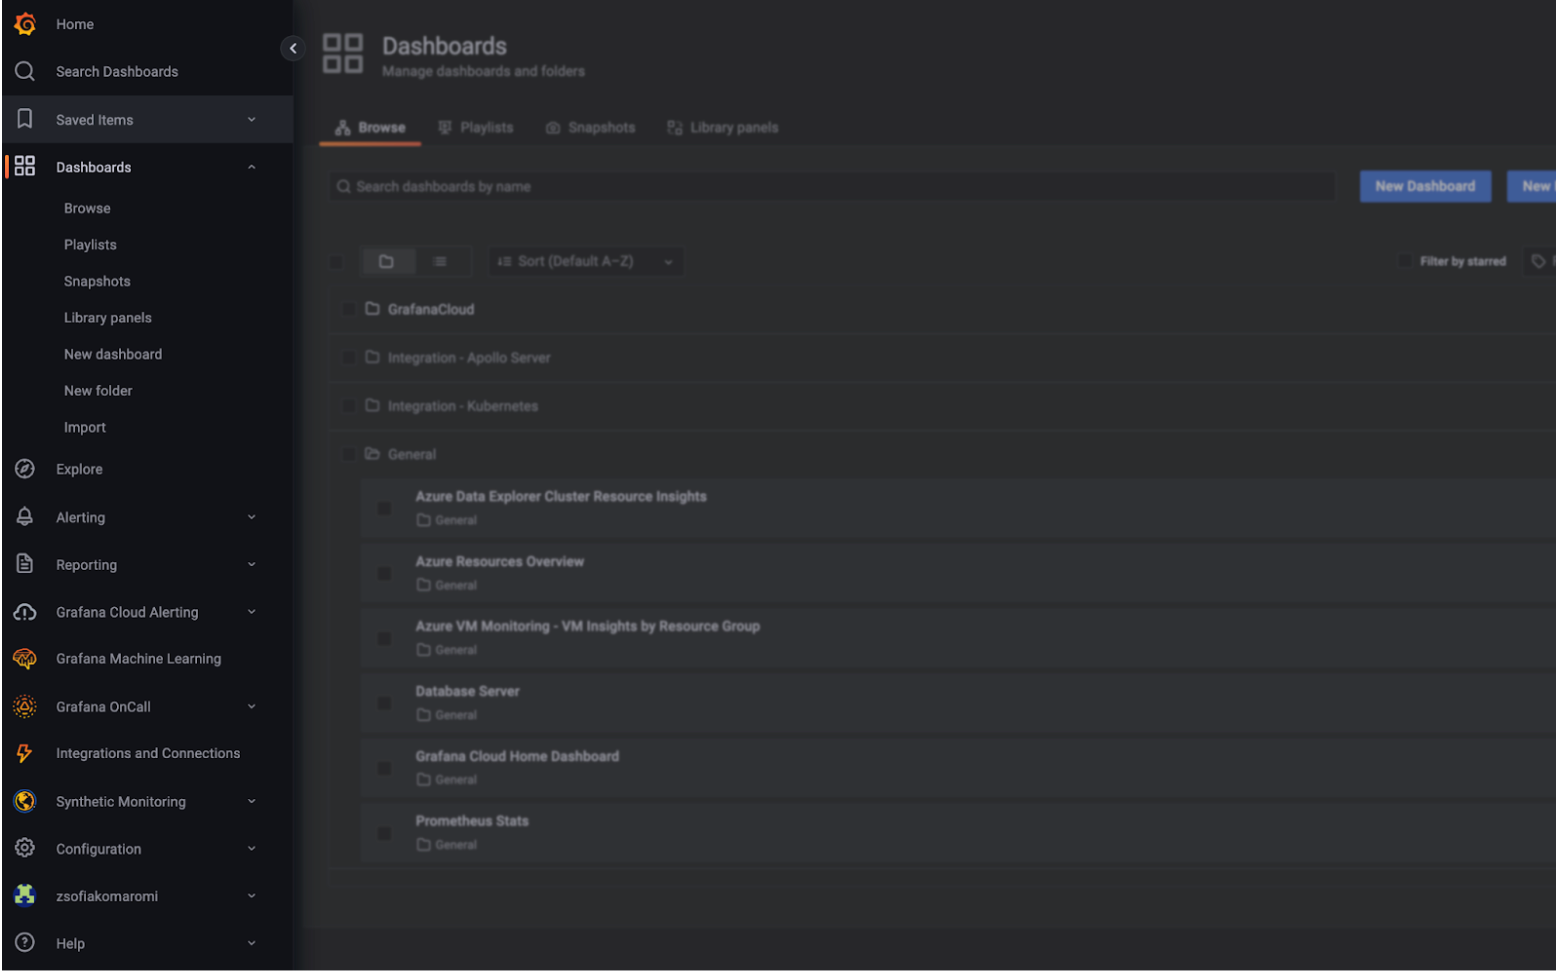
Expanding the navigation bar (Beta)
Available by switching on the ‘newNavigation’ feature toggle. You can expand the navigation bar for a better overview of Grafana’s features and installed integrations. This feature is currently in a beta version and we would appreciate your feedback. Sign up for a call with the Grafana team - it only takes 30 minutes, and you’ll receive a $40 USD gift card as a token of appreciation for your time. US, UK, Canada, Australia, France, Germany, or South Africa: sign up here; Everywhere else in the world: sign up here.
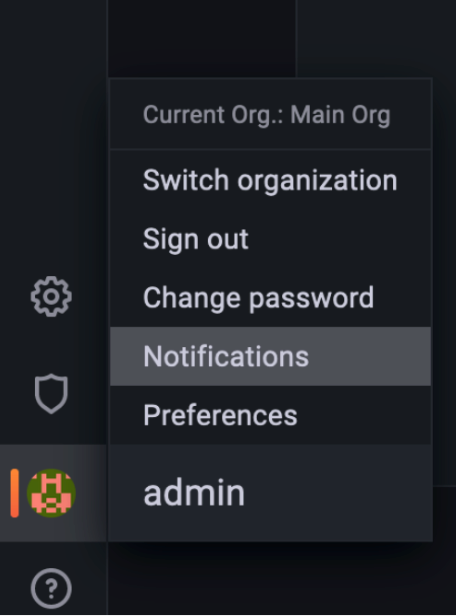
Notifications list for error alerts (Beta)
Available by switching on the ‘persistNotifications’ feature toggle. In order to support debugging issues in Grafana, error alerts that appear when viewing a dashboard now include a trace ID, and these alerts can be accessed under Profile / Notifications.
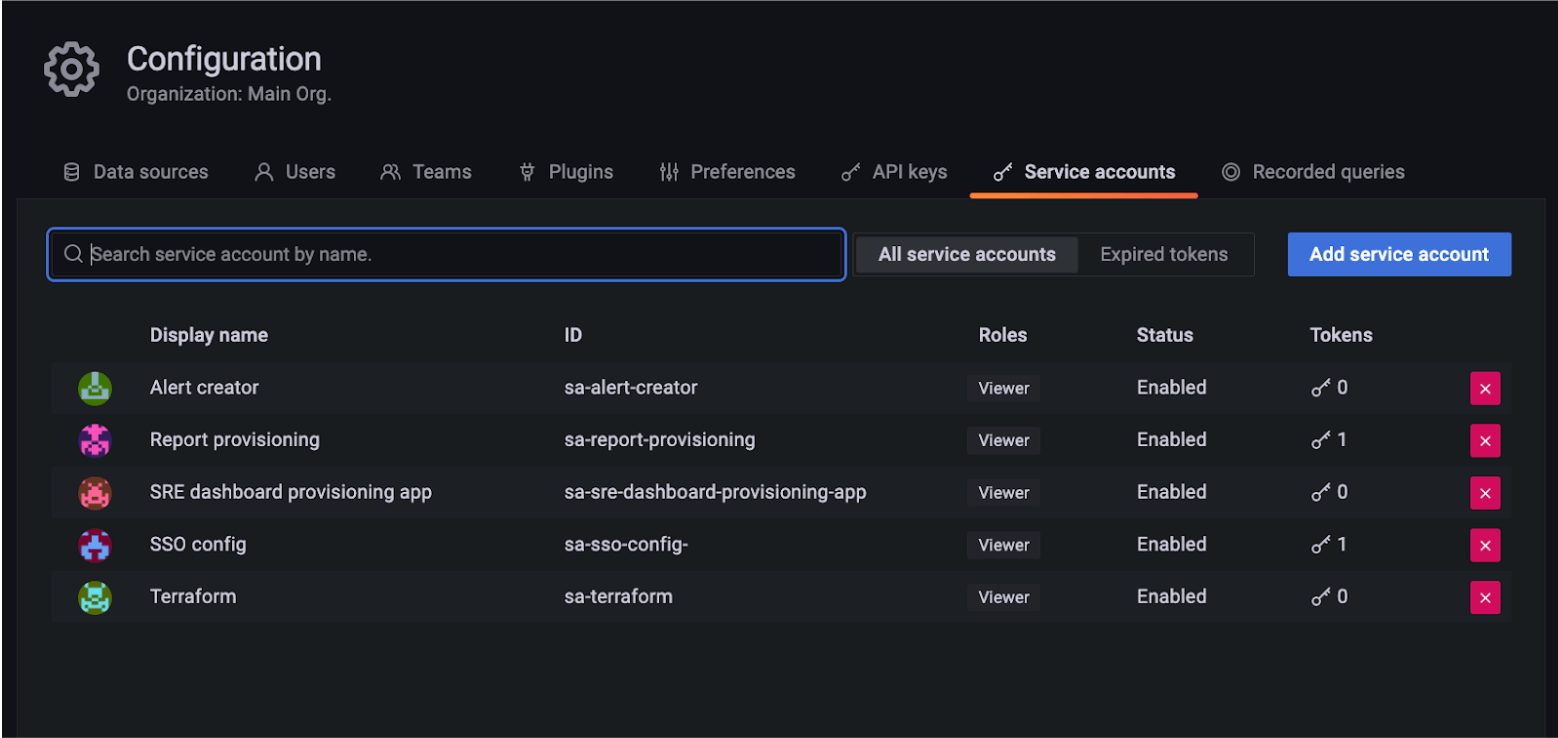
Service accounts (beta)
Service accounts are a major evolution for machine access within Grafana. You can create multiple API tokens per service account with independent expiration dates, and temporarily disable a service account without deleting it. These benefits make Service Accounts a more flexible way for Terraform and other apps to authenticate with Grafana. Service accounts also work with fine-grained access control in Grafana Enterprise: you can improve security by granting service accounts specific roles to limit the functions they can perform. Service accounts are available in beta; you can try them out by enabling the service-accounts feature toggle or, if you use Grafana Cloud, reaching out to our support team for early access. Learn more about Service Accounts in our docs.
Observability
Trace to Logs for Splunk
With Trace to Logs, you can view relevant logs for a trace or span with one click. You can now link to Splunk logs from your tracing datasource. In your tracing datasource, configure Trace to Logs by selecting the Splunk datasource and relevant query options like tags to include in the query.
Experimental Explore to Dashboard workflow
Allows users to create panels directly from within explore.
All queries in Explore get copied over to the new panel, the panel type is automatically selected based on queries’ response With multiple queries, it will view the response from the first, non hidden query to determine the visualization type
This feature is behind the explore2Dashboard feature toggle and is enabled by default.
Grafana Enterprise
Security
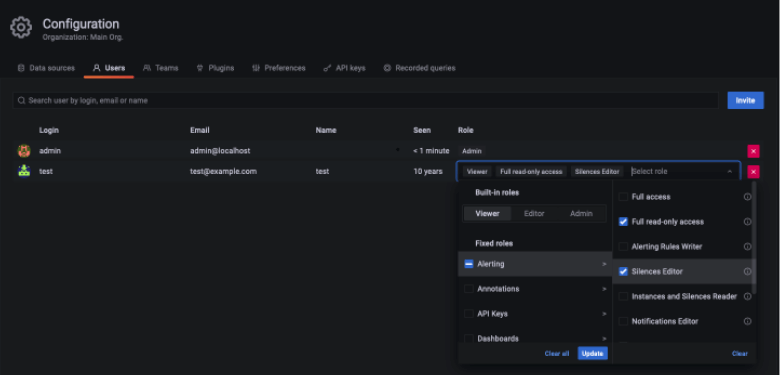
Fine-Grained Access Control comes to Alerting (beta)
Check the Grafana Enterprise / Security section below for more details, including how to enable this beta feature; we’ve implemented
fine-grained access control for alerting rules, notification policies, and contact points in Grafana Enterprise. You can turn on fine-grained access control using the accesscontrol feature toggle, or by reaching out to our support team for early access if you use Grafana Cloud. For more information on fine-grained access control, visit our docs.
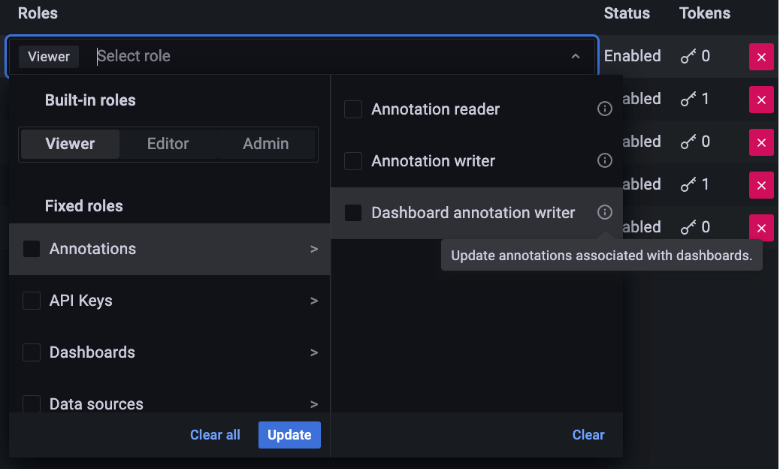
Control access to dashboards, folders, and annotations (beta)
You can now use fine-grained access control to manage which specific users, teams, and roles can create, read, update, or delete dashboards, folders, or annotations. These are the latest services to incorporate fine-grained access control, which helps you dial in the specific access your users should have in Grafana. Fine-grained access control is currently in beta, but general availability is just around the corner, planned for our 9.0 release. You can turn on fine-grained access control using the accesscontrol feature toggle, or by reaching out to our support team for early access if you use Grafana Cloud. For more information on fine-grained access control, visit our docs.
Configure Azure Key Vault using Managed Identities
You can already keep secrets in Grafana’s database (like data source credentials) safer by retrieving your database encryption key from a Key Management Service, like AWS KMS or Azure Key Vault. In Grafana v8.5, you can use an Azure Managed Identity to integrate with Azure Key Vault. This simplifies the Key Vault integration and keeps it consistent with Grafana data sources, like Azure Data Explorer.
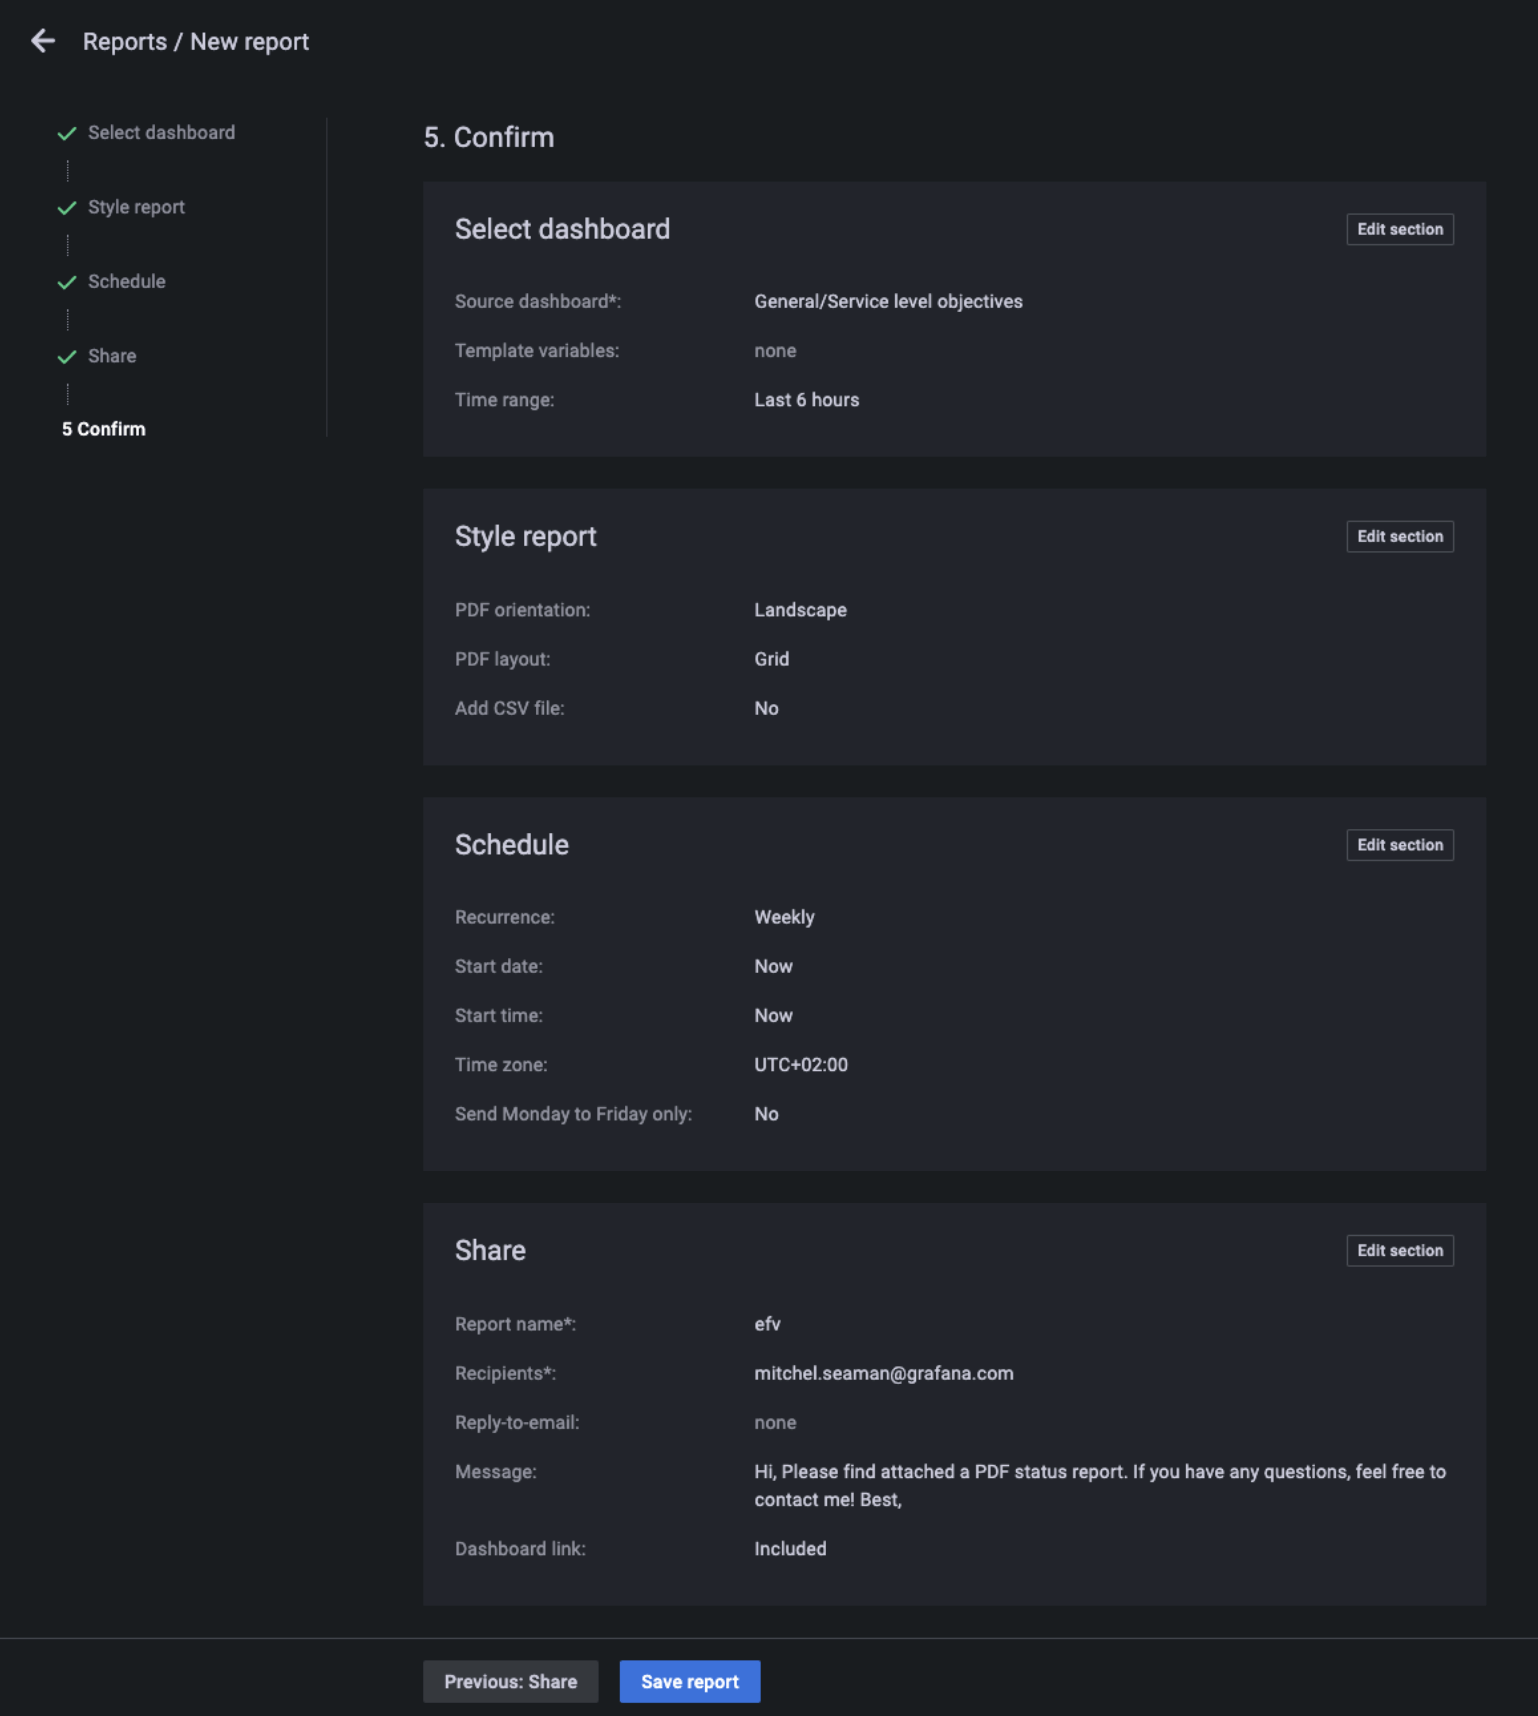
Configure reports more easily
Reports are a great way to share Grafana dashboards by email with users who don’t regularly sign in to Grafana. In 8.5, we’ve revamped the Report authoring UI to make it quicker and easier for you to create reports. View report details at a glance in list view, consider one configuration step at a time, and save reports for later. Also, Grafana will now emit a log every time a report is sent, so you can confirm its status or learn about send errors. Learn more about Reporting in our docs.
