Important: This documentation is about an older version. It's relevant only to the release noted, many of the features and functions have been updated or replaced. Please view the current version.
Manage notification policies
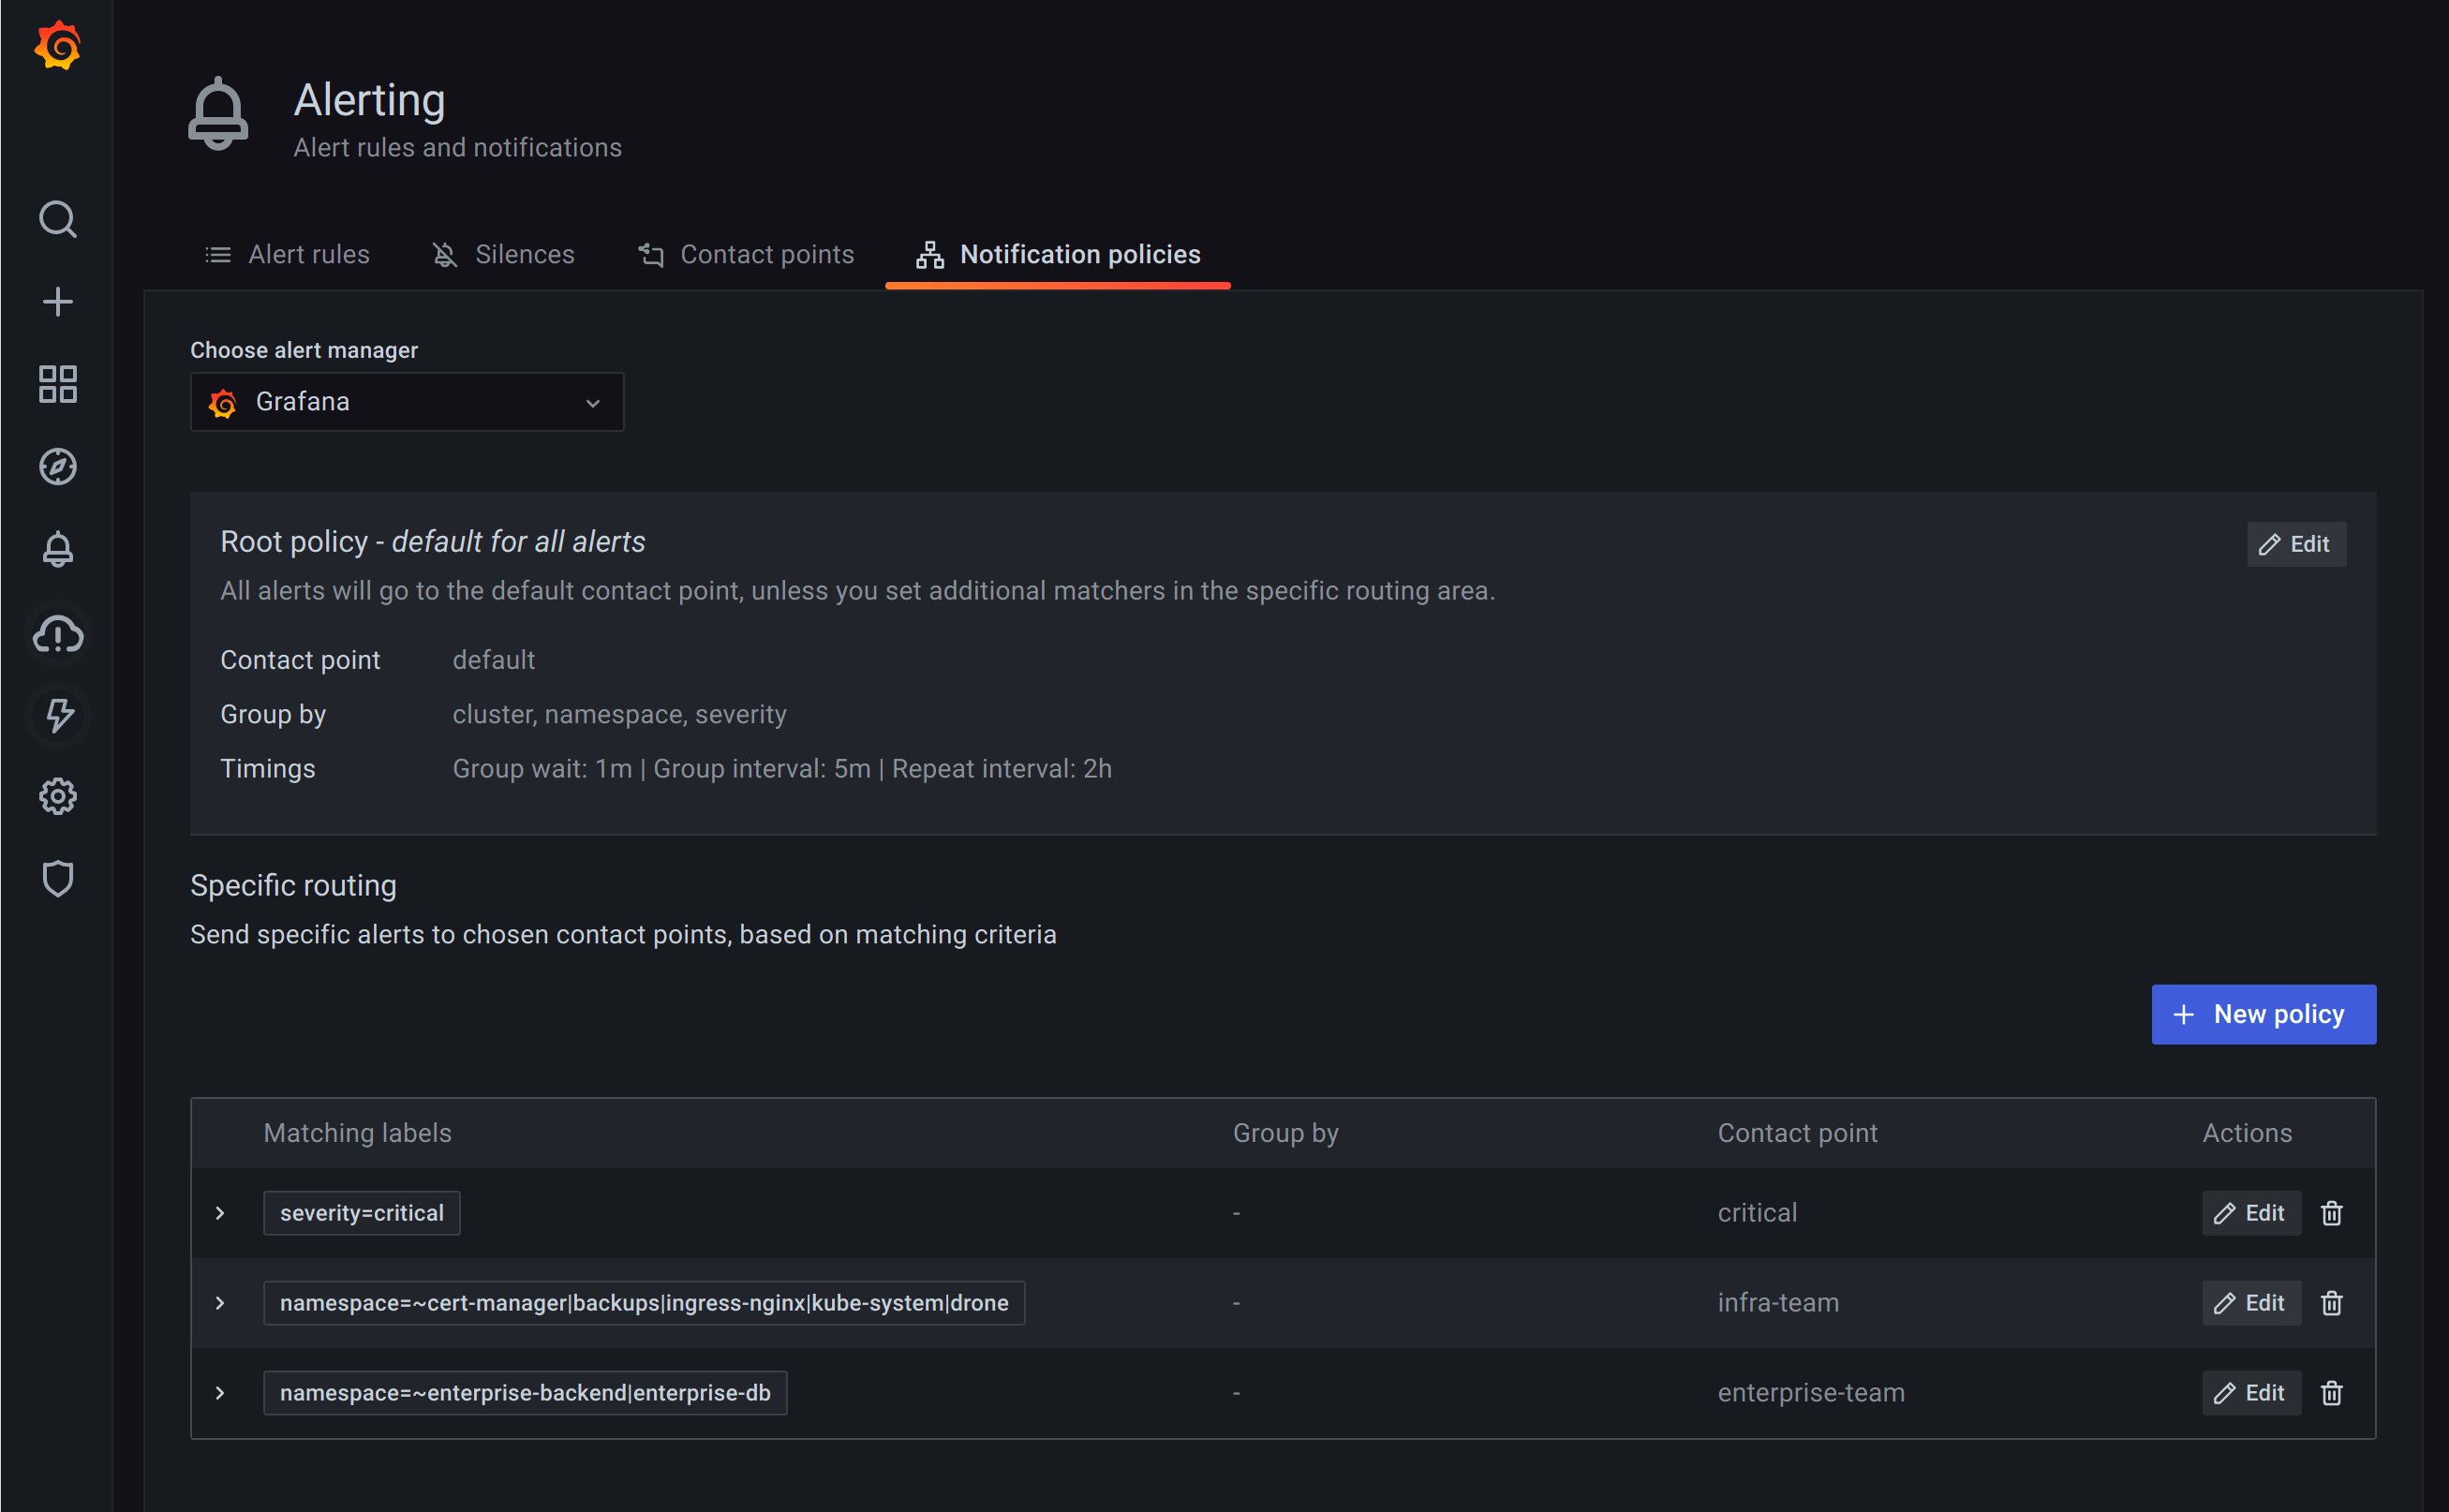
Notification policies determine how alerts are routed to contact points. Policies have a tree structure, where each policy can have one or more child policies. Each policy, except for the root policy, can also match specific alert labels. Each alert is evaluated by the root policy and subsequently by each child policy. If the Continue matching subsequent sibling nodes option is enabled for a specific policy, then evaluation continues even after one or more matches. A parent policy’s configuration settings and contact point information govern the behavior of an alert that does not match any of the child policies. A root policy governs any alert that does not match a specific policy.
You can configure Grafana managed notification policies as well as notification policies for an external Alertmanager data source.
Grouping

Grouping is a new and key concept of Grafana Alerting that categorizes alert notifications of similar nature into a single funnel. This allows you to properly route alert notifications during larger outages when many parts of a system fail at once causing a high number of alerts to fire simultaneously.
For example, suppose you have 100 services connected to a database in different environments. These services are differentiated by the label env=environmentname. An alert rule is in place to monitor whether your services can reach the database named alertname=DatabaseUnreachable.
When a network partition occurs, half of your services can no longer reach the database. As a result, 50 different alerts (assuming half of your services) are fired. For this situation, you want to receive a single-page notification (as opposed to 50) with a list of the environments that are affected.
You can configure grouping to be group_by: [alertname] (take note that the env label is omitted). With this configuration in place, Grafana sends a single compact notification that has all the affected environments for this alert rule.
Note: Grafana also has a special label named
...that you can use to group all alerts by all labels (effectively disabling grouping), therefore each alert will go into its own group. It is different from the default ofgroup_by: nullwhere all alerts go into a single group.
Edit root notification policy
Note: Before Grafana v8.2, the configuration of the embedded Alertmanager was shared across organisations. Users of Grafana 8.0 and 8.1 are advised to use the new Grafana 8 Alerts only if they have one organisation. Otherwise, silences for the Grafana managed alerts will be visible by all organizations.
- In the Grafana menu, click the Alerting (bell) icon to open the Alerting page listing existing alerts.
- Click Notification policies.
- From the Alertmanager dropdown, select an external Alertmanager. By default, the Grafana Alertmanager is selected.
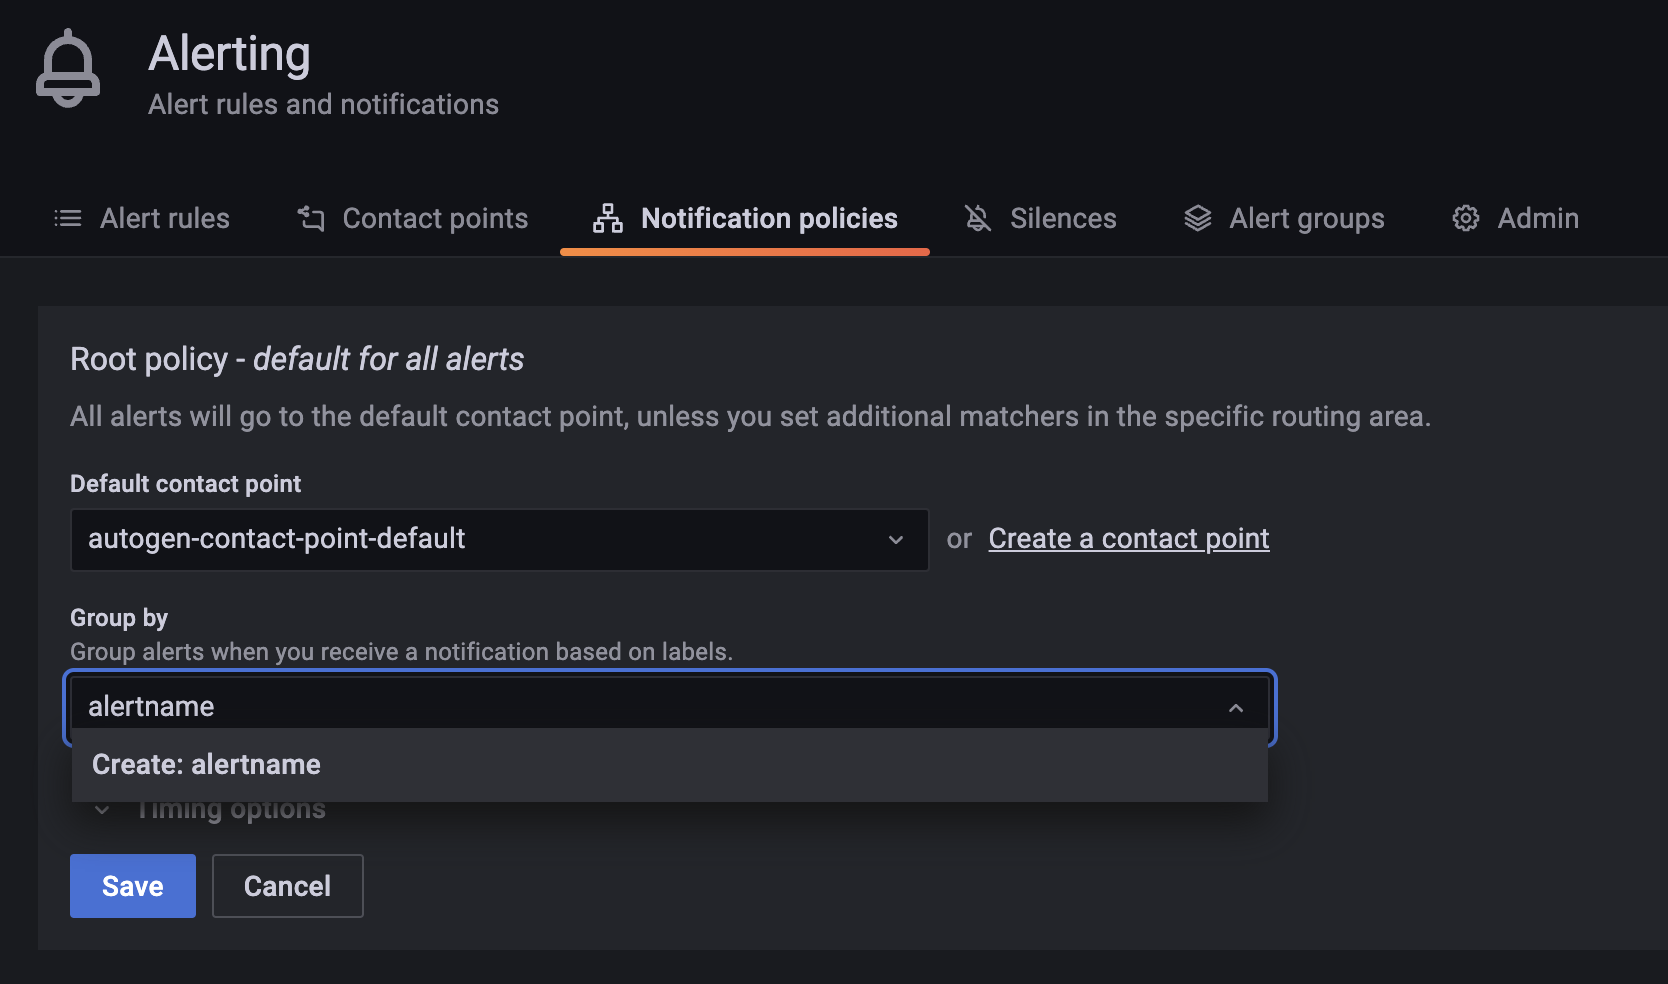
- In the Root policy section, click Edit (pen icon).
- In Default contact point, update the contact point to whom notifications should be sent for rules when alert rules do not match any specific policy.
- In Group by, choose labels to group alerts by. If multiple alerts are matched for this policy, then they are grouped by these labels. A notification is sent per group. If the field is empty (default), then all notifications are sent in a single group. Use a special label
...to group alerts by all labels (which effectively disables grouping). - In Timing options, select from the following options:
- Group wait Time to wait to buffer alerts of the same group before sending an initial notification. Default is 30 seconds.
- Group interval Minimum time interval between two notifications for a group. Default is 5 minutes.
- Repeat interval Minimum time interval for re-sending a notification if no new alerts were added to the group. Default is 4 hours.
- Click Save to save your changes.
Add new specific policy
- In the Grafana menu, click the Alerting (bell) icon to open the Alerting page listing existing alerts.
- Click Notification policies.
- From the Alertmanager dropdown, select an Alertmanager. By default, the Grafana Alertmanager is selected.
- To add a top level specific policy, go to the Specific routing section and click New specific policy.
- In Matching labels section, add one or more rules for matching alert labels.
- In Contact point, add the contact point to send notification to if alert matches only this specific policy and not any of the nested policies.
- Optionally, enable Continue matching subsequent sibling nodes to continue matching sibling policies even after the alert matched the current policy. When this option is enabled, you can get more than one notification for one alert.
- Optionally, enable Override grouping to specify the same grouping as the root policy. If this option is not enabled, the root policy grouping is used.
- Optionally, enable Override general timings to override the timing options configured in the group notification policy.
- Click Save policy to save your changes.
Add nested policy
- Expand the specific policy you want to update.
- Click Add nested policy, then add the details using information in Add new specific policy.
- Click Save policy to save your changes.
Edit specific policy
- In the Alerting page, click Notification policies to open the page listing existing policies.
- Find the policy you want to edit, then click Edit (pen icon).
- Make any changes using instructions in Add new specific policy.
- Click Save policy.
Searching for policies
Grafana allows you to search within the tree of policies by the following:
- Label matchers
- Contact Points
To search by contact point, simply enter a part or full name you are looking for.
To search by label matchers simply enter a valid matcher in the Search by matchers input field. Multiple matchers can be combined with a comma (,).
An example of a valid matchers search input is:
severity=high, region=~EMEA|NASA
All matched policies will be exact matches, we currently do not support regex-style or partial matching.
Example
An example of an alert configuration.
- Create a “default” contact point for slack notifications, and set it on root policy.
- Edit the root policy grouping to group alerts by
cluster,namespaceandseverityso that you get a notification per alert rule and specific kubernetes cluster and namespace. - Create specific route for alerts coming from the development cluster with an appropriate contact point.
- Create a specific route for alerts with “critical” severity with a more invasive contact point integration, like pager duty notification.
- Create specific routes for particular teams that handle their own onduty rotations.


