Important: This documentation is about an older version. It's relevant only to the release noted, many of the features and functions have been updated or replaced. Please view the current version.
Provision Grafana
In previous versions of Grafana, you could only use the API for provisioning data sources and dashboards. But that required the service to be running before you started creating dashboards and you also needed to set up credentials for the HTTP API. In v5.0 we decided to improve this experience by adding a new active provisioning system that uses config files. This will make GitOps more natural as data sources and dashboards can be defined via files that can be version controlled. We hope to extend this system to later add support for users, orgs and alerts as well.
Config File
See Configuration for more information on what you can configure in grafana.ini.
Config File Locations
- Default configuration from
$WORKING_DIR/conf/defaults.ini - Custom configuration from
$WORKING_DIR/conf/custom.ini - The custom configuration file path can be overridden using the
--configparameter
Note: If you have installed Grafana using the
deborrpmpackages, then your configuration file is located at/etc/grafana/grafana.ini. This path is specified in the Grafana init.d script using--configfile parameter.
Using Environment Variables
It is possible to use environment variable interpolation in all 3 provisioning configuration types. Allowed syntax
is either $ENV_VAR_NAME or ${ENV_VAR_NAME} and can be used only for values not for keys or bigger parts
of the configurations. It is not available in the dashboard’s definition files just the dashboard provisioning
configuration.
Example:
datasources:
  - name: Graphite
    url: http://localhost:$PORT
    user: $USER
    secureJsonData:
      password: $PASSWORD
If you have a literal $ in your value and want to avoid interpolation, $$ can be used.
Configuration Management Tools
Currently we do not provide any scripts/manifests for configuring Grafana. Rather than spending time learning and creating scripts/manifests for each tool, we think our time is better spent making Grafana easier to provision. Therefore, we heavily rely on the expertise of the community.
Data sources
This feature is available from v5.0
It’s possible to manage data sources in Grafana by adding one or more YAML config files in the provisioning/datasources directory. Each config file can contain a list of datasources that will get added or updated during start up. If the data source already exists, then Grafana updates it to match the configuration file. The config file can also contain a list of data sources that should be deleted. That list is called deleteDatasources. Grafana will delete data sources listed in deleteDatasources before inserting/updating those in the datasource list.
Running Multiple Grafana Instances
If you are running multiple instances of Grafana you might run into problems if they have different versions of the datasource.yaml configuration file. The best way to solve this problem is to add a version number to each datasource in the configuration and increase it when you update the config. Grafana will only update datasources with the same or lower version number than specified in the config. That way, old configs cannot overwrite newer configs if they restart at the same time.
Example data source Config File
# config file version
apiVersion: 1

# list of datasources that should be deleted from the database
deleteDatasources:
  - name: Graphite
    orgId: 1

# list of datasources to insert/update depending
# what's available in the database
datasources:
  # <string, required> name of the datasource. Required
  - name: Graphite
    # <string, required> datasource type. Required
    type: graphite
    # <string, required> access mode. proxy or direct (Server or Browser in the UI). Required
    access: proxy
    # <int> org id. will default to orgId 1 if not specified
    orgId: 1
    # <string> custom UID which can be used to reference this datasource in other parts of the configuration, if not specified will be generated automatically
    uid: my_unique_uid
    # <string> url
    url: http://localhost:8080
    # <string> database user, if used
    user:
    # <string> database name, if used
    database:
    # <bool> enable/disable basic auth
    basicAuth:
    # <string> basic auth username
    basicAuthUser:
    # <bool> enable/disable with credentials headers
    withCredentials:
    # <bool> mark as default datasource. Max one per org
    isDefault:
    # <map> fields that will be converted to json and stored in jsonData
    jsonData:
      graphiteVersion: '1.1'
      tlsAuth: true
      tlsAuthWithCACert: true
    # <string> json object of data that will be encrypted.
    secureJsonData:
      tlsCACert: '...'
      tlsClientCert: '...'
      tlsClientKey: '...'
      # <string> database password, if used
      password:
      # <string> basic auth password
      basicAuthPassword:
    version: 1
    # <bool> allow users to edit datasources from the UI.
    editable: false
Custom Settings per Datasource
Please refer to each datasource documentation for specific provisioning examples.
JSON Data
Since not all datasources have the same configuration settings we only have the most common ones as fields. The rest should be stored as a json blob in the jsonData field. Here are the most common settings that the core datasources use.
Note: Datasources tagged with HTTP* below denotes any data source which communicates using the HTTP protocol, e.g. all core data source plugins except MySQL, PostgreSQL and MSSQL.
Secure Json Data
{"authType":"keys","defaultRegion":"us-west-2","timeField":"@timestamp"}
Secure json data is a map of settings that will be encrypted with secret key from the Grafana config. The purpose of this is only to hide content from the users of the application. This should be used for storing TLS Cert and password that Grafana will append to the request on the server side. All of these settings are optional.
Note: Datasources tagged with HTTP* below denotes any data source which communicates using the HTTP protocol, e.g. all core data source plugins except MySQL, PostgreSQL and MSSQL.
Custom HTTP headers for datasources
Data sources managed by Grafanas provisioning can be configured to add HTTP headers to all requests
going to that datasource. The header name is configured in the jsonData field and the header value should be
configured in secureJsonData.
apiVersion: 1

datasources:
  - name: Graphite
    jsonData:
      httpHeaderName1: 'HeaderName'
      httpHeaderName2: 'Authorization'
    secureJsonData:
      httpHeaderValue1: 'HeaderValue'
      httpHeaderValue2: 'Bearer XXXXXXXXX'
Plugins
This feature is available from v7.1
You can manage plugin applications in Grafana by adding one or more YAML config files in the provisioning/plugins directory. Each config file can contain a list of apps that will be updated during start up. Grafana updates each app to match the configuration file.
Note: This feature enables you to provision plugin configurations, not the plugins themselves. The plugins must already be installed on the grafana instance
Example plugin configuration file
apiVersion: 1

apps:
  # <string> the type of app, plugin identifier. Required
  - type: raintank-worldping-app
    # <int> Org ID. Default to 1, unless org_name is specified
    org_id: 1
    # <string> Org name. Overrides org_id unless org_id not specified
    org_name: Main Org.
    # <bool> disable the app. Default to false.
    disabled: false
    # <map> fields that will be converted to json and stored in jsonData. Custom per app.
    jsonData:
      # key/value pairs of string to object
      key: value
    # <map> fields that will be converted to json, encrypted and stored in secureJsonData. Custom per app.
    secureJsonData:
      # key/value pairs of string to string
      key: value
Dashboards
You can manage dashboards in Grafana by adding one or more YAML config files in the provisioning/dashboards directory. Each config file can contain a list of dashboards providers that load dashboards into Grafana from the local filesystem.
The dashboard provider config file looks somewhat like this:
apiVersion: 1

providers:
  # <string> an unique provider name. Required
  - name: 'a unique provider name'
    # <int> Org id. Default to 1
    orgId: 1
    # <string> name of the dashboard folder.
    folder: ''
    # <string> folder UID. will be automatically generated if not specified
    folderUid: ''
    # <string> provider type. Default to 'file'
    type: file
    # <bool> disable dashboard deletion
    disableDeletion: false
    # <int> how often Grafana will scan for changed dashboards
    updateIntervalSeconds: 10
    # <bool> allow updating provisioned dashboards from the UI
    allowUiUpdates: false
    options:
      # <string, required> path to dashboard files on disk. Required when using the 'file' type
      path: /var/lib/grafana/dashboards
      # <bool> use folder names from filesystem to create folders in Grafana
      foldersFromFilesStructure: true
When Grafana starts, it will update/insert all dashboards available in the configured path. Then later on poll that path every updateIntervalSeconds and look for updated json files and update/insert those into the database.
Note: Dashboards are provisioned to the General folder if the
folderoption is missing or empty.
Making changes to a provisioned dashboard
It’s possible to make changes to a provisioned dashboard in the Grafana UI. However, it is not possible to automatically save the changes back to the provisioning source.
If allowUiUpdates is set to true and you make changes to a provisioned dashboard, you can Save the dashboard then changes will be persisted to the Grafana database.
Note: If a provisioned dashboard is saved from the UI and then later updated from the source, the dashboard stored in the database will always be overwritten. The
versionproperty in the JSON file will not affect this, even if it is lower than the existing dashboard.If a provisioned dashboard is saved from the UI and the source is removed, the dashboard stored in the database will be deleted unless the configuration option
disableDeletionis set to true.
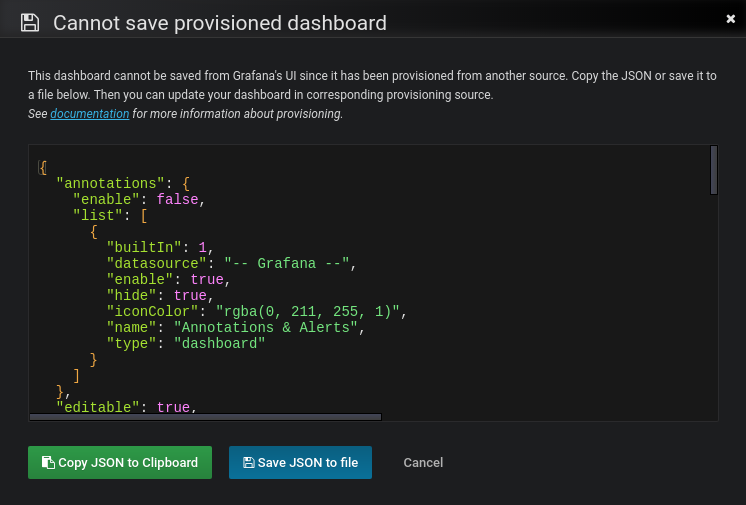
If allowUiUpdates is configured to false, you are not able to make changes to a provisioned dashboard. When you click Save, Grafana brings up a Cannot save provisioned dashboard dialog. The screenshot below illustrates this behavior.
Grafana offers options to export the JSON definition of a dashboard. Either Copy JSON to Clipboard or Save JSON to file can help you synchronize your dashboard changes back to the provisioning source.
Note: The JSON definition in the input field when using Copy JSON to Clipboard or Save JSON to file will have the id field automatically removed to aid the provisioning workflow.
Reusable Dashboard URLs
If the dashboard in the JSON file contains an UID, Grafana forces insert/update on that UID. This allows you to migrate dashboards between Grafana instances and provisioning Grafana from configuration without breaking the URLs given because the new dashboard URL uses the UID as identifier.
When Grafana starts, it updates/inserts all dashboards available in the configured folders. If you modify the file, then the dashboard is also updated.
By default, Grafana deletes dashboards in the database if the file is removed. You can disable this behavior using the disableDeletion setting.
Note: Provisioning allows you to overwrite existing dashboards which leads to problems if you re-use settings that are supposed to be unique. Be careful not to re-use the same
titlemultiple times within a folder oruidwithin the same installation as this will cause weird behaviors.
Provision folders structure from filesystem to Grafana
If you already store your dashboards using folders in a git repo or on a filesystem, and also you want to have the same folder names in the Grafana menu, you can use foldersFromFilesStructure option.
For example, to replicate these dashboards structure from the filesystem to Grafana,
/etc/dashboards
├── /server
│   ├── /common_dashboard.json
│   └── /network_dashboard.json
└── /application
    ├── /requests_dashboard.json
    └── /resources_dashboard.json
you need to specify just this short provision configuration file.
apiVersion: 1

providers:
  - name: dashboards
    type: file
    updateIntervalSeconds: 30
    options:
      path: /etc/dashboards
      foldersFromFilesStructure: true
server and application will become new folders in Grafana menu.
Note:
folderandfolderUidoptions should be empty or missing to makefoldersFromFilesStructurework.
Note: To provision dashboards to the General folder, store them in the root of your
path.
Alerting
You can manage alert objects in Grafana by adding one or more YAML or JSON
configuration files in the provisioning/alerting
directory. Those files will be applied when starting Grafana. When Grafana
is running, it’s possible to do a hot reload using the
Admin API.
Rules
Creation
# config file version
apiVersion: 1

# List of rule groups to import or update
groups:
  # <int> organization ID, default = 1
  - orgId: 1
    # <string, required> name of the rule group
    name: my_rule_group
    # <string, required> name of the folder the rule group will be stored in
    folder: my_first_folder
    # <duration, required> interval that the rule group should evaluated at
    interval: 60s
    # <list, required> list of rules that are part of the rule group
    rules:
      # <string, required> unique identifier for the rule
      - uid: my_id_1
        # <string, required> title of the rule that will be displayed in the UI
        title: my_first_rule
        # <string, required> which query should be used for the condition
        condition: A
        # <list, required> list of query objects that should be executed on each
        #                  evaluation - should be obtained trough the API
        data:
          - refId: A
            datasourceUid: '-100'
            model:
              conditions:
                - evaluator:
                    params:
                      - 3
                    type: gt
                  operator:
                    type: and
                  query:
                    params:
                      - A
                  reducer:
                    type: last
                  type: query
              datasource:
                type: __expr__
                uid: '-100'
              expression: 1==0
              intervalMs: 1000
              maxDataPoints: 43200
              refId: A
              type: math
        # <string> UID of a dashboard that the alert rule should be linked to
        dashboardUid: my_dashboard
        # <int> ID of the panel that the alert rule should be linked to
        panelId: 123
        # <string> the state the alert rule will have when no data is returned
        #          possible values: "NoData", "Alerting", "OK", default = NoData
        noDataState: Alerting
        # <string> the state the alert rule will have when the query execution
        #          failed - possible values: "Error", "Alerting", "OK"
        #          default = Alerting
        # <duration, required> for how long should the alert fire before alerting
        for: 60s
        # <map<string, string>> a map of strings to pass around any data
        annotations:
          some_key: some_value
        # <map<string, string> a map of strings that can be used to filter and
        #                      route alerts
        labels:
          team: sre_team_1
Deletion
# config file version
apiVersion: 1

# List of alert rule UIDs that should be deleted
deleteRules:
  # <int> organization ID, default = 1
  - orgId: 1
    # <string, required> unique identifier for the rule
    uid: my_id_1
Contact points
Creation
# config file version
apiVersion: 1

# List of contact points to import or update
contactPoints:
  # <int> organization ID, default = 1
  - orgId: 1
    # <string, required> name of the contact point
    name: cp_1
    receivers:
      # <string, required> unique identifier for the receiver
      - uid: first_uid
        # <string, required> type of the receiver
        type: prometheus-alertmanager
        # <object, required> settings for the specific receiver type
        settings:
          url: http://test:9000
Deletion
# config file version
apiVersion: 1

# List of receivers that should be deleted
deleteContactPoints:
  # <int> organization ID, default = 1
  - orgId: 1
    # <string, required> unique identifier for the receiver
    uid: first_uid
Settings
Here we showcase what kind of settings you can have for the different contact point types.
Alertmanager
type: prometheus-alertmanager
settings:
  # <string, required>
  url: http://localhost:9093
  # <string>
  basicAuthUser: abc
  # <string>
  basicAuthPassword: abc123
DingDing
type: dingding
settings:
  # <string, required>
  url: https://oapi.dingtalk.com/robot/send?access_token=xxxxxxxxx
  # <string> options: link, actionCard
  msgType: link
  # <string>
  message: |
    {{ template "default.message" . }}
Discord
type: discord
settings:
  # <string, required>
  url: https://discord/webhook
  # <string>
  avatar_url: https://my_avatar
  # <string>
  use_discord_username: Grafana
  # <string>
  message: |
{{ template "default.message" . }}type: email
settings:
# <string, required>
addresses: me@example.com;you@example.com
# <bool>
singleEmail: false
# <string>
message: my optional message to include
# <string>
subject: |
{{ template "default.title" . }}Google Hangouts Chat
type: googlechat
settings:
  # <string, required>
  url: https://google/webhook
  # <string>
  message: |
    {{ template "default.message" . }}
Kafka
type: kafka
settings:
  # <string, required>
  kafkaRestProxy: http://localhost:8082
  # <string, required>
  kafkaTopic: topic1
LINE
type: line
settings:
  # <string, required>
  token: xxx
Microsoft Teams
type: teams
settings:
  # <string, required>
  url: https://ms_teams_url
  # <string>
  title: |
    {{ template "default.title" . }}
  # <string>
  sectiontitle: ''
  # <string>
  message: |
    {{ template "default.message" . }}
OpsGenie
type: opsgenie
settings:
  # <string, required>
  apiKey: xxx
  # <string, required>
  apiUrl: https://api.opsgenie.com/v2/alerts
  # <string>
  message: |
    {{ template "default.title" . }}
  # <string>
  description: some descriptive description
  # <bool>
  autoClose: false
  # <bool>
  overridePriority: false
  # <string> options: tags, details, both
  sendTagsAs: both
PagerDuty
type: pagerduty
settings:
  # <string, required>
  integrationKey: XXX
  # <string> options: critical, error, warning, info
  severity: critical
  # <string>
  class: ping failure
  # <string>
  component: Grafana
  # <string>
  group: app-stack
  # <string>
  summary: |
    {{ template "default.message" . }}
Pushover
type: pushover
settings:
  # <string, required>
  apiToken: XXX
  # <string, required>
  userKey: user1,user2
  # <string>
  device: device1,device2
  # <string> options (high to low): 2,1,0,-1,-2
  priority: '2'
  # <string>
  retry: '30'
  # <string>
  expire: '120'
  # <string>
  sound: siren
  # <string>
  okSound: magic
  # <string>
  message: |
    {{ template "default.message" . }}
Slack
type: slack
settings:
  # <string, required>
  recipient: alerting-dev
  # <string, required>
  token: xxx
  # <string>
  username: grafana_bot
  # <string>
  icon_emoji: heart
  # <string>
  icon_url: https://icon_url
  # <string>
  mentionUsers: user_1,user_2
  # <string>
  mentionGroups: group_1,group_2
  # <string> options: here, channel
  mentionChannel: here
  # <string> Optionally provide a Slack incoming webhook URL for sending messages, in this case the token isn't necessary
  url: https://some_webhook_url
  # <string>
  endpointUrl: https://custom_url/api/chat.postMessage
  # <string>
  title: |
    {{ template "slack.default.title" . }}
  text: |
    {{ template "slack.default.text" . }}
Sensu Go
type: sensugo
settings:
  # <string, required>
  url: http://sensu-api.local:8080
  # <string, required>
  apikey: xxx
  # <string>
  entity: default
  # <string>
  check: default
  # <string>
  handler: some_handler
  # <string>
  namespace: default
  # <string>
  message: |
    {{ template "default.message" . }}
Telegram
type: telegram
settings:
  # <string, required>
  bottoken: xxx
  # <string, required>
  chatid: some_chat_id
  # <string>
  message: |
    {{ template "default.message" . }}
Threema Gateway
type: threema
settings:
  # <string, required>
  api_secret: xxx
  # <string, required>
  gateway_id: A5K94S9
  # <string, required>
  recipient_id: A9R4KL4S
VictorOps
type: victorops
settings:
  # <string, required>
  url: XXX
  # <string> options: CRITICAL, WARNING
  messageType: CRITICAL
Webhook
type: webhook
settings:
  # <string, required>
  url: https://endpoint_url
  # <string> options: POST, PUT
  httpMethod: POST
  # <string>
  username: abc
  # <string>
  password: abc123
  # <string>
  authorization_scheme: Bearer
  # <string>
  authorization_credentials: abc123
  # <string>
  maxAlerts: '10'
WeCom
type: wecom
settings:
  # <string, required>
  url: https://qyapi.weixin.qq.com/cgi-bin/webhook/send?key=xxxxxxxx
  # <string>
  message: |
    {{ template "default.message" . }}
  # <string>
  title: |
    {{ template "default.title" . }}
Notification policies
Create
# config file version
apiVersion: 1

# List of notification policies
policies:
  # <int> organization ID, default = 1
  - orgId: 1
    # <string> name of the contact point that should be used for this route
    receiver: grafana-default-email
    # <list> The labels by which incoming alerts are grouped together. For example,
    #        multiple alerts coming in for cluster=A and alertname=LatencyHigh would
    #        be batched into a single group.
    #
    #        To aggregate by all possible labels use the special value '...' as
    #        the sole label name, for example:
    #        group_by: ['...']
    #        This effectively disables aggregation entirely, passing through all
    #        alerts as-is. This is unlikely to be what you want, unless you have
    #        a very low alert volume or your upstream notification system performs
    #        its own grouping.
    group_by: ['...']
    # <list> a list of matchers that an alert has to fulfill to match the node
    matchers:
      - alertname = Watchdog
      - severity =~ "warning|critical"
    # <list> Times when the route should be muted. These must match the name of a
    #        mute time interval.
    #        Additionally, the root node cannot have any mute times.
    #        When a route is muted it will not send any notifications, but
    #        otherwise acts normally (including ending the route-matching process
    #        if the `continue` option is not set)
    mute_time_intervals:
      - abc
    # <duration> How long to initially wait to send a notification for a group
    #            of alerts. Allows to collect more initial alerts for the same group.
    #            (Usually ~0s to few minutes), default = 30s
    group_wait: 30s
    # <duration> How long to wait before sending a notification about new alerts that
    #            are added to a group of alerts for which an initial notification has
    #            already been sent. (Usually ~5m or more), default = 5m
    group_interval: 5m
    # <duration>  How long to wait before sending a notification again if it has already
    #             been sent successfully for an alert. (Usually ~3h or more), default = 4h
    repeat_interval: 4h
    # <list> Zero or more child routes
    # routes:
    # ...
Reset
# config file version
apiVersion: 1

# List of orgIds that should be reset to the default policy
resetPolicies:
  - 1
Templates
Creation
# config file version
apiVersion: 1

# List of templates to import or update
templates:
  # <int> organization ID, default = 1
  - orgID: 1
    # <string, required> name of the template, must be unique
    name: my_first_template
    # <string, required> content of the the template
    template: Alerting with a custom text template
Deletion
# config file version
apiVersion: 1

# List of alert rule UIDs that should be deleted
deleteTemplates:
  # <int> organization ID, default = 1
  - orgId: 1
    # <string, required> name of the template, must be unique
    name: my_first_template
Mute timings
Creation
# config file version
apiVersion: 1

# List of mute time intervals to import or update
muteTimes:
  # <int> organization ID, default = 1
  - orgId: 1
    # <string, required> name of the mute time interval, must be unique
    name: mti_1
    # <list> time intervals that should trigger the muting
    #        refer to https://prometheus.io/docs/alerting/latest/configuration/#time_interval-0
    time_intervals:
      - times:
          - start_time: '06:00'
            end_time: '23:59'
        weekdays: ['monday:wednesday', 'saturday', 'sunday']
        months: ['1:3', 'may:august', 'december']
        years: ['2020:2022', '2030']
        days_of_month: ['1:5', '-3:-1']
Deletion
# config file version
apiVersion: 1

# List of mute time intervals that should be deleted
deleteMuteTimes:
  # <int> organization ID, default = 1
  - orgId: 1
    # <string, required> name of the mute time interval, must be unique
    name: mti_1
Alert Notification Channels
Note: Alert Notification Channels are part of legacy alerting, which is deprecated and will be removed in Grafana 10. Use Contact Points in the alerting section above.
Alert Notification Channels can be provisioned by adding one or more YAML config files in the provisioning/notifiers directory.
Each config file can contain the following top-level fields:
notifiers, a list of alert notifications that will be added or updated during start up. If the notification channel already exists, Grafana will update it to match the configuration file.delete_notifiers, a list of alert notifications to be deleted before inserting/updating those in thenotifierslist.
Provisioning looks up alert notifications by uid, and will update any existing notification with the provided uid.
By default, exporting a dashboard as JSON will use a sequential identifier to refer to alert notifications. The field uid can be optionally specified to specify a string identifier for the alert name.
{
  ...
      "alert": {
        ...,
        "conditions": [...],
        "frequency": "24h",
        "noDataState": "ok",
        "notifications": [
           {"uid": "notifier1"},
           {"uid": "notifier2"},
        ]
      }
  ...
}
Example Alert Notification Channels Config File
notifiers:
  - name: notification-channel-1
    type: slack
    uid: notifier1
    # either
    org_id: 2
    # or
    org_name: Main Org.
    is_default: true
    send_reminder: true
    frequency: 1h
    disable_resolve_message: false
    # See `Supported Settings` section for settings supported for each
    # alert notification type.
    settings:
      recipient: 'XXX'
      uploadImage: true
      token: 'xoxb' # legacy setting since Grafana v7.2 (stored non-encrypted)
      url: https://slack.com # legacy setting since Grafana v7.2 (stored non-encrypted)
    # Secure settings that will be encrypted in the database (supported since Grafana v7.2). See `Supported Settings` section for secure settings supported for each notifier.
    secure_settings:
      token: 'xoxb'
      url: https://slack.com

delete_notifiers:
  - name: notification-channel-1
    uid: notifier1
    # either
    org_id: 2
    # or
    org_name: Main Org.
  - name: notification-channel-2
    # default org_id: 1
Supported Settings
The following sections detail the supported settings and secure settings for each alert notification type. Secure settings are stored encrypted in the database and you add them to secure_settings in the YAML file instead of settings.
Note: Secure settings is supported since Grafana v7.2.
Alert notification pushover
Alert notification discord
Alert notification slack
Alert notification victorops
Alert notification kafka
Alert notification LINE
Alert notification pagerduty
Alert notification sensu
Alert notification sensugo
Alert notification prometheus-alertmanager
Alert notification teams
Alert notification dingding
Alert notification email
Alert notification hipchat
Alert notification opsgenie
Alert notification telegram
Alert notification threema
Alert notification webhook
Alert notification googlechat
Grafana Enterprise
Grafana Enterprise supports provisioning for the following resources:


