Important: This documentation is about an older version. It's relevant only to the release noted, many of the features and functions have been updated or replaced. Please view the current version.
Plugin management
Besides the wide range of visualizations and data sources that are available immediately after you install Grafana, you can extend your Grafana experience with plugins.
You can install one of the plugins built by the Grafana community, or build one yourself.
Grafana supports three types of plugins: panels, data sources, and apps.
Panel plugins
Add new visualizations to your dashboard with panel plugins, such as the Worldmap Panel, Clock, and Pie Chart.
Use panel plugins when you want to:
- Visualize data returned by data source queries.
- Navigate between dashboards.
- Control external systems, such as smart home devices.
Data source plugins
Data source plugins add support for new databases, such as Google BigQuery.
Data source plugins communicate with external sources of data and return the data in a format that Grafana understands. By adding a data source plugin, you can immediately use the data in any of your existing dashboards.
Use data source plugins when you want to import data from external systems.
App plugins
Applications, or app plugins, bundle data sources and panels to provide a cohesive experience, such as the Zabbix app.
Apps can also add custom pages for things like control panels.
Use app plugins when you want to create an custom out-of-the-box monitoring experience.
Managing app plugins access
With RBAC, it is now possible to customize access to app plugins.
By default, Viewers, Editors and Admins have access to all App Plugins that their organization role allows them to access, thanks to the fixed:plugins.app:reader role.
Note: Revoking this RBAC role from some users, will prevent them from accessing app plugins. But granting this RBAC role to users will only allow them to see app plugins their organization role allows them to see.
To prevent users from seeing an app plugin, refer to this permissions scenarios.
Plugin catalog
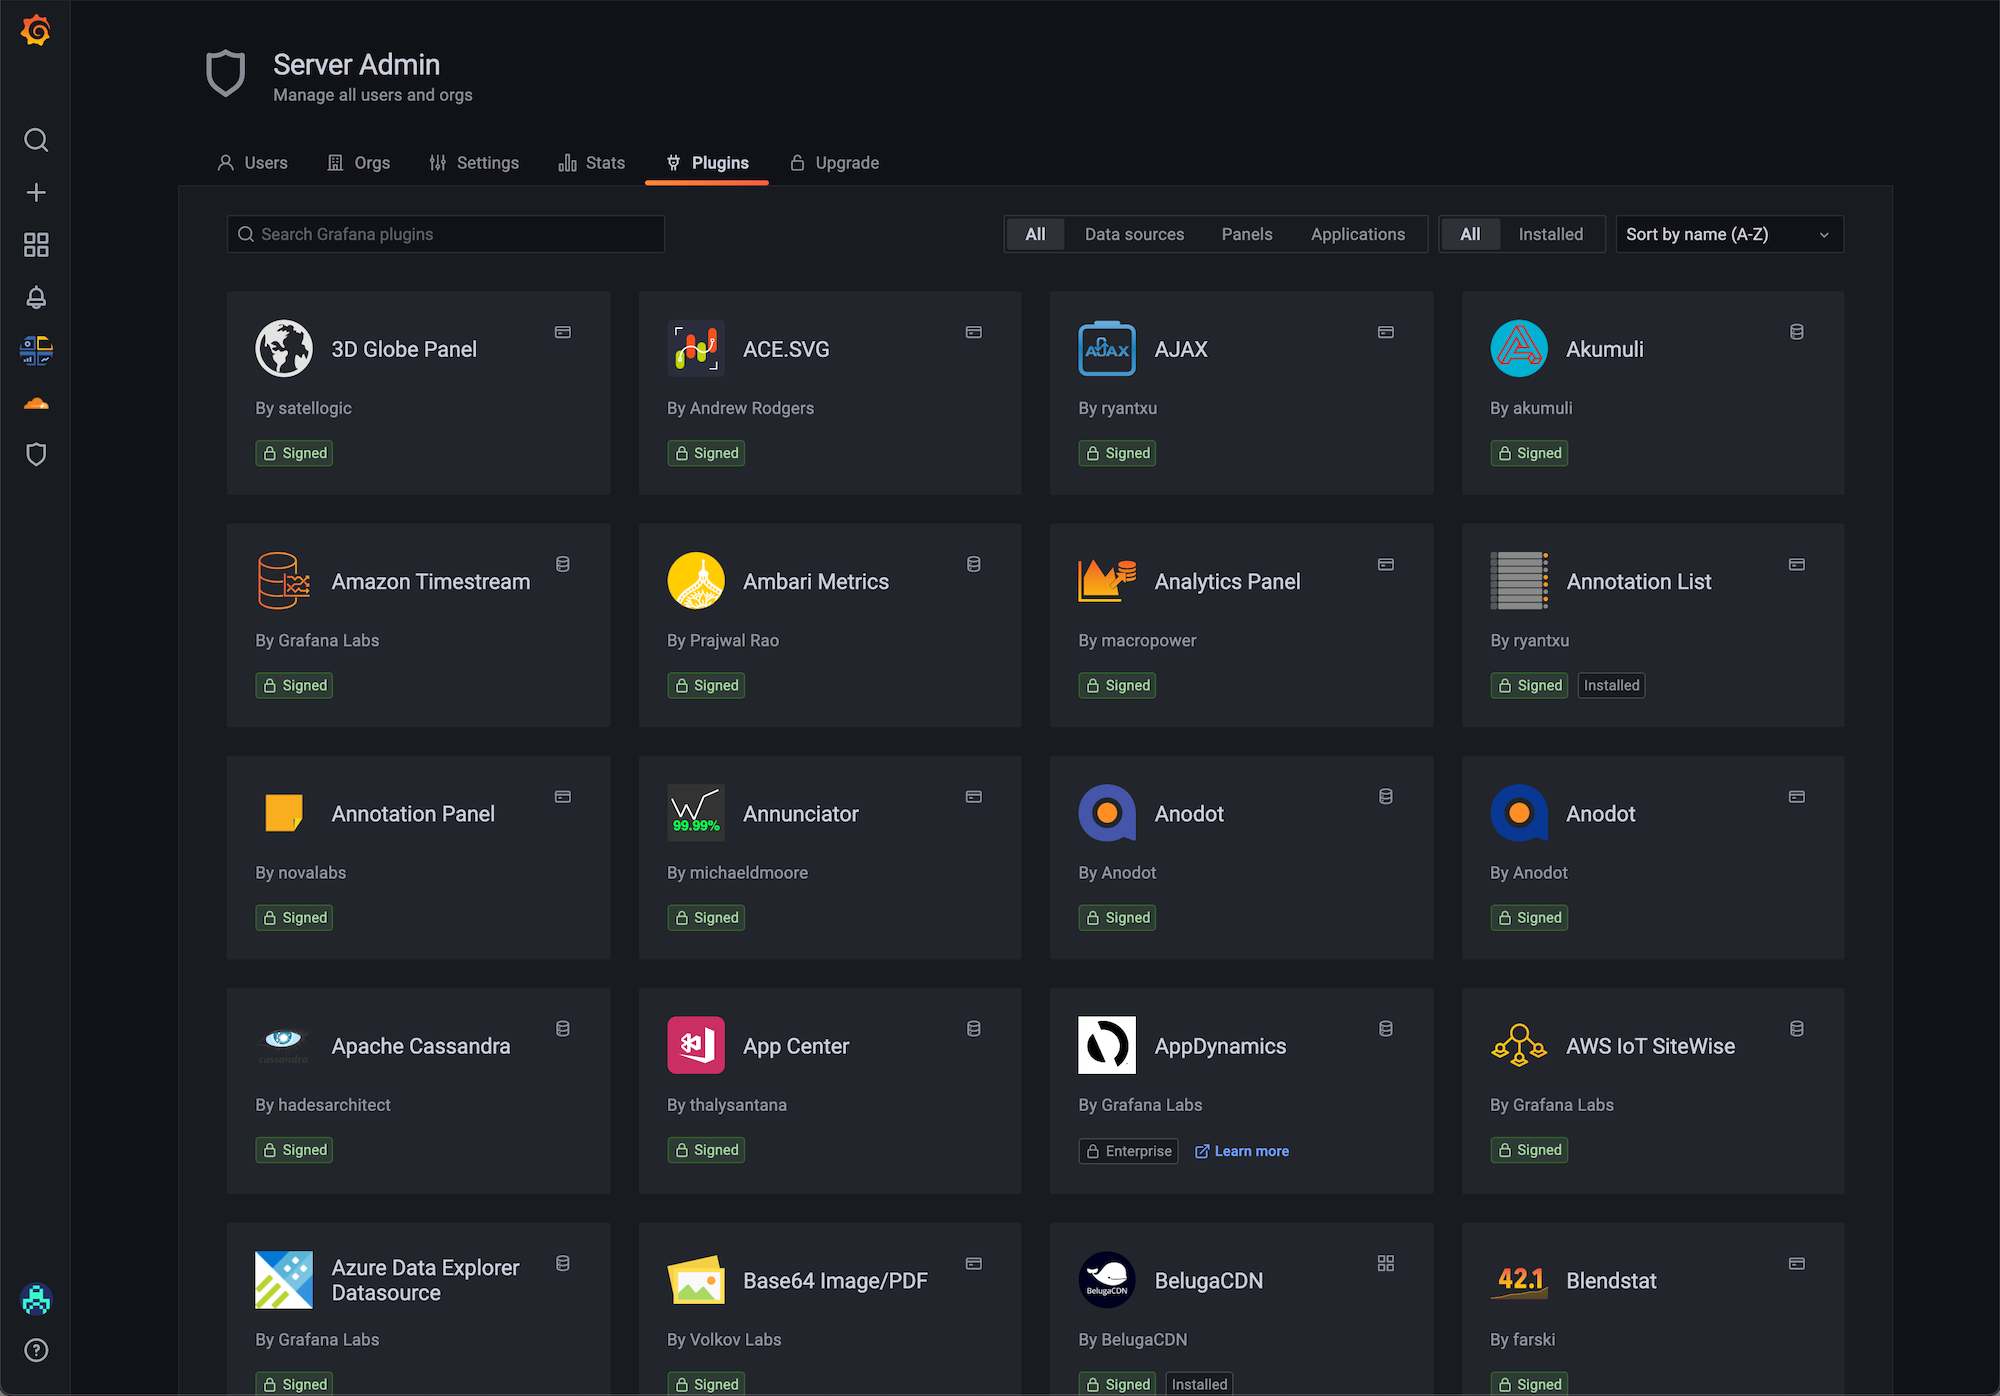
The Plugin catalog allows you to browse and manage plugins from within Grafana. Only Grafana server administrators and organization administrators can access and use the plugin catalog. The following access rules apply depending on the user role:
Note: The Plugin catalog is designed to work with a single Grafana server instance only. Support for Grafana clusters will be added in future Grafana releases.
In order to be able to install / uninstall / update plugins using plugin catalog, you must enable it via the plugin_admin_enabled flag in the configuration file.
Before following the steps below, make sure you are logged in as a Grafana administrator.
Currently, there are two entry points to the Plugin catalog.
- Grafana server administrators can find it at Server Admin > Plugins.
- Organization administrators can find it at Configuration > Plugins.
Browse plugins
To browse for available plugins:
- In Grafana, navigate to the Plugin catalog to view installed plugins.
- Click the All filter to browse all available plugins.
- Click the Data sources, Panels, or Applications buttons to filter by plugin type.

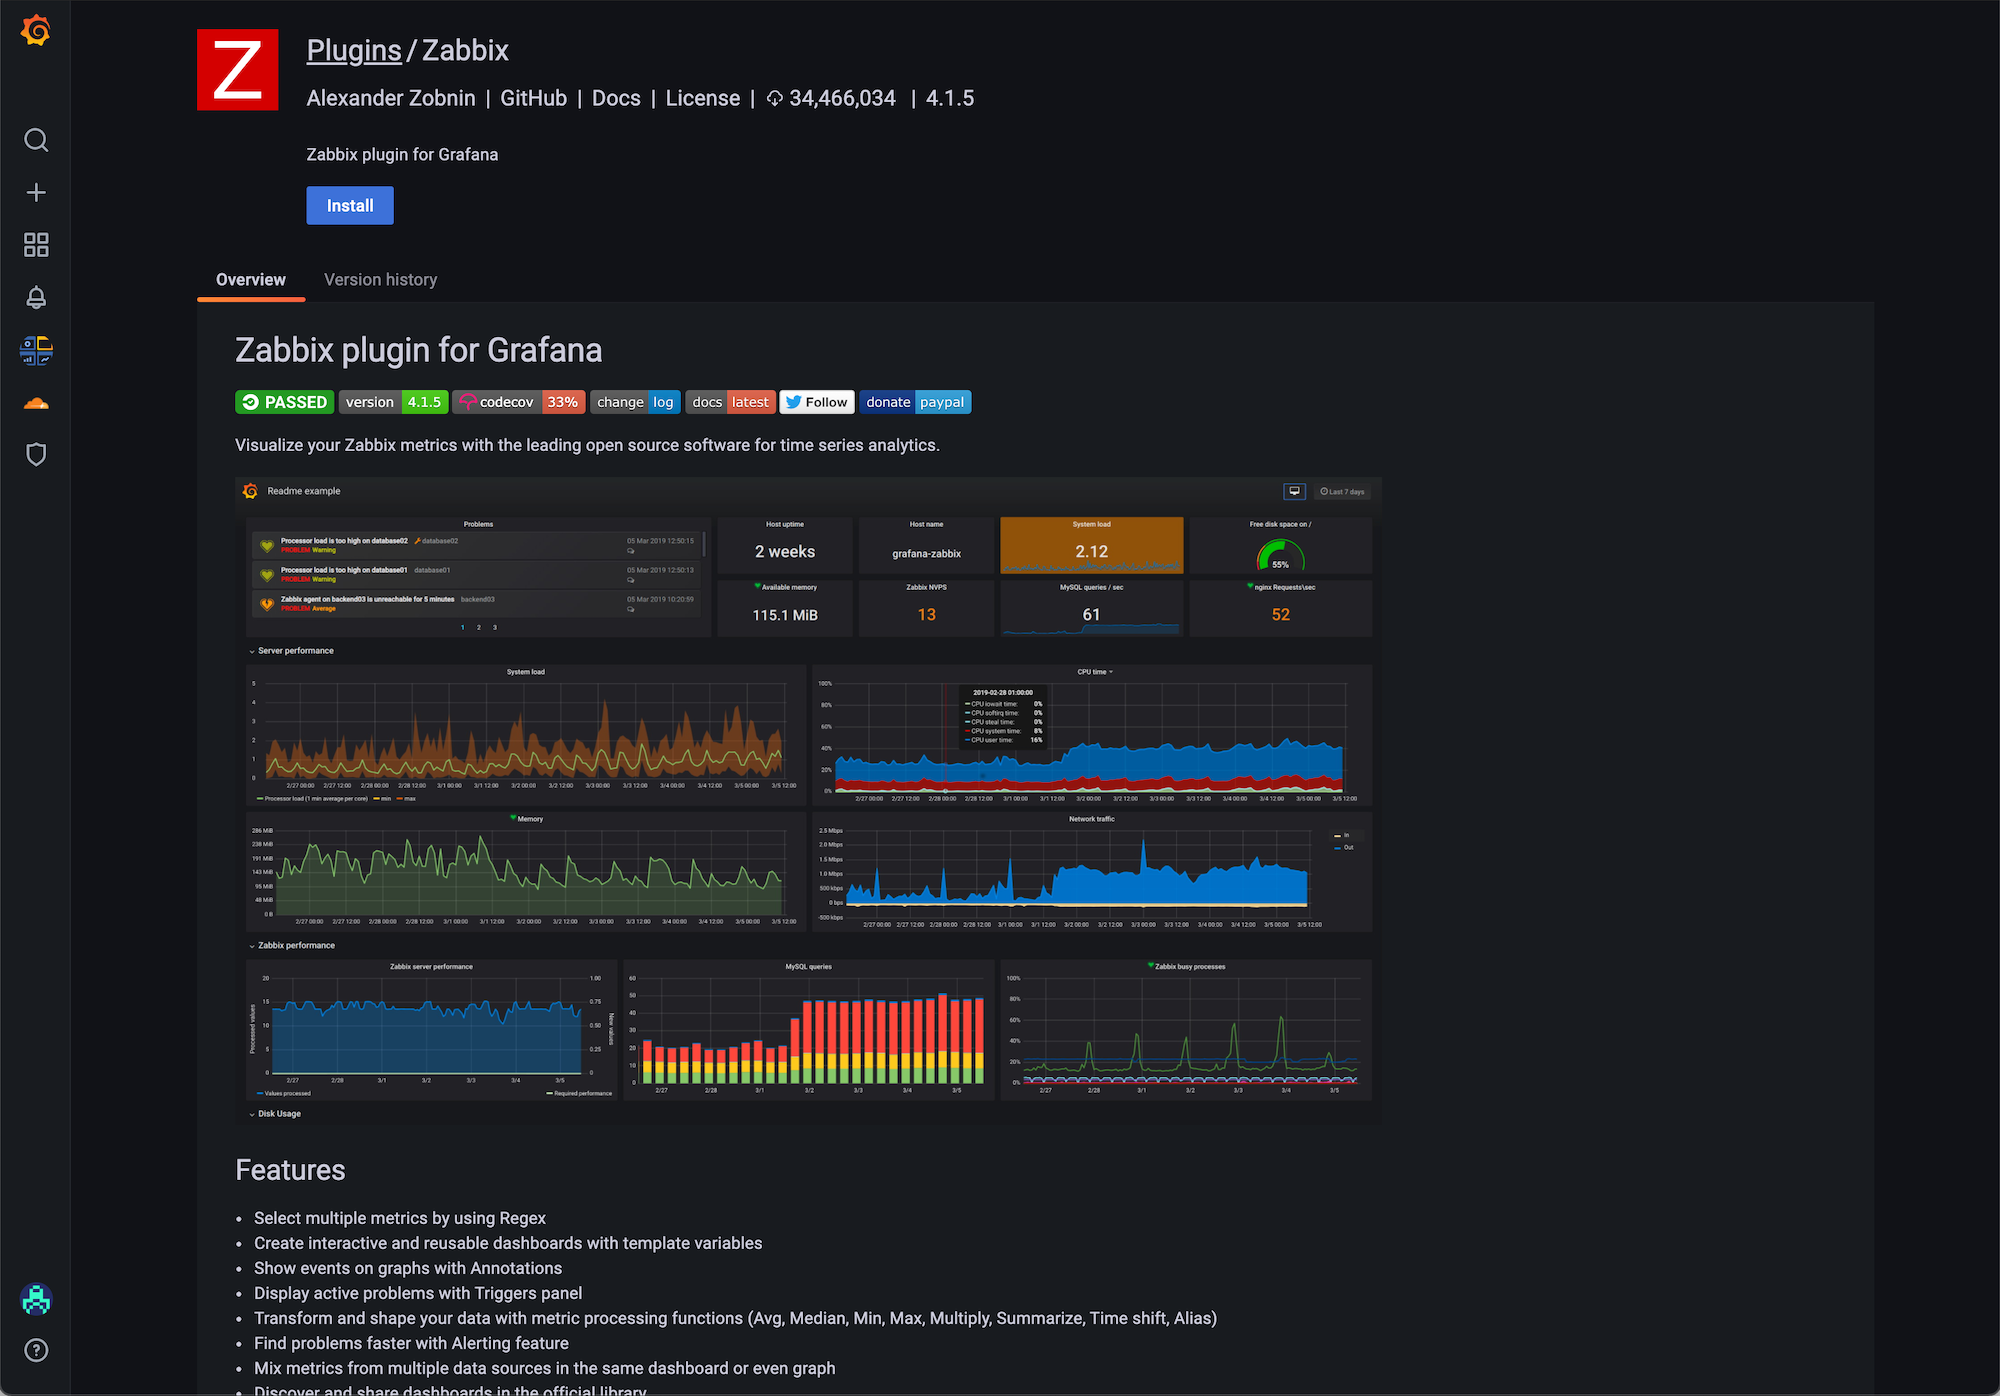
Install a plugin
To install a plugin:
- In Grafana, navigate to the Plugin catalog to view installed plugins.
- Browse and find a plugin.
- Click on the plugin logo.
- Click Install.
When the update is complete, you see a confirmation message that the installation was successful.

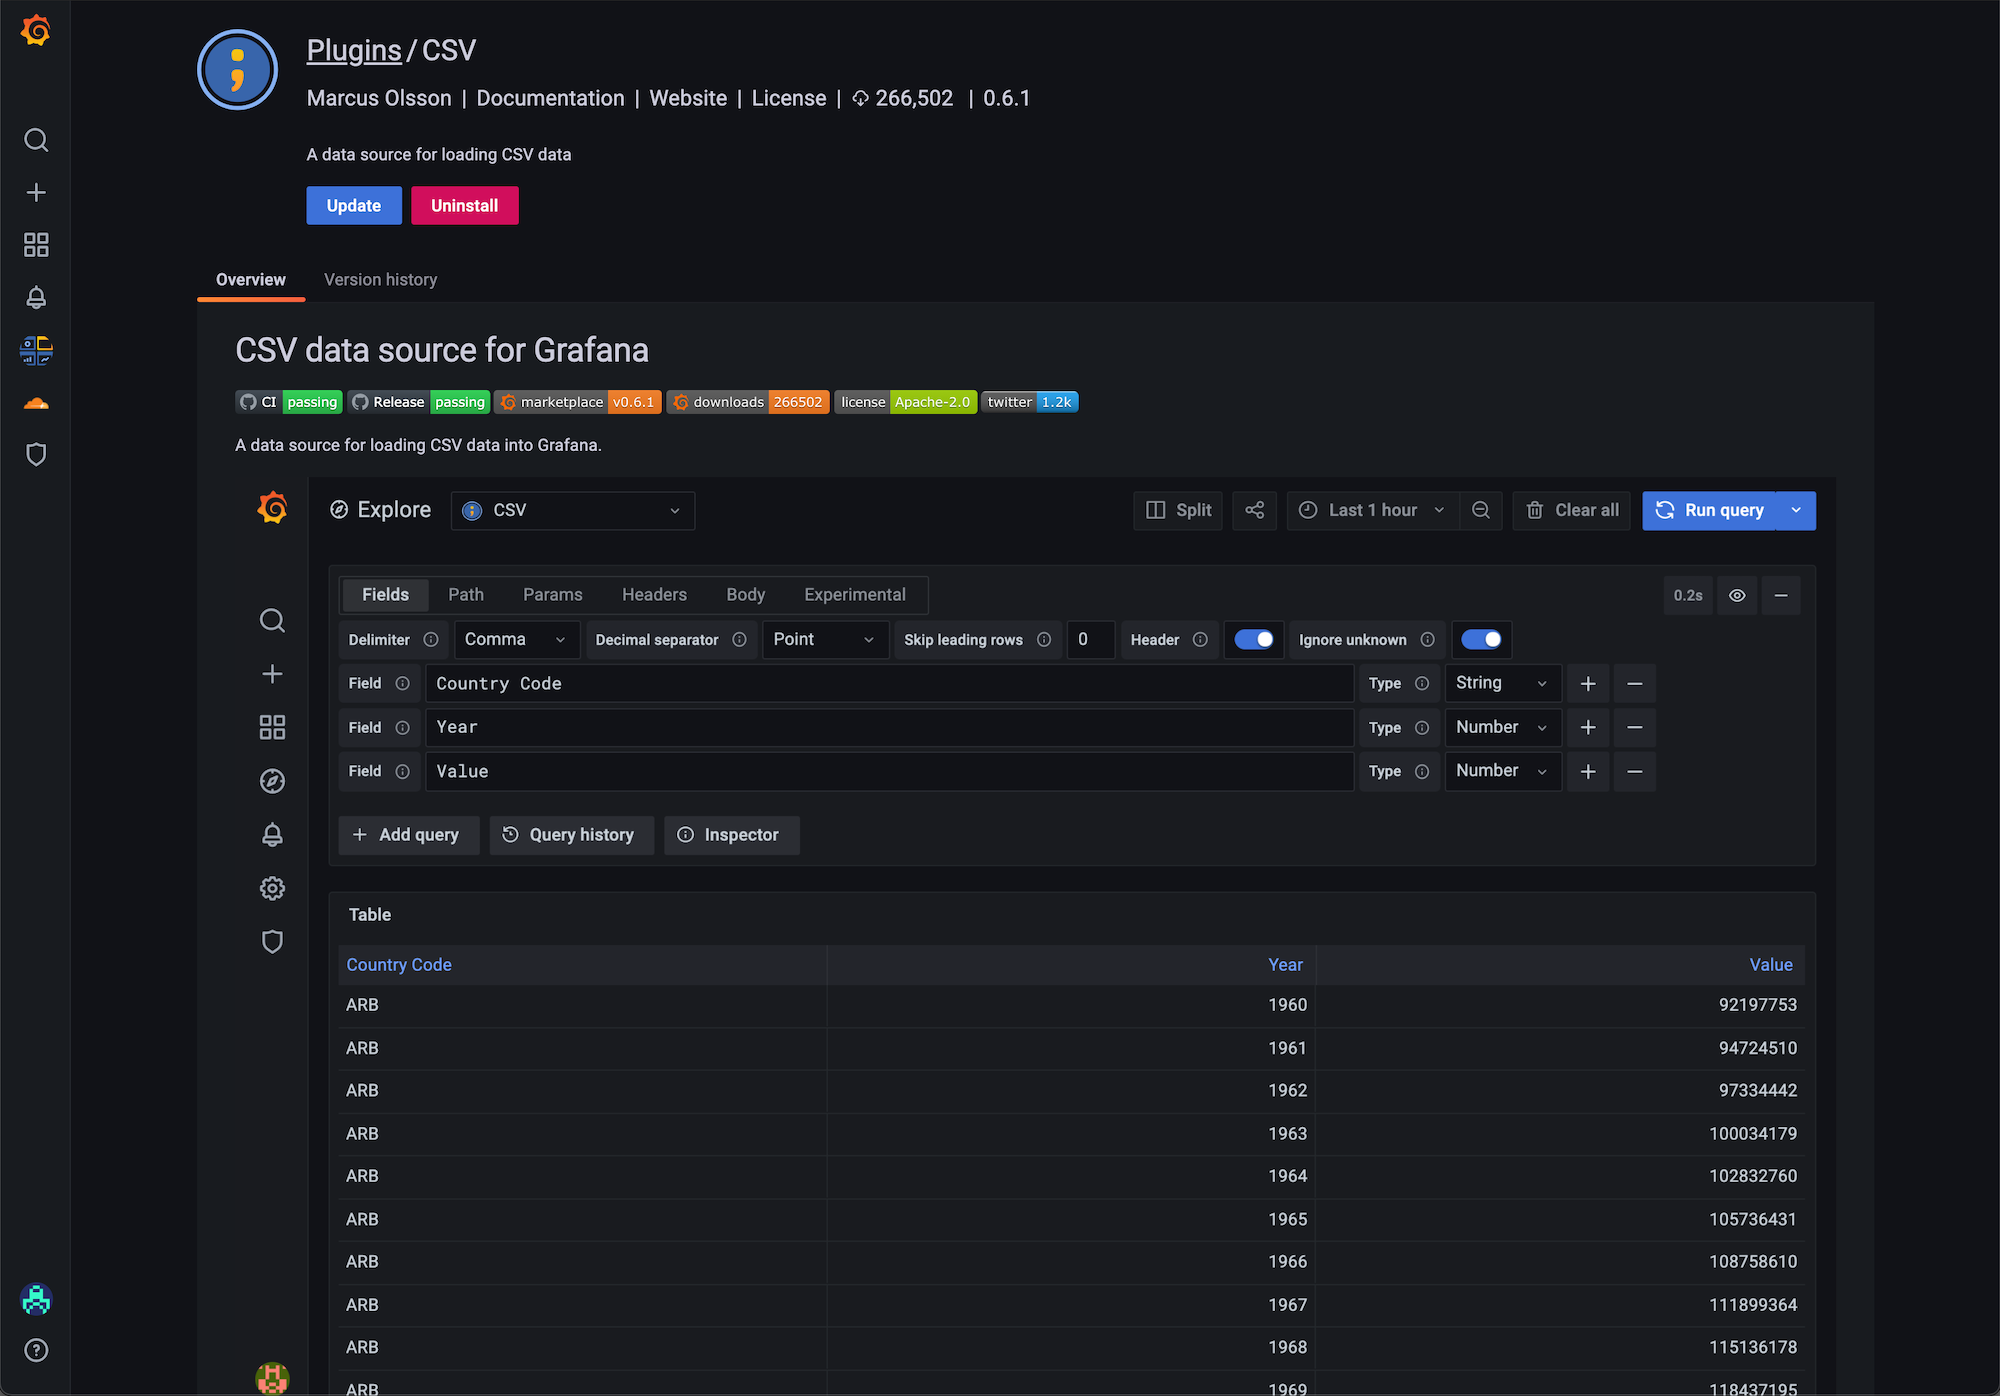
Update a plugin
To update a plugin:
- In Grafana, navigate to the Plugin catalog to view installed plugins.
- Click on the plugin logo.
- Click Update.
When the update is complete, you see a confirmation message that the update was successful.

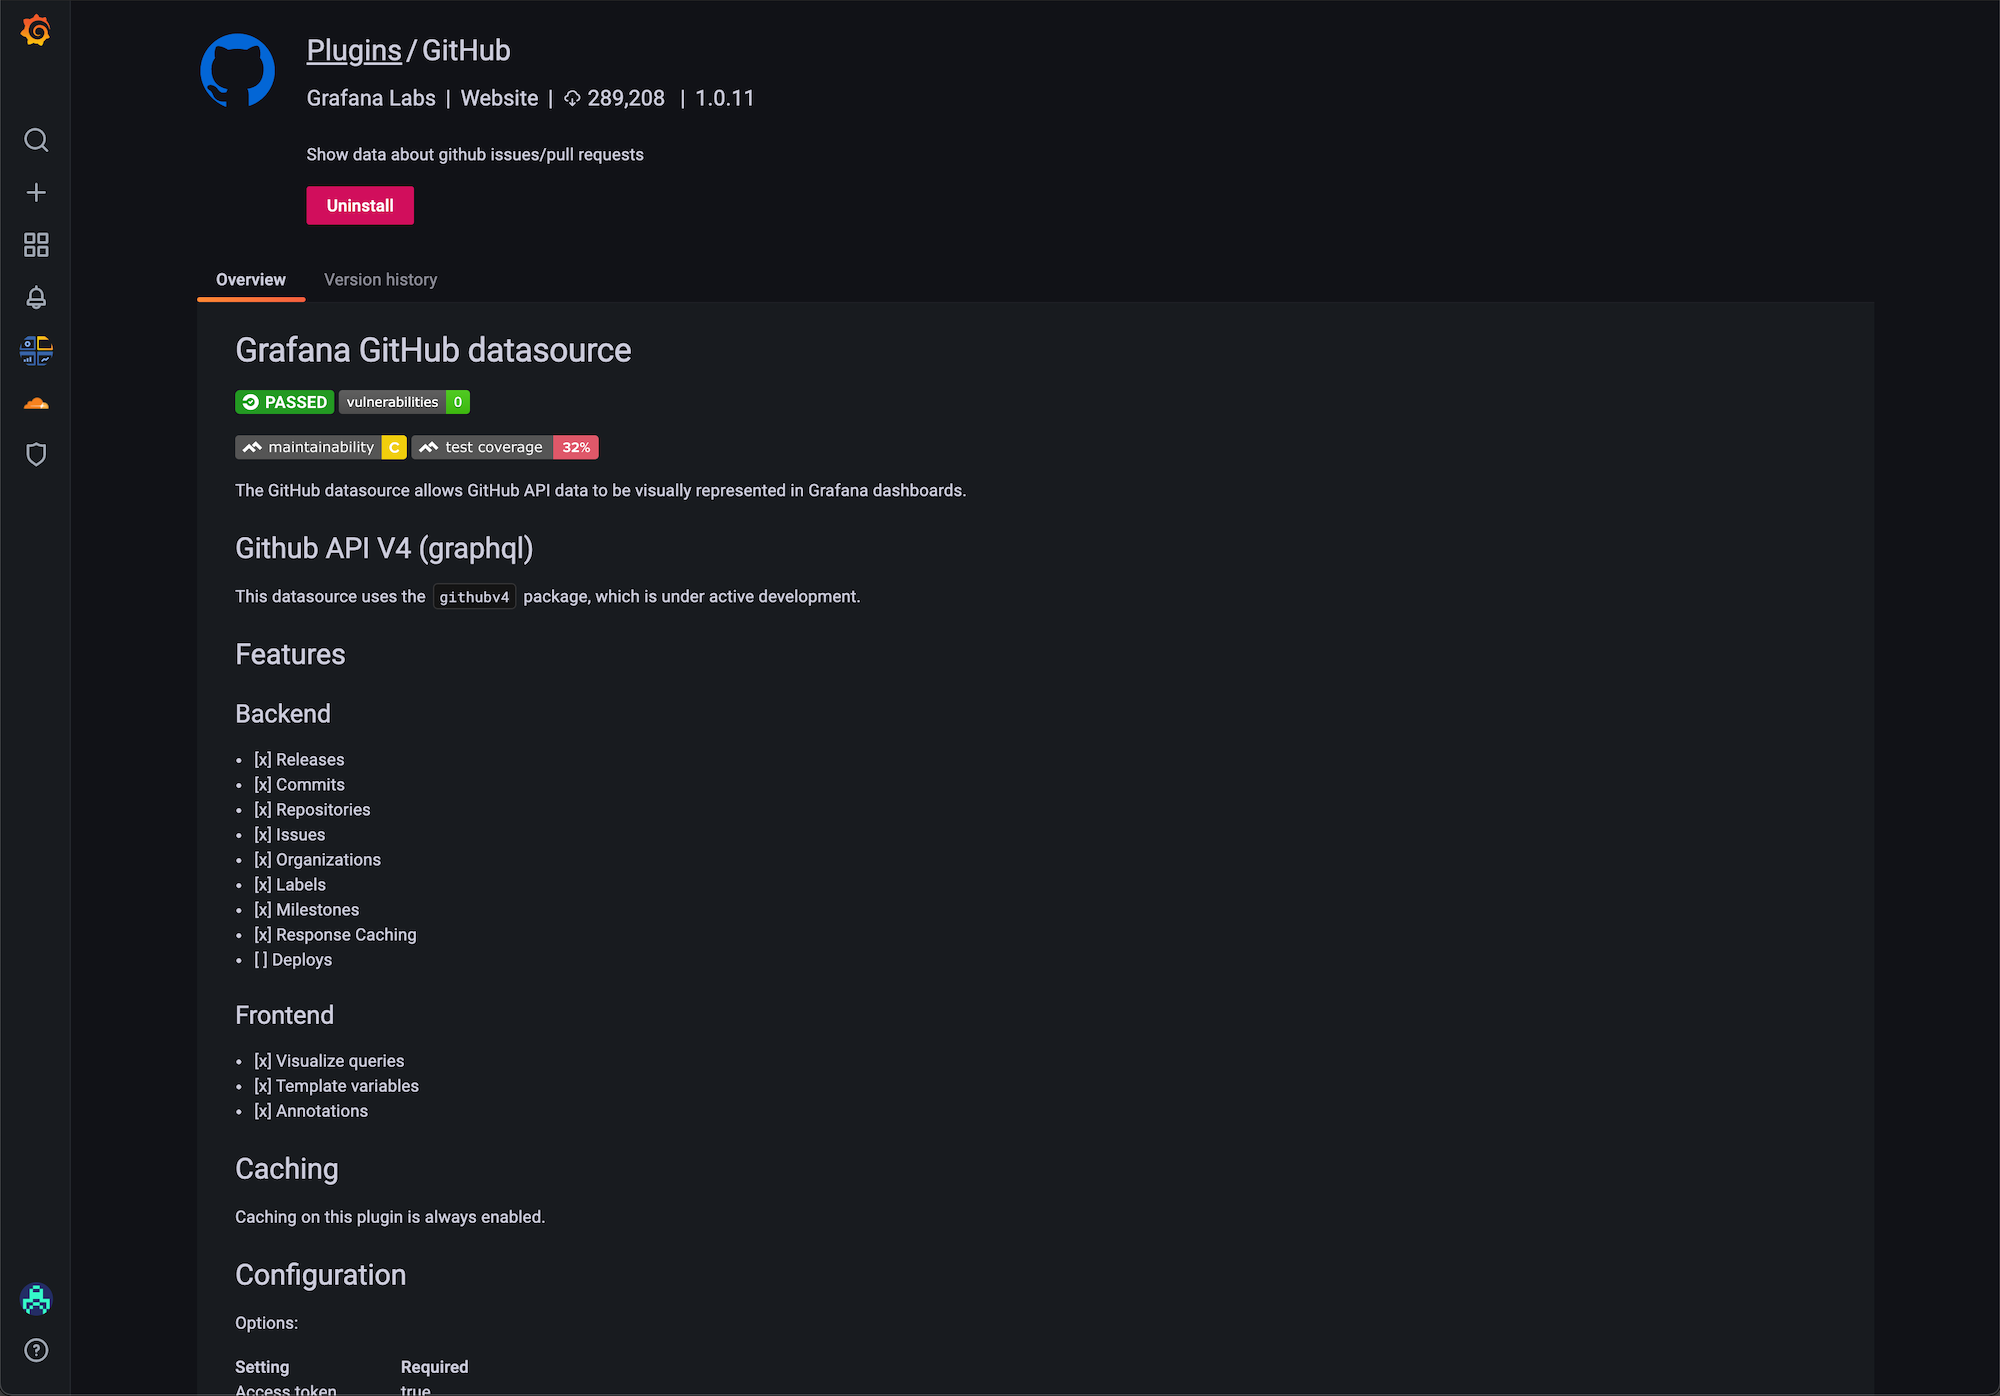
Uninstall a plugin
To uninstall a plugin:
- In Grafana, navigate to the Plugin catalog to view installed plugins.
- Click on the plugin logo.
- Click Uninstall.
When the update is complete, you see a confirmation message that the uninstall was successful.

Install Grafana plugins
Grafana supports data source, panel, and app plugins. Having panels as plugins makes it easy to create and add any kind of panel, to show your data, or improve your favorite dashboards. Apps enable the bundling of data sources, panels, dashboards, and Grafana pages into a cohesive experience.
- In a web browser, navigate to the official Grafana Plugins page and find a plugin that you want to install.
- Click the plugin, and then click the Installation tab.
Install plugin on Grafana Cloud
On the Installation tab, in the For field, click the name of the Grafana instance that you want to install the plugin on.
Grafana Cloud handles the plugin installation automatically.
If you are logged in to Grafana Cloud when you add a plugin, log out and back in again to use the new plugin.
Install plugin on local Grafana
Follow the instructions on the Install tab. You can either install the plugin with a Grafana CLI command or by downloading and uncompress a .zip file into the Grafana plugins directory. We recommend using Grafana CLI in most instances. The .zip option is available if your Grafana server does not have access to the internet.
For more information about Grafana CLI plugin commands, refer to Plugin commands.
As of Grafana v8.0, a plugin catalog app was introduced in order to make managing plugins easier. For more information, refer to Plugin catalog.
Install a packaged plugin
After the user has downloaded the archive containing the plugin assets, they can install it by extracting the archive into their plugin directory.
unzip my-plugin-0.2.0.zip -d YOUR_PLUGIN_DIR/my-pluginThe path to the plugin directory is defined in the configuration file. For more information, refer to Configuration.
Plugin signatures
Plugin signature verification (signing) is a security measure to make sure plugins haven’t been tampered with. Upon loading, Grafana checks to see if a plugin is signed or unsigned when inspecting and verifying its digital signature.
At startup, Grafana verifies the signatures of every plugin in the plugin directory. If a plugin is unsigned, then Grafana does not load nor start it. To see the result of this verification for each plugin, navigate to Configuration -> Plugins.
Grafana also writes an error message to the server log:
WARN[05-26|12:00:00] Some plugin scanning errors were found errors="plugin '<plugin id>' is unsigned, plugin '<plugin id>' has an invalid signature"If you are a plugin developer and want to know how to sign your plugin, refer to Sign a plugin.
Plugin signature levels
All plugins is signed under a signature level. The signature level determines how the plugin can be distributed.
Allow unsigned plugins
Note: Unsigned plugins are not supported in Grafana Cloud.
We strongly recommend that you don’t run unsigned plugins in your Grafana instance. If you’re aware of the risks and you still want to load an unsigned plugin, refer to Configuration.
If you’ve allowed loading of an unsigned plugin, then Grafana writes a warning message to the server log:
WARN[06-01|16:45:59] Running an unsigned plugin pluginID=<plugin id>Note: If you’re developing a plugin, then you can enable development mode to allow all unsigned plugins.
Learn more
- Browse the available Plugins


