Important: This documentation is about an older version. It's relevant only to the release noted, many of the features and functions have been updated or replaced. Please view the current version.
Dashboard previews
Note: Looking for prebuilt Grafana dashboards? Check out our full library of dashboards and more →
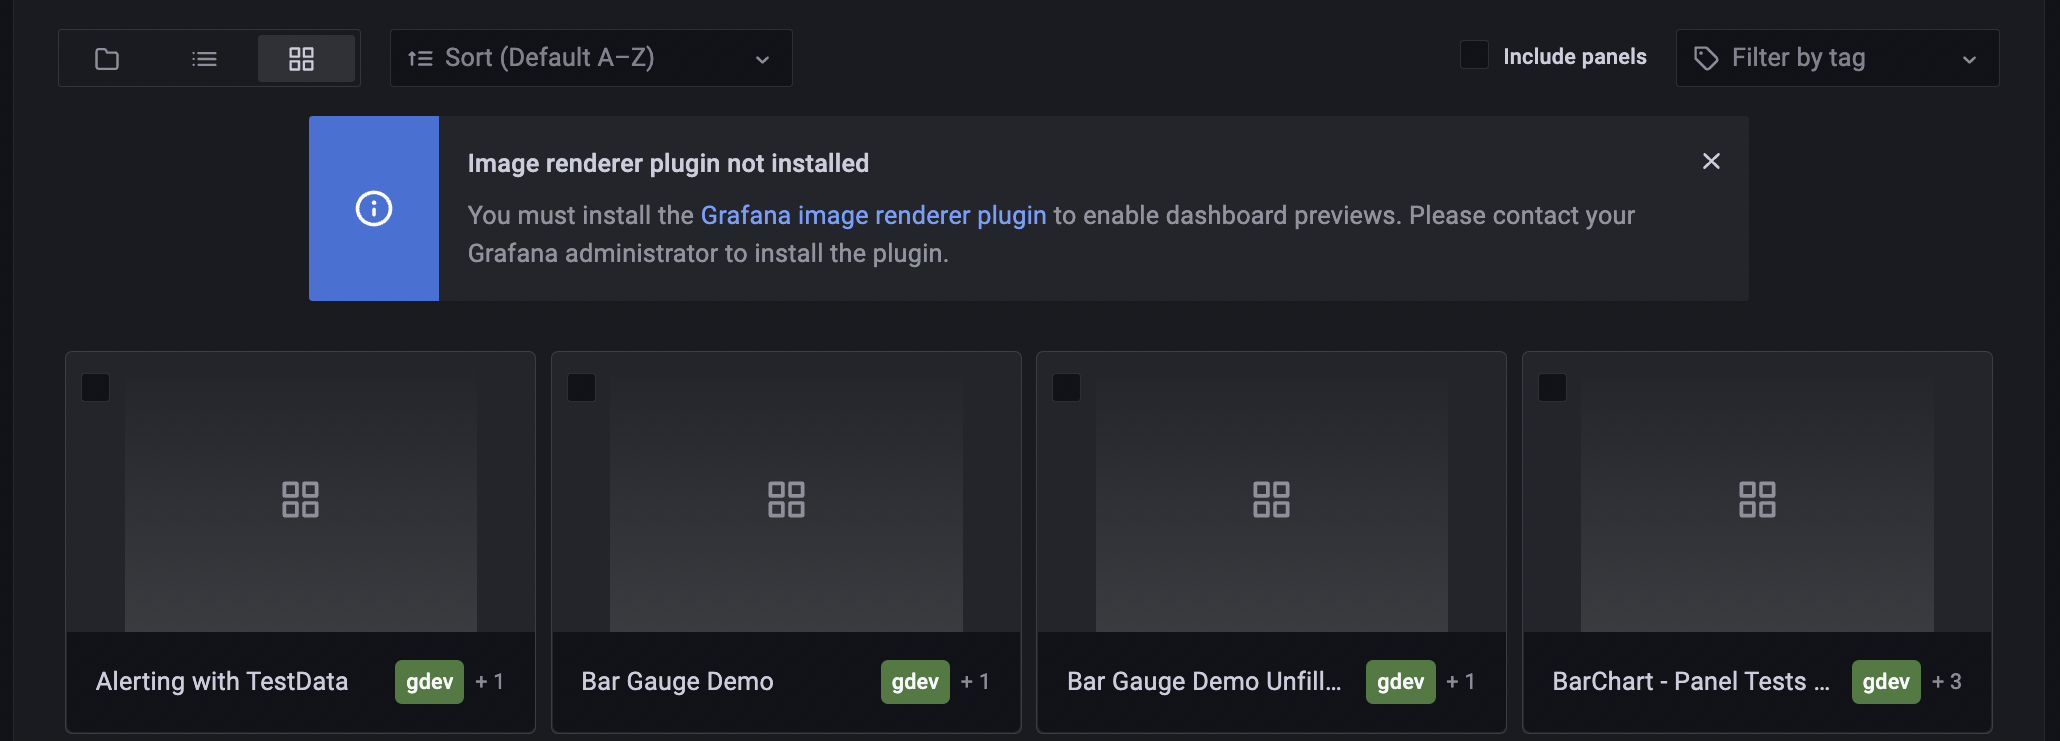
Dashboard previews provide an overview of all available dashboards. They help you quickly find the right dashboard when the dashboard names aren’t enough on their own.
Note: Dashboard previews are available in Grafana 9.0+ as an opt-in beta feature. Data source permissions are not yet taken into the account when displaying the dashboard previews - refer to the permissions to learn more before enabling the feature.
The dashboard previews feature is an opt-in feature that is disabled by default. You can view dashboard previews after an administrator enables the feature, and after you select the new grid layout. The feature-enablement procedure is outlined in the following section.
Enable dashboard previews
- Install the Image Renderer plugin or set up a remote rendering service. The minimum version of Image Renderer required for the dashboard preview feature
3.4.0. Refer to Image rendering for more information. - Modify the configuration file to enable the
dashboardPreviewsfeature toggle.
[feature_toggles]
# enable features, separated by spaces
enable = dashboardPreviews
If running Grafana Enterprise with RBAC, enable service accounts.
Save your changes. Grafana should reload automatically; we recommend restarting the Grafana server in case of any issues.
The first crawler run should begin approximately five minutes after Grafana server restart.
To determine that your setup is successful, select the new grid layout and verify that the dashboard preview placeholders appear.
If the dashboard preview placeholders do not appear or if you see any warning messages, check Grafana server logs for more context. The logger used by the Previews Service is named previews_service.

About the dashboard previews crawler
The dashboard previews crawler is a background process that:
- Prepares a list of dashboards to visit
- Visits and takes a screenshot of each dashboard
- Saves the screenshots in persistent storage
The crawler can be configured via the main config file. Check the dashboard previews section for more details.
Preparing the dashboard list
During the initial crawler run, the list contains all dashboards across all organizations. During subsequent runs, the list will have fewer elements. It will only contain dashboards that:
- are new
- have changed since taking their last preview
- haven’t changed, but the crawler failed to take their preview during the initial run
Modifying a dashboard is the only way of refreshing that dashboard’s preview; previews do not have a set timeout after which they expire.
Rendering previews
The crawler sends a render request to the Image Renderer for each dashboard in the list. The renderer is then instructed to open the dashboard in kiosk mode, take a screenshot, and scale it down to a small, 320 x 240px thumbnail. The following dashboard in Grafana Play is an example of kiosk mode: https://play.grafana.org/playlists/play/1?kiosk.
Multiple render requests are issued concurrently to improve performance. The maximum number of concurrent requests can be configured via the dashboard_previews.crawler.thread_count config option.
Use the new contextPerRenderKey clustering mode in Image Renderer to further optimize crawler’s resource usage.
Saving previews
The crawler saves previews and their metadata in Grafana’s DB. Preview’s metadata contains, among other things, the dashboard version from the time of taking the screenshot. During subsequent runs, the crawler uses the saved version to find stale dashboard previews.
Permissions
Crawler permissions
The crawler is set up with the required permissions to display all dashboards and query all data sources. The way the permissions are set up depends on the version of Grafana.
In OSS and Enterprise Grafana instances without RBAC enabled, the crawler uses a special user with an Admin role.
In an Enterprise Grafana instance with RBAC enabled, the crawler uses service accounts with three fixed roles:
fixed:dashboards:readerfixed:datasources:readerfixed:folders:reader

Service accounts are created per organization. They are visible in the service account configuration tab, and use the following naming convention: dashboard-previews-crawler-{organization_id}.
Preview visibility
Currently, users can see the previews of all dashboards they have access to. Data source permissions are not yet taken into account - users can see previews of dashboards with data sources they can’t see or query.
Data source permission check work is still ongoing - we will add it before moving the feature out of beta and announcing general availability.


