Important: This documentation is about an older version. It's relevant only to the release noted, many of the features and functions have been updated or replaced. Please view the current version.
What’s new in Grafana v7.4
This topic includes the release notes for Grafana v7.4. For all details, read the full CHANGELOG.md.
Check out the New Features in 7.4 dashboard on Grafana Play!
Grafana OSS features
These features are included in the Grafana open source edition.
Time series panel visualization (Beta)
Grafana 7.4 adds a beta version of the next-gen graph visualization. The new graph panel, the Time series visualization, is high-performance visualization based on the uPlot library. This new graph visualization uses the new panel architecture introduced in Grafana 7.0 and integrates with field options, overrides, and transformations.
The Time series beta panel implements the majority of the functionalities available in the current Graph panel. Our plan is to have close to full coverage of the features in Grafana 8.0, coming later this year.
Apart from major performance improvements, the new Time series panel implements new features like line interpolation modes, support for more than two Y-axes, soft min and max axis limits, automatic points display based on data density, and gradient fill modes.

The following documentation topics were added for this feature:
- Time series panel
- Graph time series as lines
- Graph time series as bars
- Graph time series as points
- Change axis display
Node graph panel visualization (Beta)
Node graph is a new panel type that can visualize directed graphs or network in dashboards, but also in Explore. It uses directed force layout to effectively position the nodes so it can help with displaying complex infrastructure maps, hierarchies, or execution diagrams.
All the information and stats shown in the Node graph beta are driven by the data provided in the response from the data source. The first data source that is using this panel is AWS X-Ray, for displaying their service map data.
For more details about how to use the X-Ray service map feature, see the X-Ray plugin documentation.
For more information, refer to Node graph panel.
New transformations
The following transformations were added in Grafana 7.4.
Sort by transformation
The Sort by transformation allows you to sort data before sending it to the visualization.
For more information, refer to Sort by in Transformation types and options.
Filter data by value transform
The new Filter data by value transformation allows you to filter your data directly in Grafana and remove some data points from your query result.
This transformation is very useful if your data source does not natively filter by values. You might also use this to narrow values to display if you are using a shared query.
For more information, refer to Filter data by value in Transformation types and options.
New override option
On the Overrides tab, you can now set properties for fields returned by a specific query.
For more information, refer to Field overrides.
Exemplar support
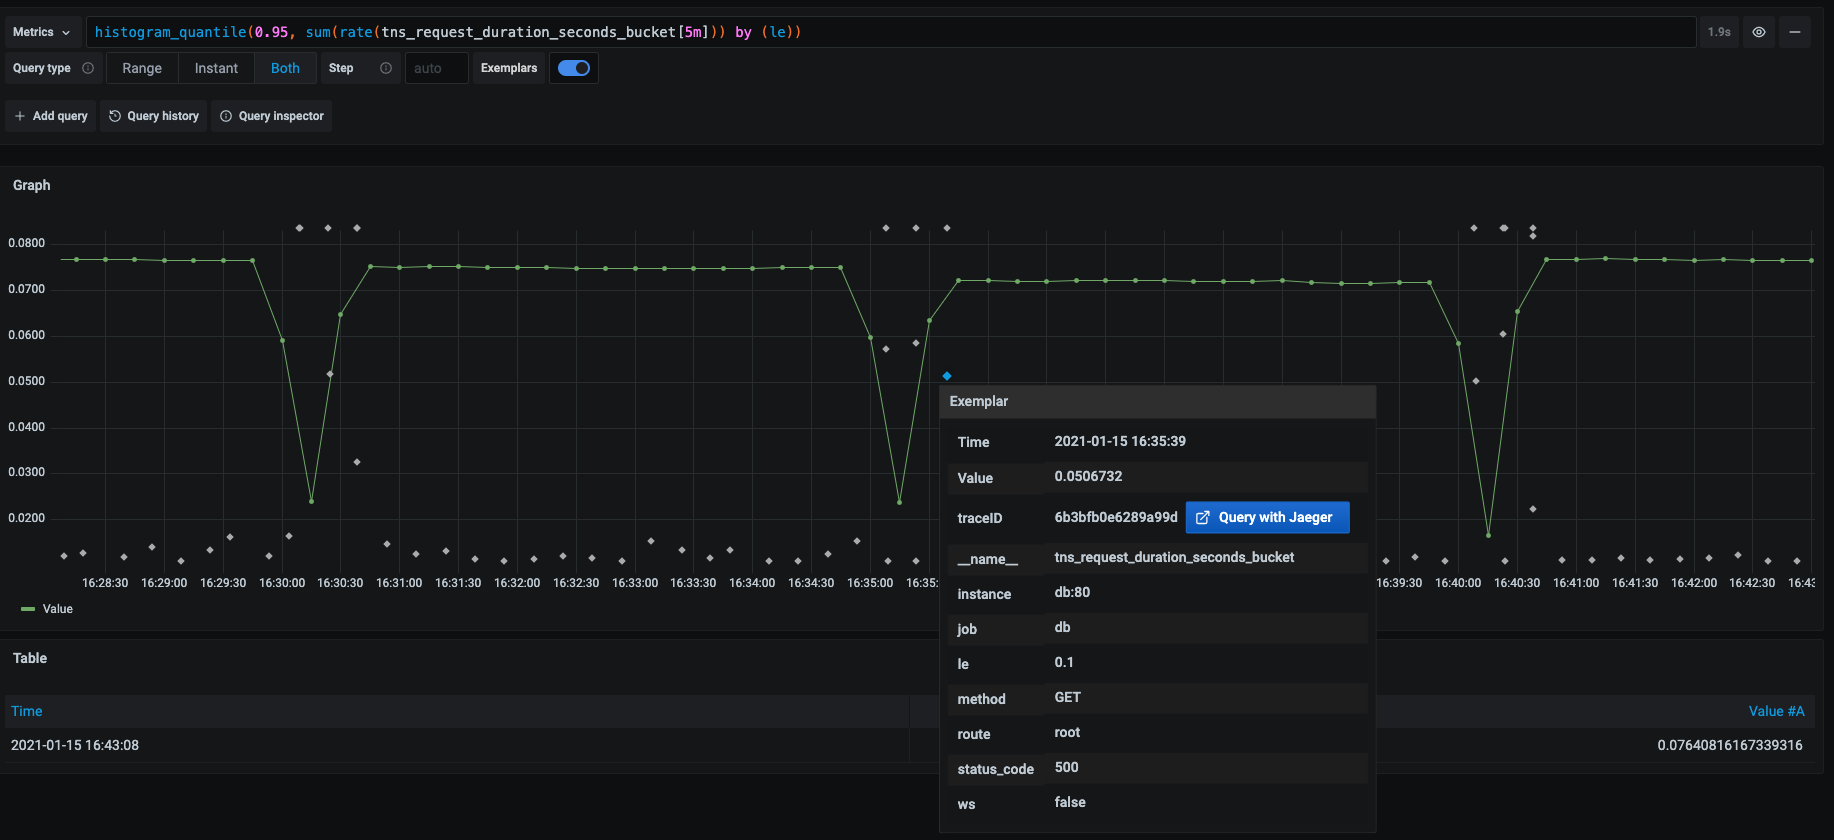
Grafana graphs now support Prometheus exemplars. They are displayed as diamonds in the graph visualization.
Note: Support for exemplars will be added in version Prometheus 2.25+.

For more information, refer to Exemplars.
Trace to logs
You can now navigate from a span in a trace view directly to logs relevant for that span. This feature is available for the Tempo, Jaeger, and Zipkin data sources.
The following topics were updated as a result of this feature:
Server-side expressions
Server-side expressions is an experimental feature that allows you to manipulate data returned from backend data source queries. Expressions allow you to manipulate data with math and other operations when the data source is a backend data source or a –Mixed– data source.
The main use case is for multi-dimensional data sources used with the upcoming next generation alerting, but expressions can be used with backend data sources and visualization as well.
Note: Queries built with this feature might break with minor version upgrades until Grafana 8 is released. This feature does not work with the current Grafana alerting.
For more information, refer to Expressions. Queries was also updated as a result of this feature.
Alert notification query label interpolation
You can now provide detailed information to alert notification recipients by injecting alert label data as template variables into an alert notification. Labels that exist from the evaluation of the alert query can be used in the alert rule name and in the alert notification message fields using the ${Label} syntax. The alert label data is automatically injected into the notification fields when the alert is in the alerting state. When there are multiple unique values for the same label, the values are comma-separated.

For more information, refer to the alert notification docs.
Content security policy support
We have added support for Content Security Policy (CSP), a layer of security that helps detect and mitigate certain types of attacks, including Cross Site Scripting (XSS) and data injection attacks.
CSP support is disabled by default, to enable it you must set content_security_policy = true in the Grafana configuration. If enabling it, you should also review, and potentially tweak, the CSP header template, via the configuration setting content_security_policy_template.
You can lock down what can be done in the frontend code. Lock down what can be loaded, what JavaScript is executed. Not compatible with some plugins.
content_security_policy and content_security_policy_template were added to Configuration as a result of this change.
Hide users in UI
You can now use the hidden_users configuration setting to hide specific users in the UI. For example, this feature can be used to hide users that are used for automation purposes.
Configuration has been updated for this feature.
Elasticsearch data source updates
Grafana 7.4 includes the following enhancements
- Added support for serial differencing pipeline aggregation.
- Added support for moving function pipeline aggregation.
- Added support to the terms aggregation for ordering by percentiles and extended stats.
- Updated date histogram auto interval handling for alert queries.
Note: We have deprecated browser access mode. It will be removed in a future release.
For more information, refer to the Elasticsearch docs.
Azure Monitor updates
The Azure Monitor query type was renamed to Metrics and Azure Logs Analytics was renamed to Logs to match the service names in Azure and align the concepts with the rest of Grafana.
Azure Monitor was updated to reflect this change.
MQL support added for Google Cloud Monitoring
You can now use Monitoring Query Language (MQL) for querying time-series data. MQL provides an expressive, text-based interface to retrieve, filter, and manipulate time-series data.
Unlike the visual query builder, MQL allows you to control the time range and period of output data, create new labels to aggregate data, compute the ratio of current values to past values, and so on.
MQL uses a set of operations and functions. Operations are linked together using the common pipe mechanism, where the output of one operation becomes the input to the next. Linking operations makes it possible to build up complex queries incrementally.
Once query type Metrics is selected in the Cloud Monitoring query editor, you can toggle between the editor modes for visual query builder and MQL. For more information, refer to the Google Cloud Monitoring docs.
Many thanks to mtanda this contribution!
Curated dashboards for Google Cloud Monitoring
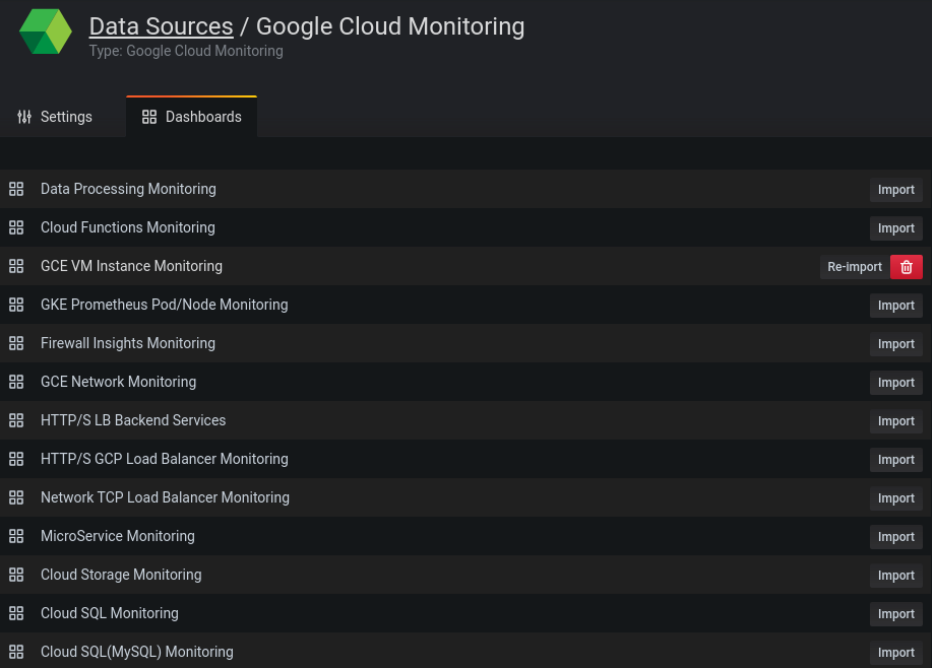
Google Cloud Monitoring data source ships with pre-configured dashboards for some of the most popular GCP services. These curated dashboards are based on similar dashboards in the GCP dashboard samples repository. In this release, we have expanded the set of pre-configured dashboards.

If you want to customize a dashboard, we recommend that you save it under a different name. Otherwise the dashboard will be overwritten when a new version of the dashboard is released.
For more information, refer to the Google Cloud Monitoring docs.
Query Editor Help
The feature previously referred to as DataSource Start Pages or Cheat Sheets has been renamed to Query Editor Help, and is now supported in panel query editors (depending on the data source), as well as in Explore.
Queries was updated as a result of this feature.
For more information on adding a query editor help component to your plugin, refer to Add a query editor help component.
Variable inspector
The variables list has an additional column indicating whether variables are referenced in queries and panel names or not. The dependencies graph provides an easy way to check variable dependencies. You can click on a variable name within the graph to make updates to the variable as needed.
For more information, refer to Inspect variables and their dependencies.
Grafana Enterprise features
These features are included in the Grafana Enterprise edition.
Licensing changes
When determining a user’s role for billing purposes, a user who has the ability to edit and save dashboards is considered an Editor. This includes any user who is an Editor or Admin at the Org level, and who has granted Admin or Edit permissions via Dashboard and folder permissions.
After the number of Viewers or Editors has reached its license limit, only Admins will see a banner in Grafana indicating that the license limit has been reached. Previously, all users saw the banner.
Grafana Enterprise license tokens update automatically on a daily basis, which means you no longer need to manually update your license, and the process for adding additional users to a license is smoother than it was before.
Refer to Licensing restrictions for more information.
Export usage insights to Loki
You can now export usage insights logs to Loki and query them from Grafana. Usage insights logs include dashboard visits, data source views, queries and errors, and more.
For more information, refer to Export logs of usage insights.
New audit log events
New log out events are logged based on when a token expires or is revoked, as well as SAML Single Logout. A tokenId field was added to all audit logs to help understand which session was logged out of.
Also, a counter for audit log writing actions with status (success / failure) and logger (loki / file / console) labels was added.
Auditing was updated to reflect these changes.
Reports support Unicode
You can now select a font, other than the default, for Unicode-based scripts. As a result, an automatically generated PDF of a dashboard, which contains for example Chinese or Cyrillic text, can display them. Because the size of a report increases as additional fonts are added, this feature is not on by default.
Reporting was updated as a result of this change.
Request security
Request security introduces ways to limit requests from the Grafana server, and it targets requests that are generated by users.
For more information, refer to Request security.
Breaking changes
The following Grafana 7.4 changes might break previous functionality.
Plugin compatibility
We have upgraded AngularJS from version 1.6.6 to 1.8.2. Due to this upgrade some old angular plugins might stop working and will require a small update. This is due to the deprecation and removal of pre-assigned bindings. So if your custom angular controllers expect component bindings in the controller constructor you need to move this code to an $onInit function. For more details on how to migrate AngularJS code open the migration guide and search for pre-assigning bindings.
In order not to break all angular panel plugins and data sources we have some custom angular inject behavior that makes sure that bindings for these controllers are still set before constructor is called so many old angular panels and data source plugins will still work.
Fixes Constant variable persistence confusion
In order to minimize the confusion with Constant variable usage, we’ve removed the ability to make Constant variables visible. This change will also migrate all existing visible Constant variables to Textbox variables because which we think this is a more appropriate type of variable for this use case.
Upgrading
See upgrade notes.
Changelog
Check out CHANGELOG.md for a complete list of new features, changes, and bug fixes.


