Important: This documentation is about an older version. It's relevant only to the release noted, many of the features and functions have been updated or replaced. Please view the current version.
What’s new in Grafana v7.3
This topic includes the release notes for Grafana v7.3. For all details, read the full CHANGELOG.md or the Patch release notes.
The main highlights are:
- Google Cloud Monitoring: Out of the box dashboards
- Shorten URL for dashboards and Explore
- Table improvements and new image cell mode
- New color scheme option
- SigV4 Authentication for Amazon Elasticsearch Service
- CSV exports for Excel
Table improvements and new image cell mode
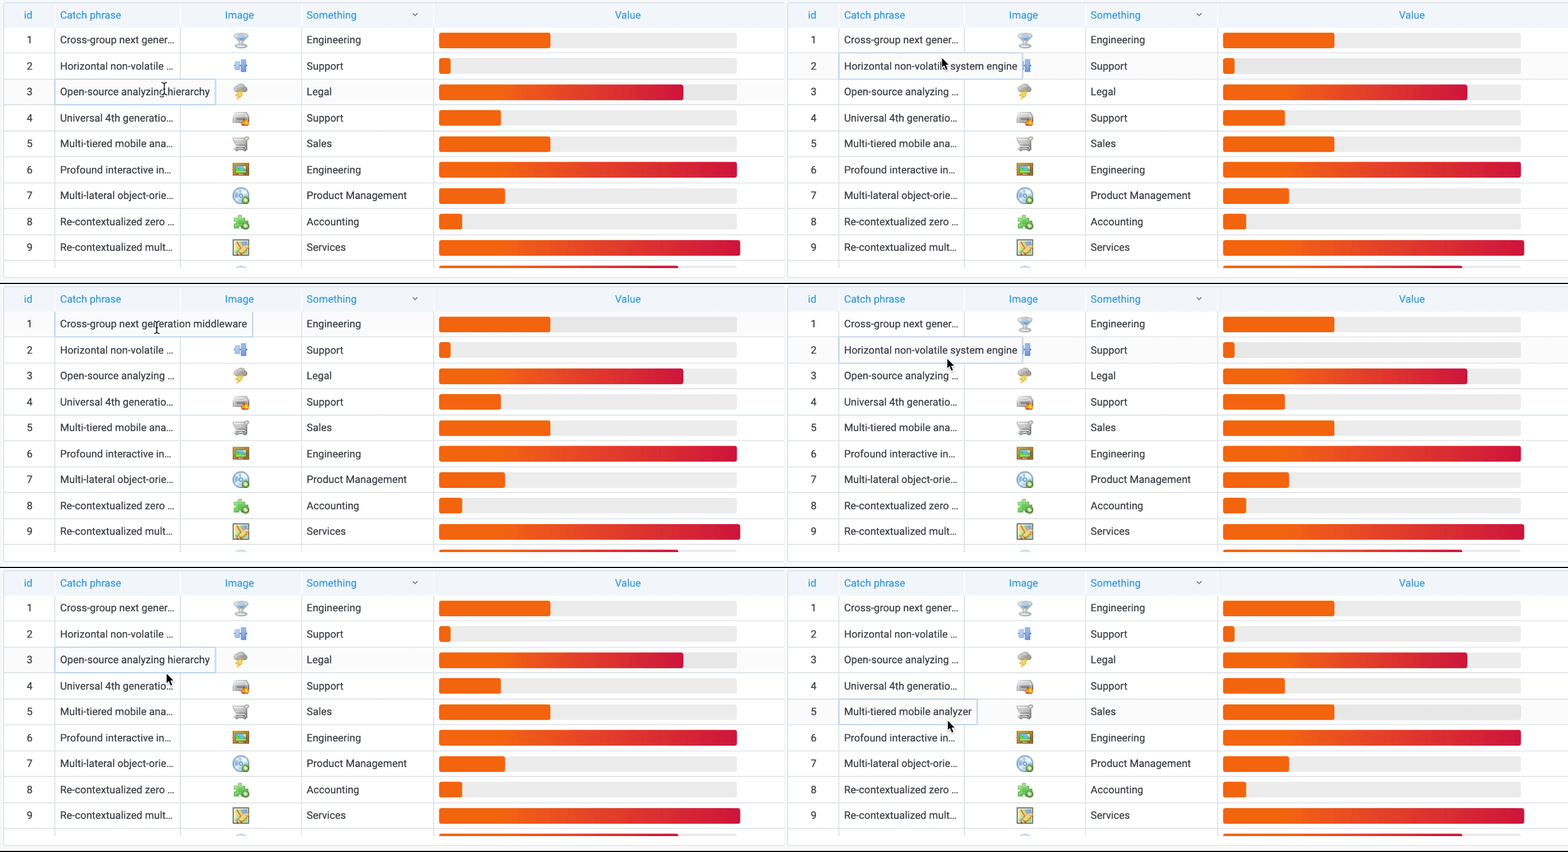
The table has been updated with improved hover behavior for cells that have longer content than what fits the current column width. As you can see in the animated gif below the cell will automatically expand to show you full content of the cell.

Another new feature that can be seen in the image above is the new image cell display mode. If you have a field value that is an image URL or a base64 encoded image you can configure the table to display it as an image.
New color scheme option

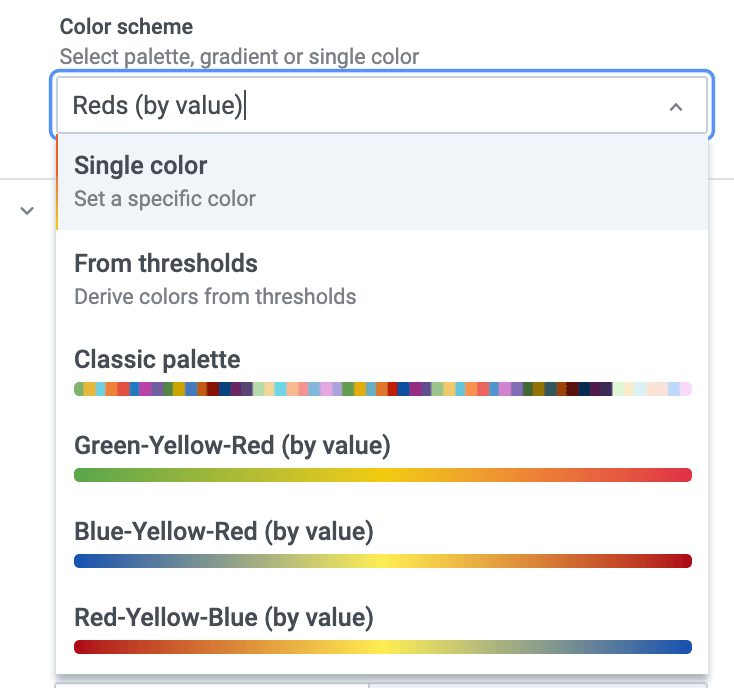
A new standard field color scheme option has been added. This new option will provide a unified way for all new panels to specify how colors should be assigned.
- Single color: Specifies a single color. Useful in an override rule.
- From thresholds: Informs Grafana to take color from the matching threshold.
- Classic palette: Assigns a color by looking up a color in a palette by series index. Useful for Graphs and pie charts, and other categorical data visualizations in Grafana.
- Green-Yellow-Red (by value): A continuous color scheme where Grafana will interpolate a color based on the value assigned to the green, yellow, and red components. The value must be within the min & max limits.
- Blue-Yellow-Red (by value): Same as above but different colors.
- Blues (by value): Same as above but color scheme go from panel background to blue.
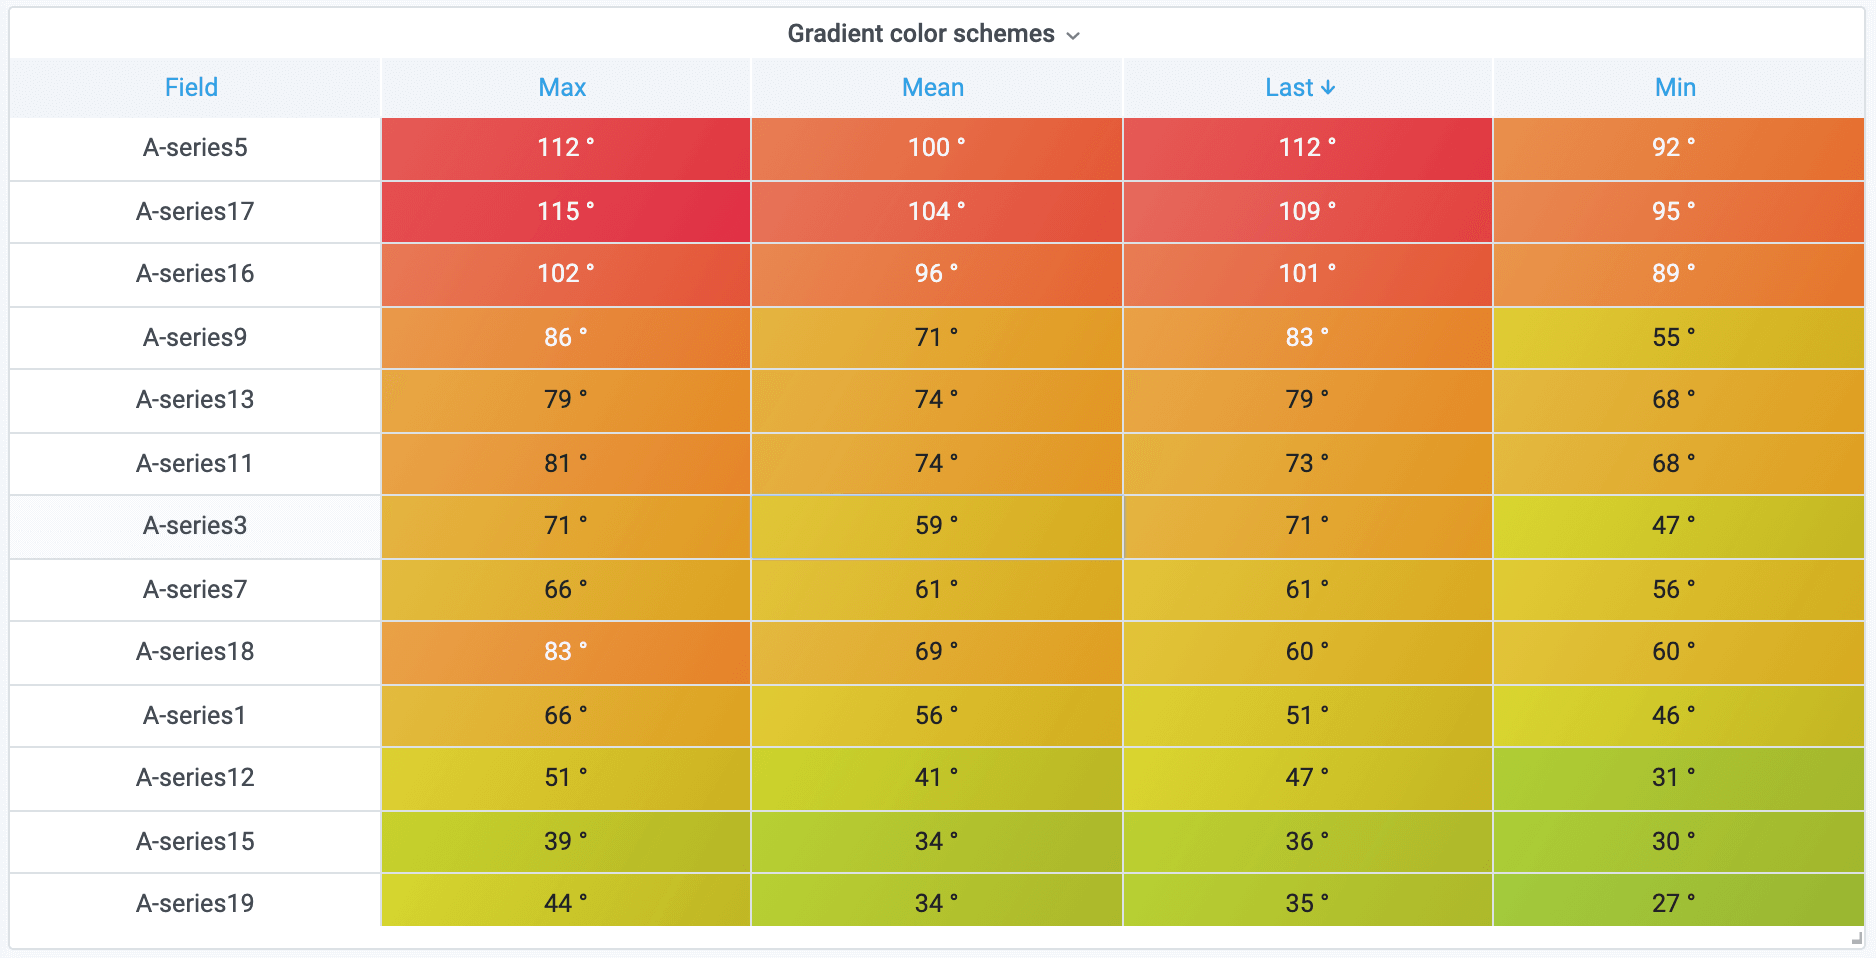
As you can see this adds new continuous color schemes where Grafana will interpolate colors. A great use of these new color schemes is the table panel where you can color the background and get a heatmap like effect.

Another thing to highlight is that all these new color schemes are theme aware and adapt to the current theme. For example here is how the new monochrome color scheme look like in the light theme:

As this new option is a standard field option it works in every panel. Here is another example from the Bar Gauge panel.

CSV exports for Excel
In v7.0, we introduced a new table panel and inspect mode with Download CSV enabled. However, CSV export to Excel was removed. Due to a large number of inquiries and requests, this community contribution from tomdaly brought the feature back.
For more information, refer to Download raw query results as CSV in the Grafana documentation.
Google Cloud monitoring out-of-the-box dashboards
The updated Google Cloud monitoring data source is shipped with pre-configured dashboards for five of the most popular Google Cloud Platform (GCP) services:
- BigQuery
- Cloud Load Balancing
- Cloud SQL
- Google Compute Engine
GCE - Google Kubernetes Engine
GKE
To import the pre-configured dashboards, go to the configuration page of your Google Cloud Monitoring data source and click on the Dashboards tab. Click Import for the dashboard you would like to use. To customize the dashboard, we recommend to save the dashboard under a different name, because otherwise the dashboard will be overwritten when a new version of the dashboard is released.
For more details, see the Google Cloud Monitoring docs
Shorten URL for dashboards and Explore
This is an amazing new feature that was created in cooperation with one of our community members. The new share shortened link capability allows you to create smaller and simpler URLs of the format /goto/:uid instead of using longer URLs that can contain complex query parameters. In Explore, you can create a shortened link by clicking on the share button in Explore toolbar. In the dashboards, a shortened url option is available through the share panel or dashboard button.
SigV4 authentication for AWS users
You can now configure your Elasticsearch data source to access your Amazon Elasticsearch Service domain directly from Grafana.
For more details, refer to the Elasticsearch docs.
Chaining pipeline aggregation in Elasticsearch
Thanks to a contribution from a community member, it’s now possible to chain multiple pipeline aggregations together and use the results of one pipeline aggregation as the input of another. This unleashes the full power of Elasticsearch’s pipeline aggregations in Grafana, allowing users to perform high order derivatives or use a pipeline aggregation result as a variable for a Bucket Script Aggregation.
Grafana Enterprise features
These features are included in the Grafana Enterprise edition software.
Auditing
Auditing tracks important changes to your Grafana instance to help you manage and mitigate suspicious activity and meet compliance requirements. Grafana logs events (as JSON) to file or directly to loki.
Example of a login event:
{
  "timestamp": "2020-10-22T10:18:00.838094347Z",
  "user": {
    "userId": 1,
    "orgId": 1,
    "isAnonymous": false
  },
  "action": "login-grafana",
  "result": {
    "statusType": "success",
    "statusCode": 200
  },
  "requestUri": "/login",
  "ipAddress": "127.0.0.1:41324",
  "userAgent": "Chrome/86.0.4240.111",
  "grafanaVersion": "7.3.0"
}
For more details, see the Auditing docs.
Data source usage insights
Data source usage insights allows you to gain insight into how a data source is being used and how well it works. There is a new tab in the data source settings page called insights that will show you information about how the data source has been used in the past 30 days.
Insights:
- Queries per day
- Errors per day
- Average load duration per day (ms)
SAML single logout
SAML’s single logout (SLO) capability allows users to log out from all applications associated with the current identity provider (IdP) session established via SAML SSO. For more information, refer to the docs.
SAML IdP-initiated single sign on
IdP-initiated single sign on (SSO) allows the user to log in directly from the SAML identity provider (IdP). It is disabled by default for security reasons. For more information, refer to the docs.
Upgrading
See upgrade notes.
Changelog
Check out CHANGELOG.md for a complete list of new features, changes, and bug fixes.


