Important: This documentation is about an older version. It's relevant only to the release noted, many of the features and functions have been updated or replaced. Please view the current version.
What’s new in Grafana v5.3
Grafana v5.3 brings new features, many enhancements and bug fixes. This article will detail the major new features and enhancements.
- Google Stackdriver as a core data source!
- TV mode is improved and more accessible
- Alerting with notification reminders
- Postgres gets a new query builder!
- OAuth support for GitLab is improved
- Annotations with template variable filtering
- Variables with free text support
Google Stackdriver

Grafana v5.3 ships with built-in support for Google Stackdriver and enables you to visualize your Stackdriver metrics in Grafana.
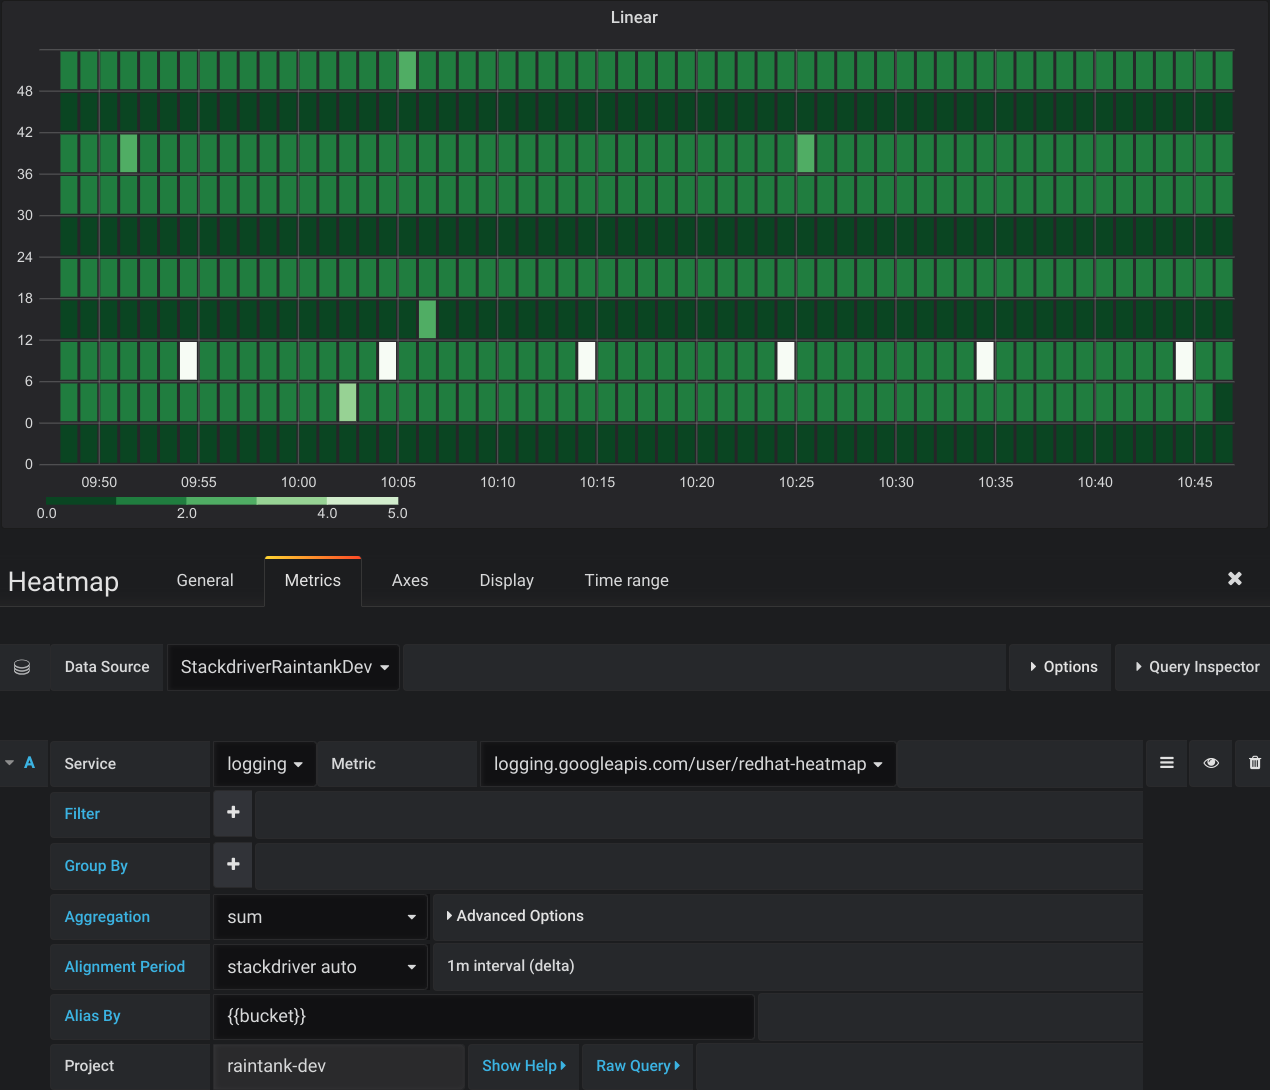
Getting started with the plugin is easy. Simply create a GCE Service account that has access to the Stackdriver API scope, download the Service Account key file from Google and upload it on the Stackdriver data source configuration page in Grafana and you should have a secure server-to-server authentication setup. Like other core plugins, Stackdriver has built-in support for alerting. It also comes with support for heatmaps and basic variables.
If you’re already accustomed to the Stackdriver Metrics Explorer UI, you’ll notice that there are a lot of similarities to the query editor in Grafana. It is possible to add filters using wildcards and regular expressions. You can do Group By, Primary Aggregation and Alignment.
Alias By allows you to format the legend the way you want, and it’s a feature that is not yet present in the Metrics Explorer. Two other features that are only supported in the Grafana plugin are the abilities to manually set the Alignment Period in the query editor and to add Annotations queries.
The Grafana Stackdriver plugin comes with support for automatic unit detection. Grafana will try to map the Stackdriver unit type to a corresponding unit type in Grafana, and if successful the panel Y-axes will be updated accordingly to display the correct unit of measure. This is the first core plugin to provide support for unit detection, and it is our intention to provide support for this in other core plugins in the near future.
The data source is still in the beta phase, meaning it’s currently in active development and is still missing one important feature - templating queries.
Please try it out, but be aware of that it might be subject to changes and possible bugs. We would love to hear your feedback.
Refer to Using Google Stackdriver in Grafana for more detailed information on how to get started and use it.
TV and Kiosk Mode
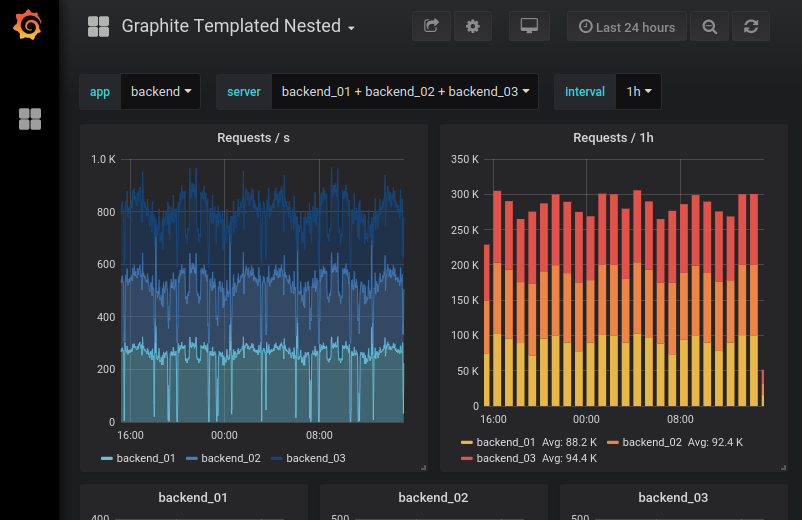
We’ve improved the TV and kiosk mode to make it easier to use. There’s now an icon in the top bar that will let you cycle through the different view modes.
- In the first view mode, the sidebar and most of the buttons in the top bar will be hidden.
- In the second view mode, the top bar is completely hidden so that only the dashboard itself is shown.
- Hit the escape key to go back to the default view mode.
When switching view modes, the URL will be updated to reflect the view mode selected. This allows a dashboard to be opened with a certain view mode enabled. Additionally, this also enables playlists to be started with a certain view mode enabled.
Notification Reminders
Do you use Grafana alerting and have some notifications that are more important than others? Then it’s possible to set reminders so that you continue to be alerted until the problem is fixed. This is done on the notification channel itself and will affect all alerts that use that channel. For additional examples of why reminders might be useful for you, see multiple series.
For more information about how to enable and configure reminders, refer to alerting reminders.
Postgres Query Builder
Grafana 5.3 comes with a new graphical query builder for Postgres. This brings Postgres integration more in line with some of the other data sources and makes it easier for both advanced users and beginners to work with timeseries in Postgres. For more information about Postgres graphical query builder, refer to query editor.
Improved OAuth Support for GitLab
Grafana 5.3 comes with a new OAuth integration for GitLab that enables configuration to only allow users that are a member of certain GitLab groups to authenticate. This makes it possible to use GitLab OAuth with Grafana in a shared environment without giving everyone access to Grafana. For more information about how to enable and configure OAuth, refer to Gitlab OAuth.
Annotations
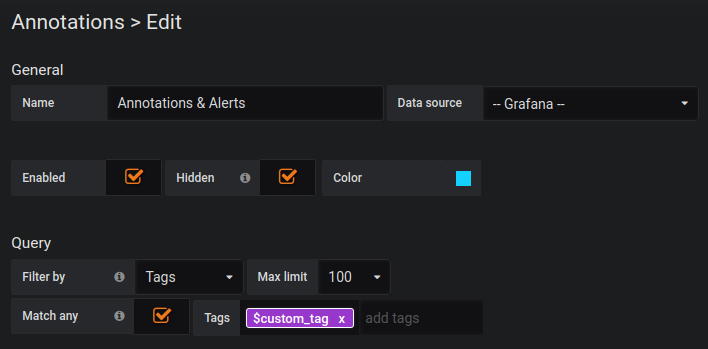
Grafana 5.3 brings improved support for native annotations and makes it possible to use template variables when filtering by tags. For more information about native annotation, refer to query by tag.

Variables
Grafana 5.3 ships with a brand new variable type named Text box which makes it easier and more convenient to provide free text input to a variable.
This new variable type will display as a free text input field with an optional prefilled default value.
Changelog
Check out the CHANGELOG.md file for a complete list of new features, changes, and bug fixes.


