Important: This documentation is about an older version. It's relevant only to the release noted, many of the features and functions have been updated or replaced. Please view the current version.
View alert rules
To view alerts:
- In the Grafana menu hover your cursor over the Alerting (bell) icon.
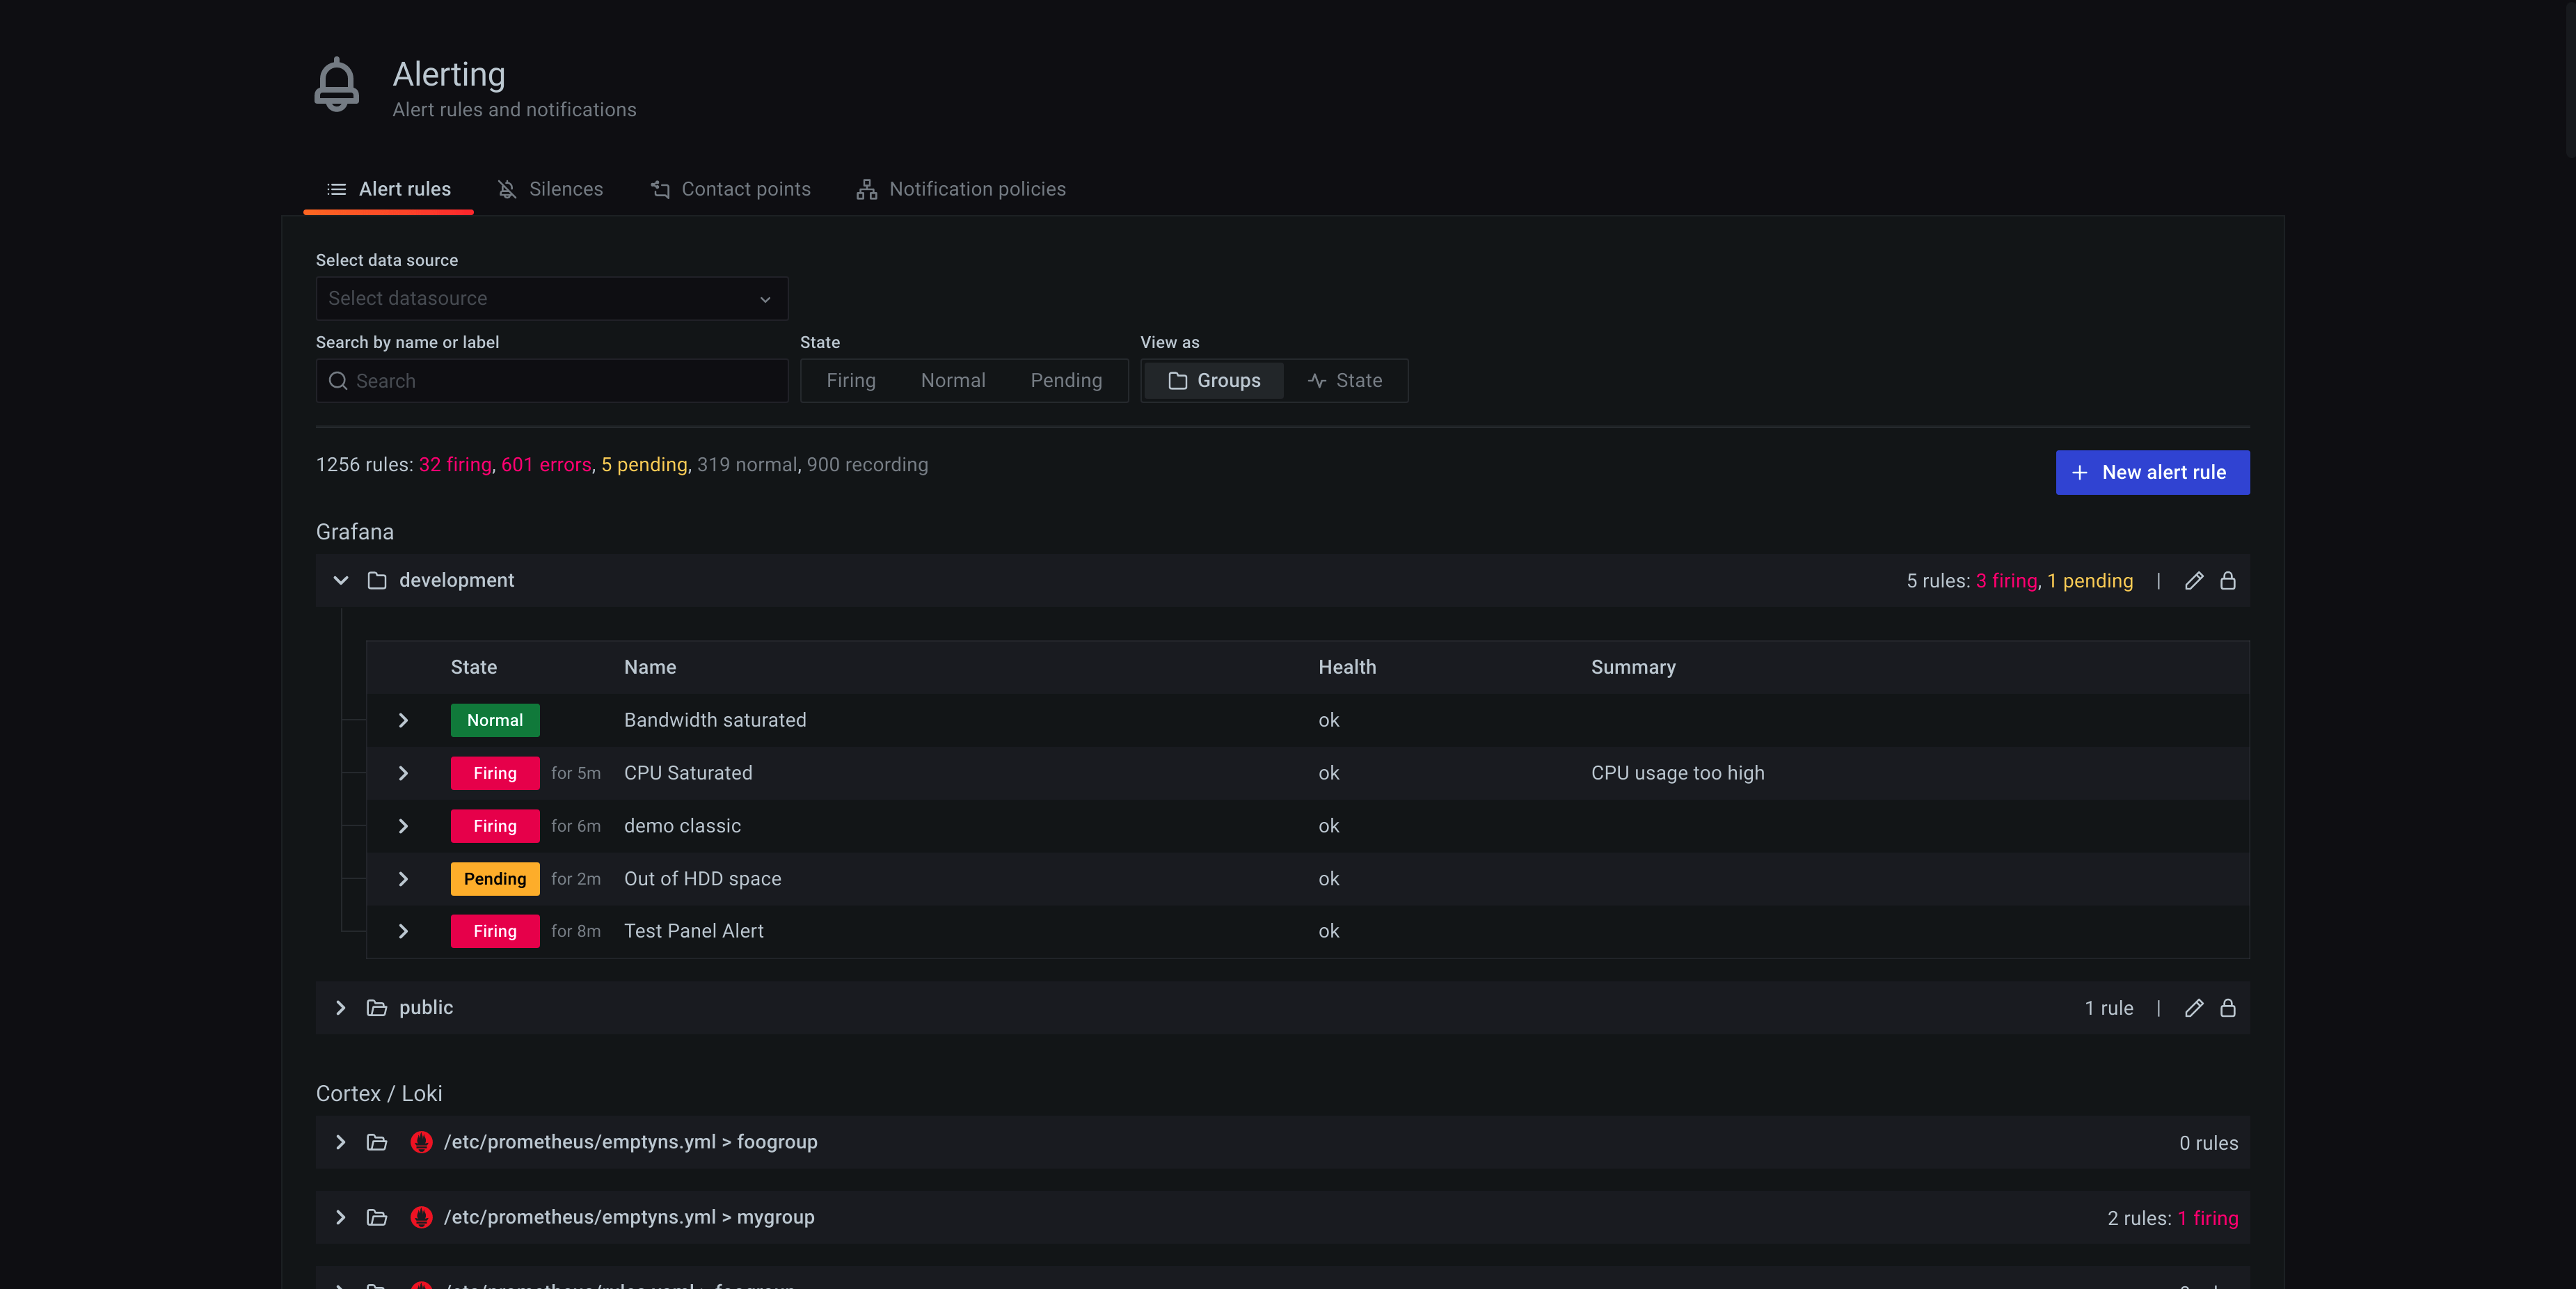
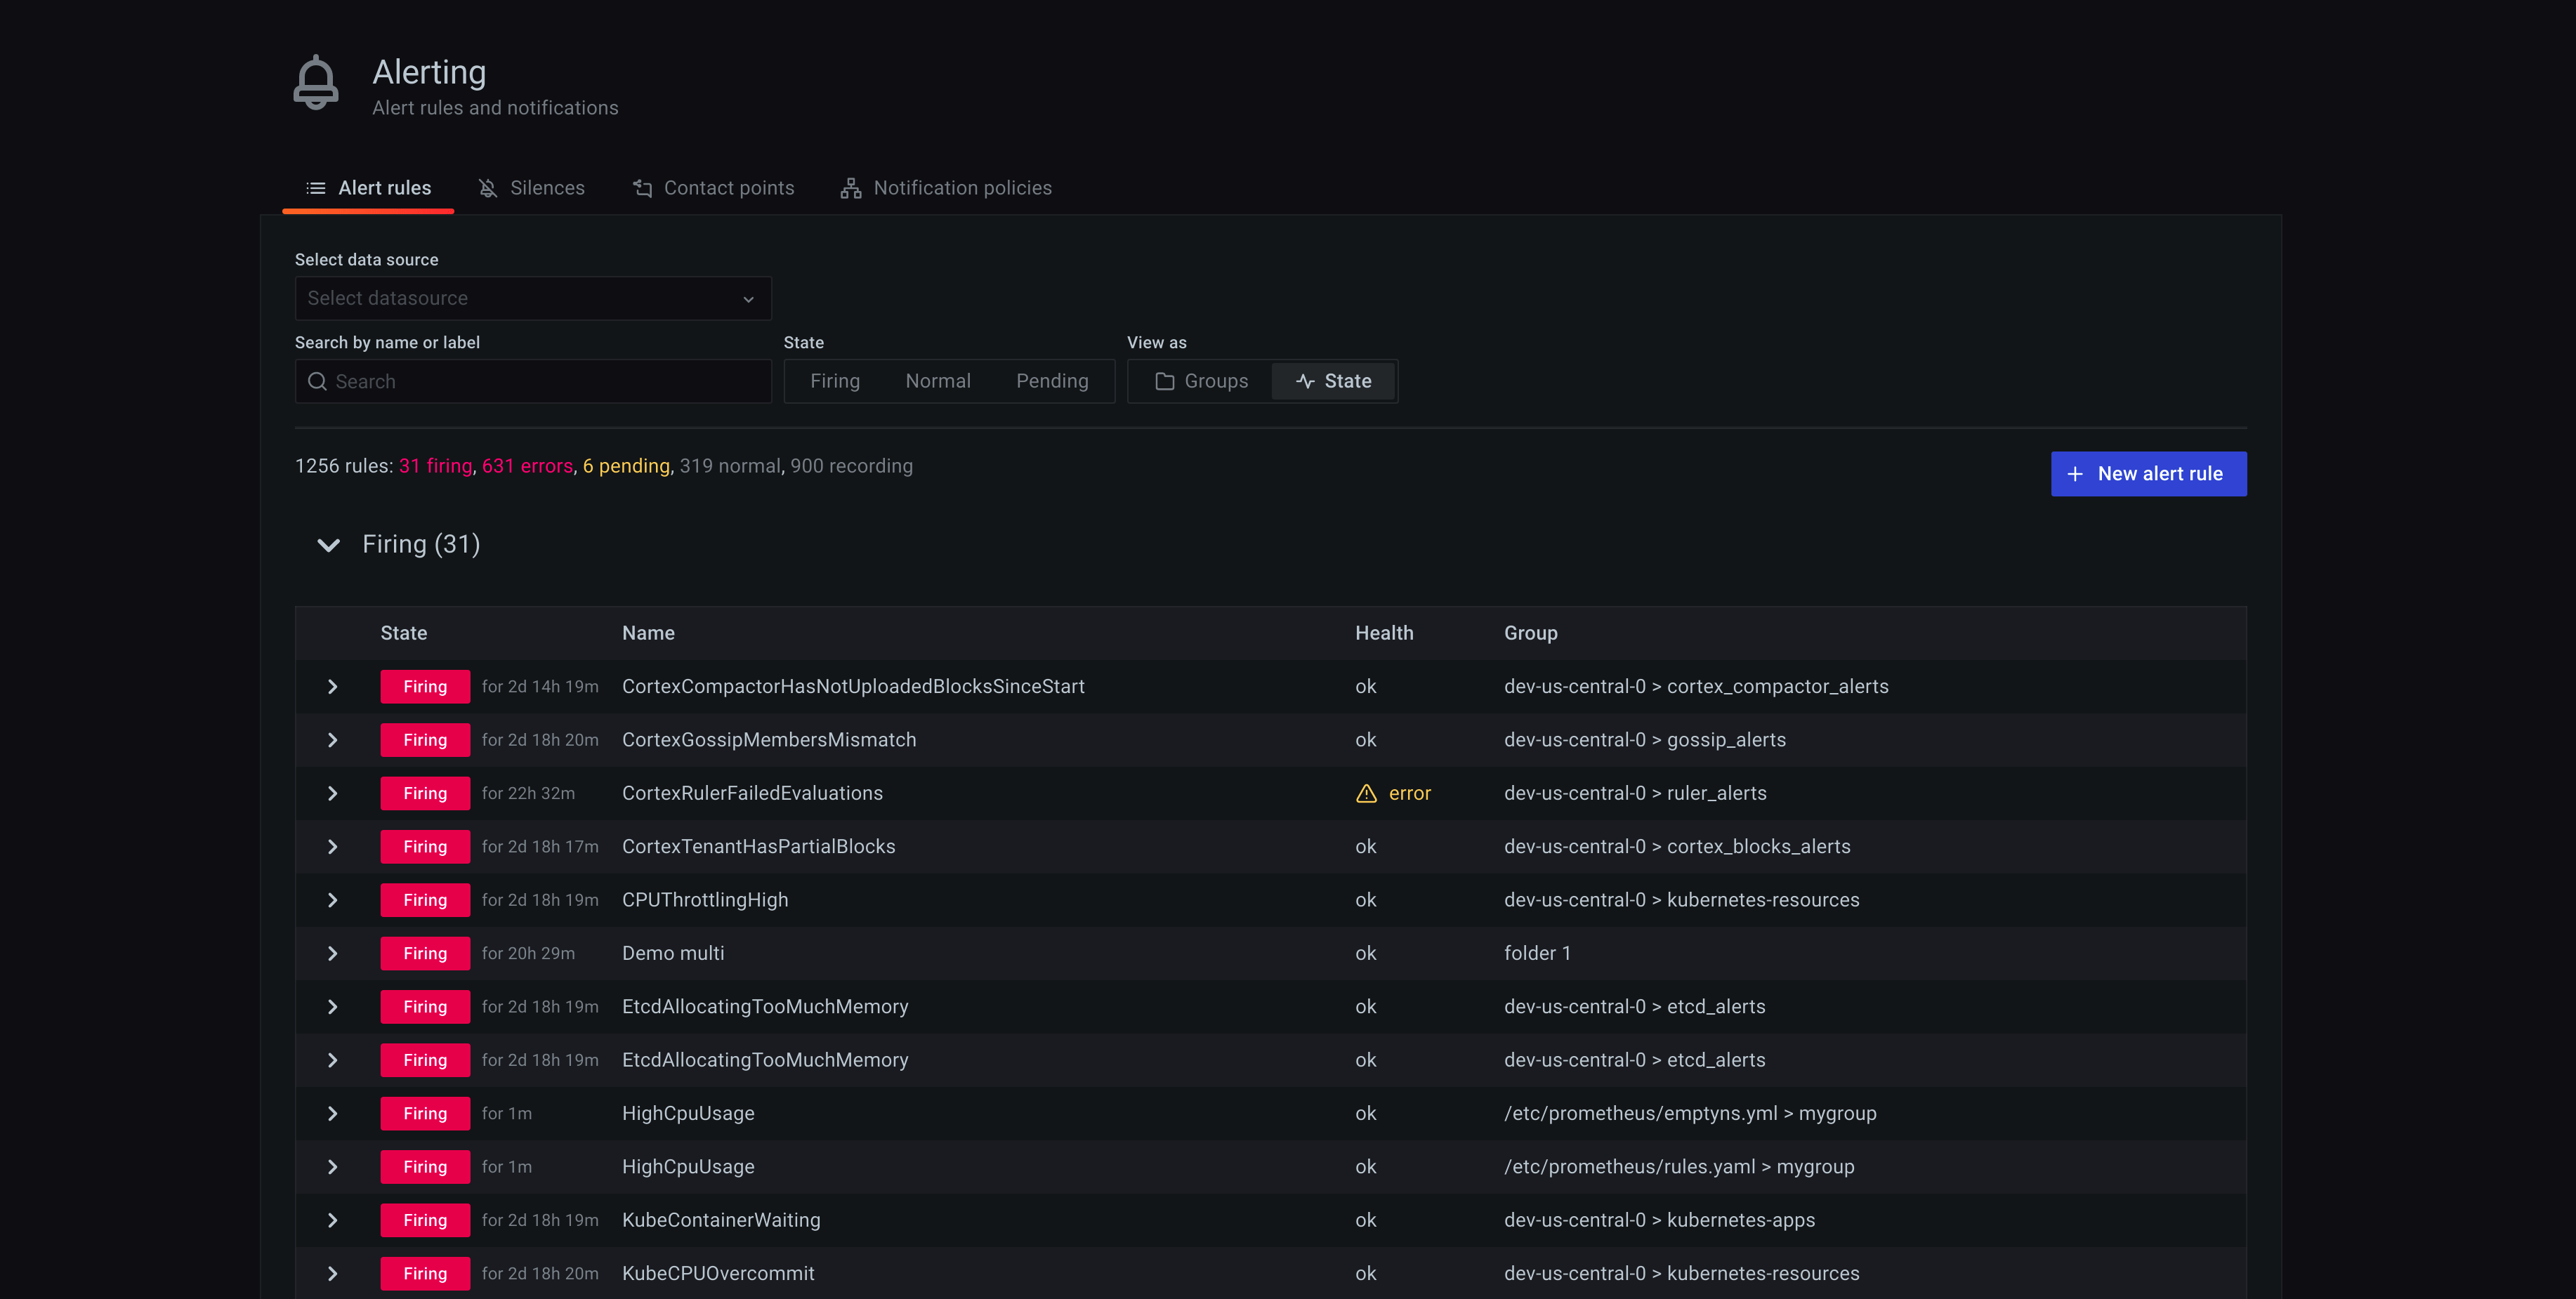
- Click Alert Rules. You can see all configured Grafana alert rules as well as any rules from Loki or Prometheus data sources. By default, the group view is shown. You can toggle between group or state views by clicking the relevant View as buttons in the options area at the top of the page.
Group view
Group view shows Grafana alert rules grouped by folder and Loki or Prometheus alert rules grouped by namespace + group. This is the default rule list view, intended for managing rules. You can expand each group to view a list of rules in this group. Each rule can be further expanded to view its details. Action buttons and any alerts spawned by this rule, and each alert can be further expanded to view its details.

State view
State view shows alert rules grouped by state. Use this view to get an overview of which rules are in what state. Each rule can be expanded to view its details. Action buttons and any alerts spawned by this rule, and each alert can be further expanded to view its details.

Filter alert rules
You can use the following filters to view only alert rules that match specific criteria:
- Filter alerts by label - Search by alert labels using label selectors in the Search input. eg:
environment=production,region=~US|EU,severity!=warning - Filter alerts by state - In States Select which alert states you want to see. All others are hidden.
- Filter alerts by data source - Click the Select data source and select an alerting data source. Only alert rules that query selected data source will be visible.
Rule details
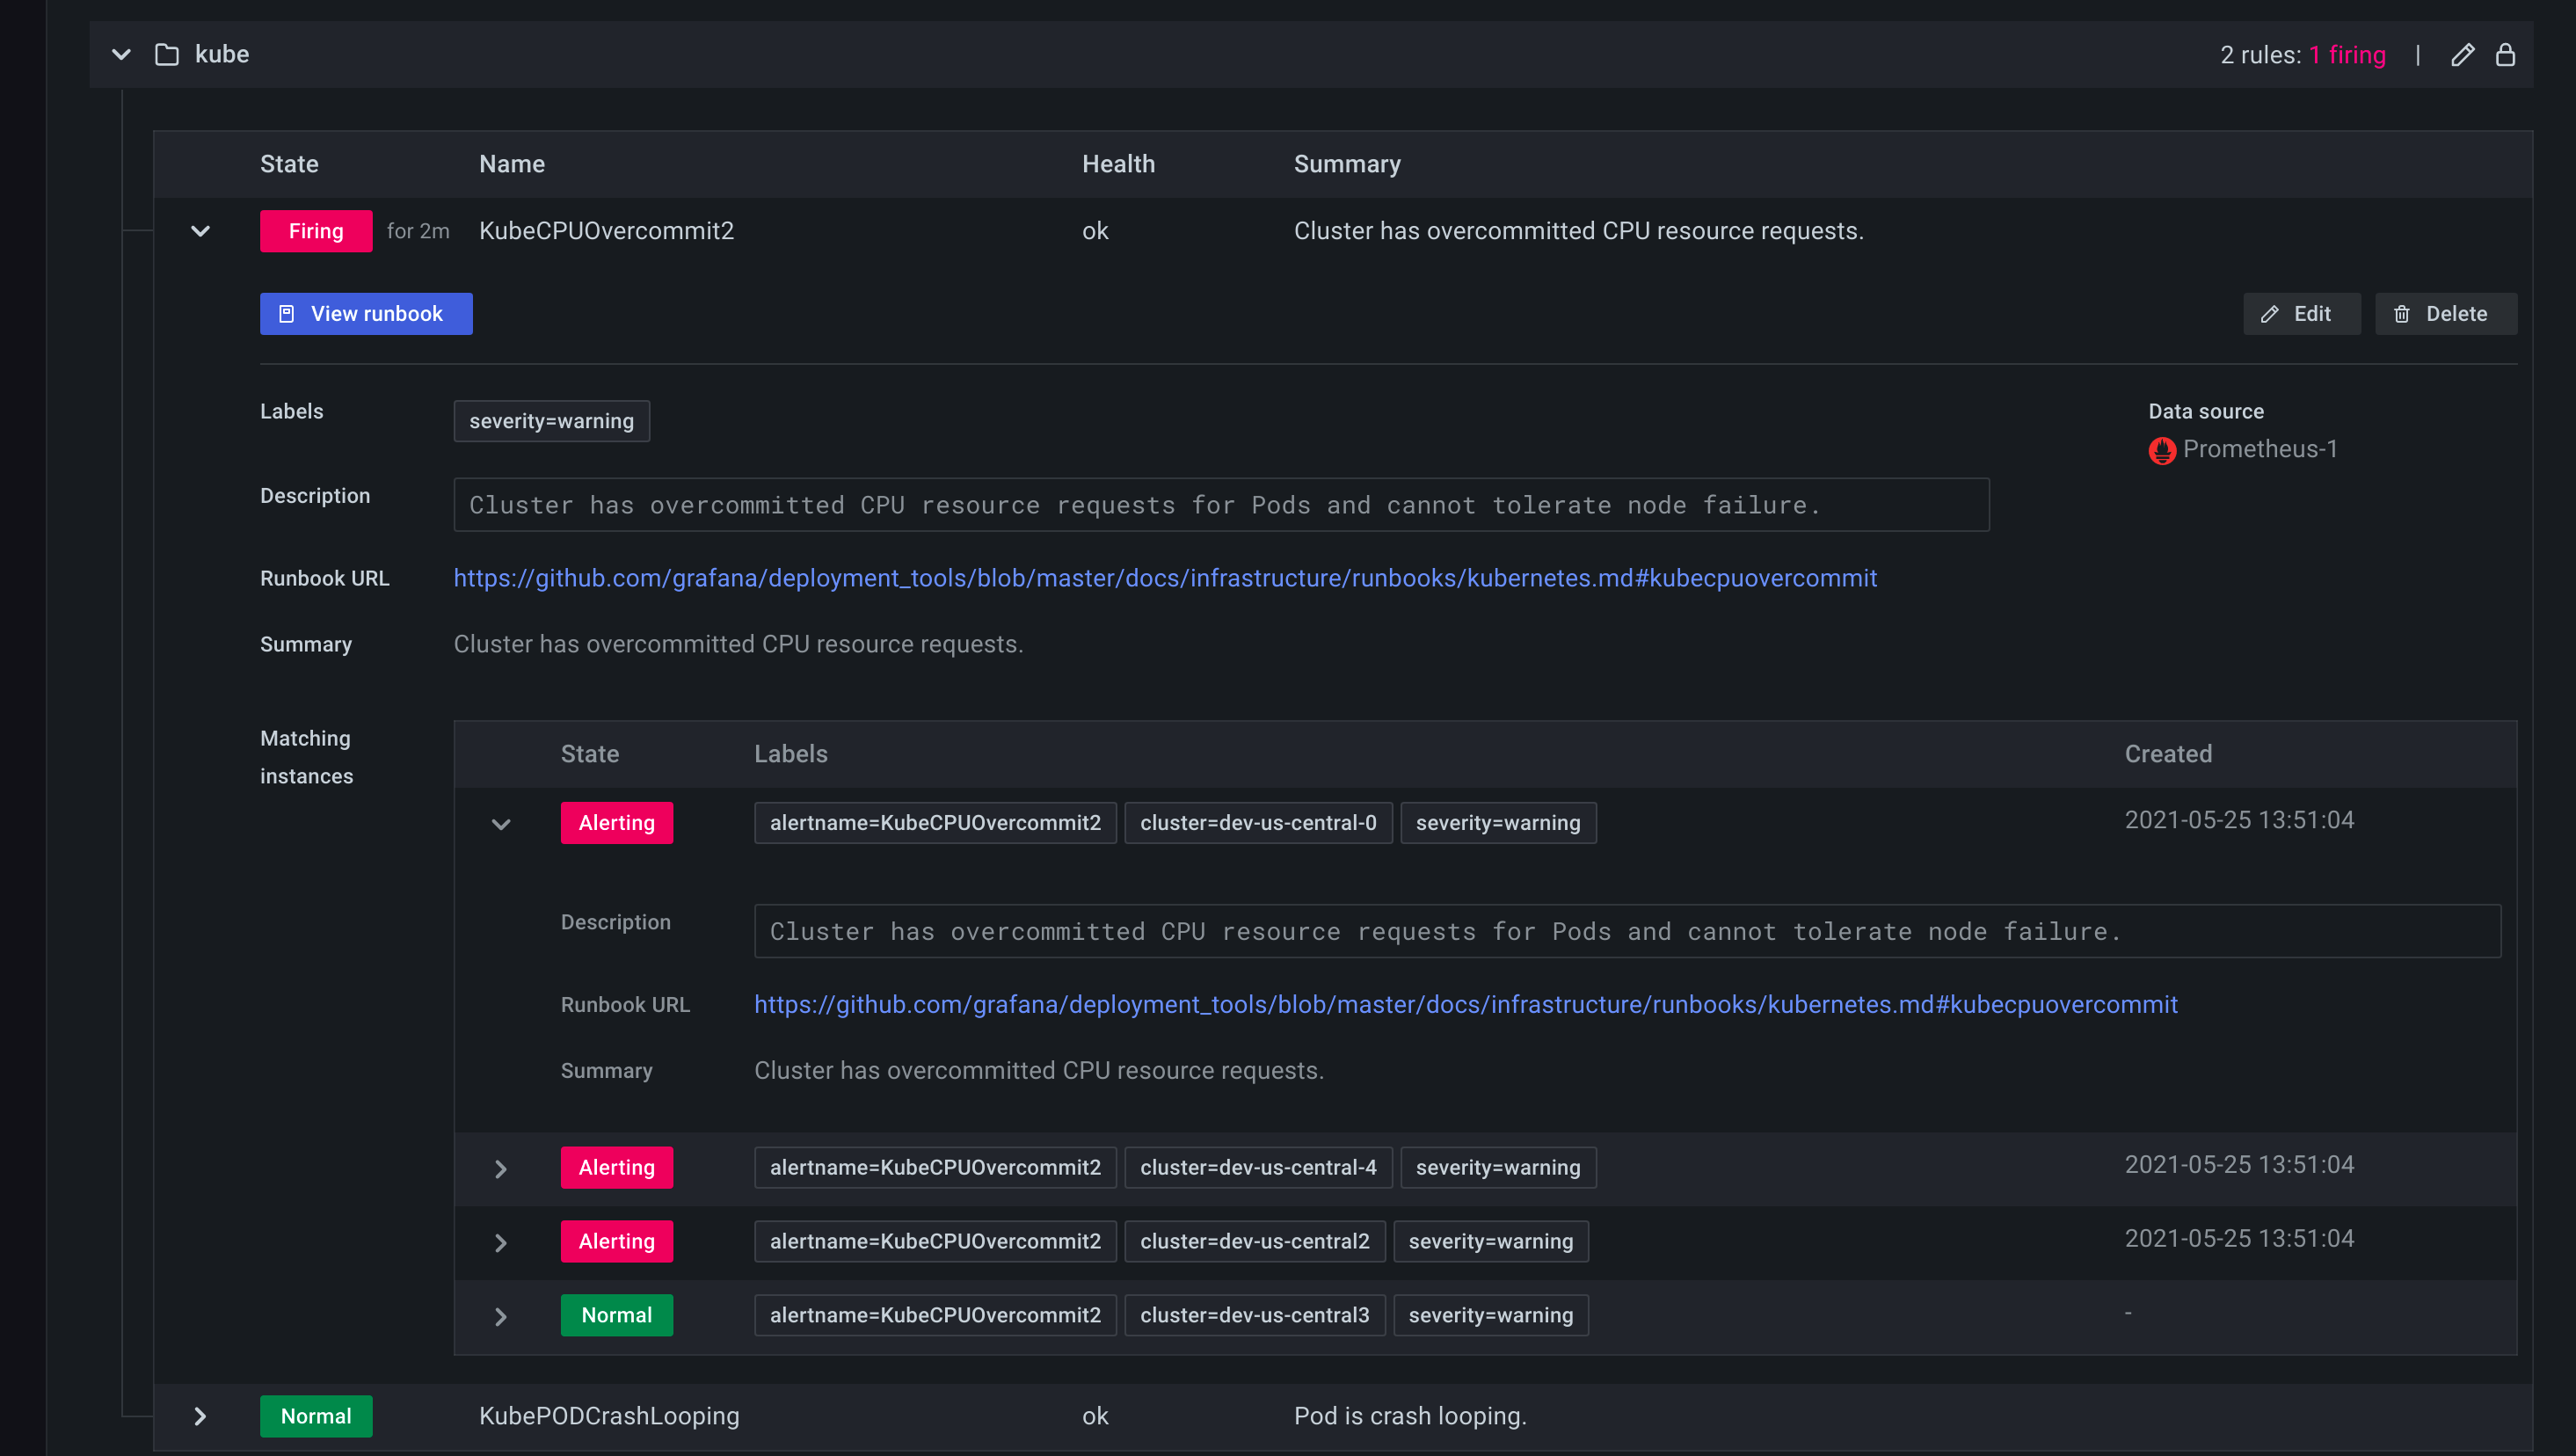
A rule row shows the rule state, health, and summary annotation if the rule has one. You can expand the rule row to display rule labels, all annotations, data sources this rule queries, and a list of alert instances spawned from this rule.

Edit or delete rule
Grafana rules can only be edited or deleted by users with Edit permissions for the folder which contains the rule. Prometheus or Loki rules can be edited or deleted by users with Editor or Admin roles.
To edit or delete a rule:
- Expand this rule to reveal rule controls.
- Click Edit to go to the rule editing form. Make changes following instructions listed here.
- Click Delete" to delete a rule.
Opt-out a Loki or Prometheus data source
If you do not want rules to be loaded from a Prometheus or Loki data source, go to its settings page and clear the Manage alerts via Alerting UI checkbox.
Was this page helpful?
Related resources from Grafana Labs


