Menu
Important: This documentation is about an older version. It's relevant only to the release noted, many of the features and functions have been updated or replaced. Please view the current version.
Documentation Grafana documentation
Grafana Enterprise
Usage insights
Dashboard and data source insights
Grafana documentation
Grafana Enterprise
Usage insights
Dashboard and data source insights
Enterprise
Open source
Dashboard and data source insights
For every dashboard and data source, you can access usage information.
Dashboard insights
Note: Available in Grafana Enterprise v7.0+.
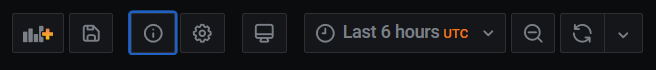
To see dashboard usage information, go to the top bar and click Dashboard insights.
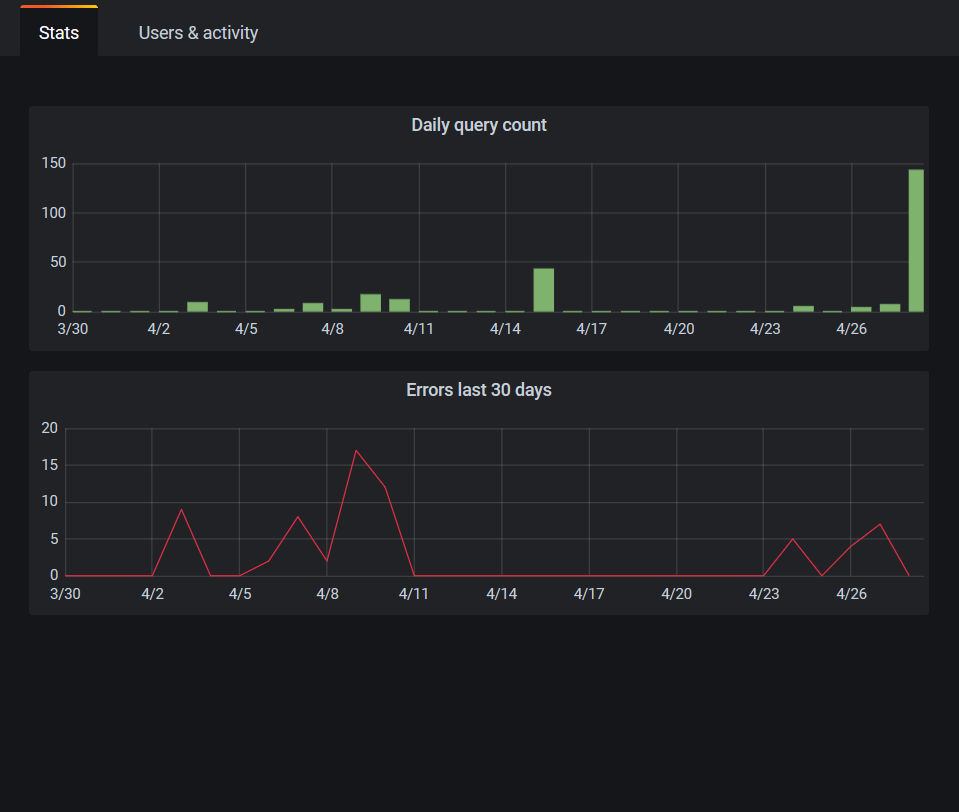
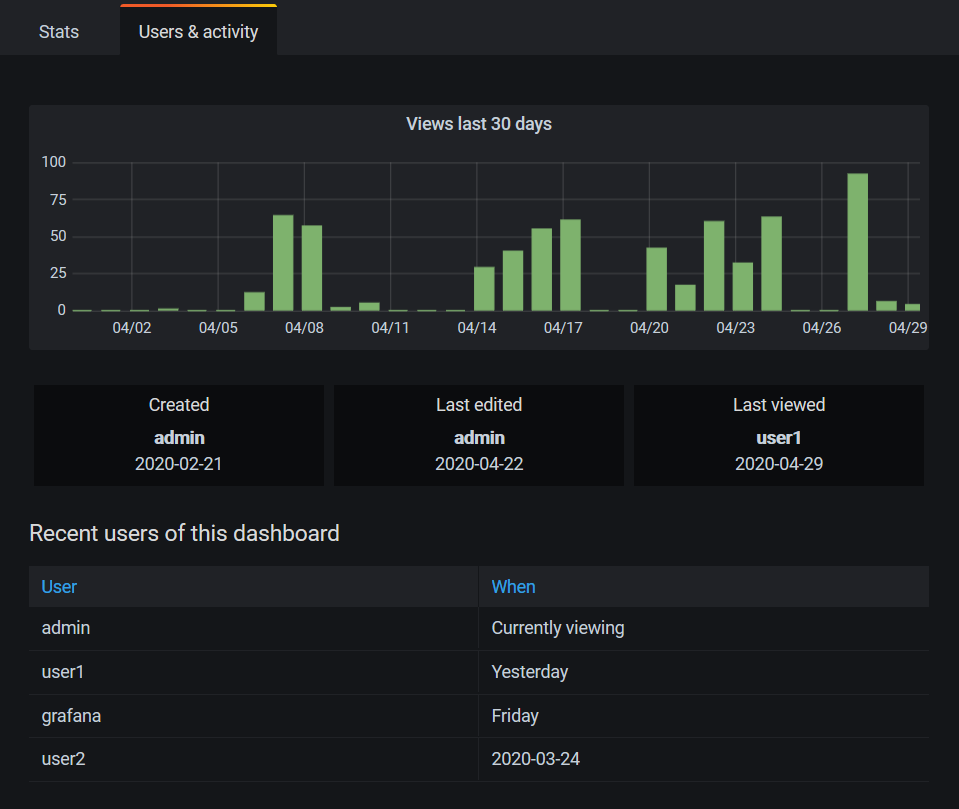
Dashboard insights show the following information:
- Stats: The number of daily queries and errors for the past 30 days.
- Users & activity: The daily view count for the last 30 days; last activities on the dashboard and recent users (with a limit of 20).
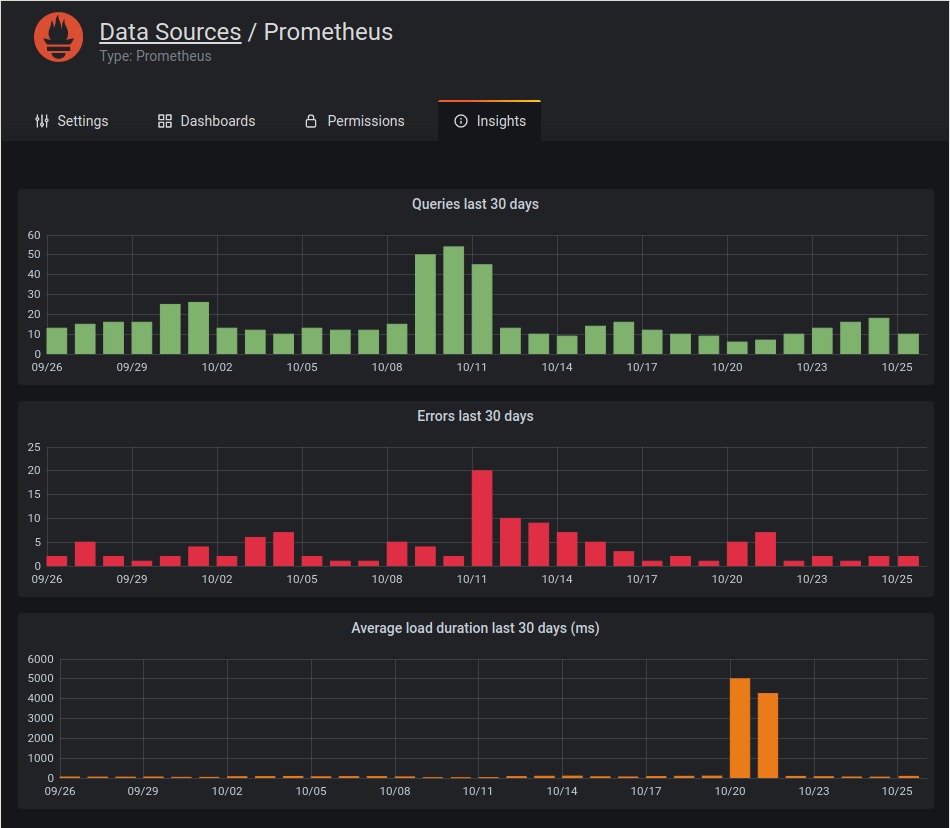
Data source insights
Note: Available in Grafana Enterprise v7.3+.
Data source insights give you information about how a data source has been used in the past 30 days, such as:
- Queries per day
- Errors per day
- Query load time per day (averaged in ms)
To find data source insights:
- Go to the Data source list view.
- Click on a data source.
- Click the Insights tab.