Important: This documentation is about an older version. It's relevant only to the release noted, many of the features and functions have been updated or replaced. Please view the current version.
What’s new in Grafana v7.1
This topic includes the release notes for the Grafana v7.1. For all details, read the full CHANGELOG.md.
The main highlights are:
- Flux and InfluxDB 2.x support in the Influx Datasource
- Query history search
- Unification of Explore modes
- Elasticsearch- link to another data source from Explore
- Merge on time transform for the new table panel
- Stat panel text mode
- Time range picker update
- Provisioning of apps
- Azure Monitor Datasource
- Deep linking for Google Cloud Monitoring (formerly named Google Stackdriver) datasource
- Grafana Enterprise features
Influx data source
Support for Flux and Influx v2 has been added. The InfluxData blog post, How to Build Grafana Dashboards with InfluxDB, Flux and InfluxQL explains the changes in depth.
Query history search
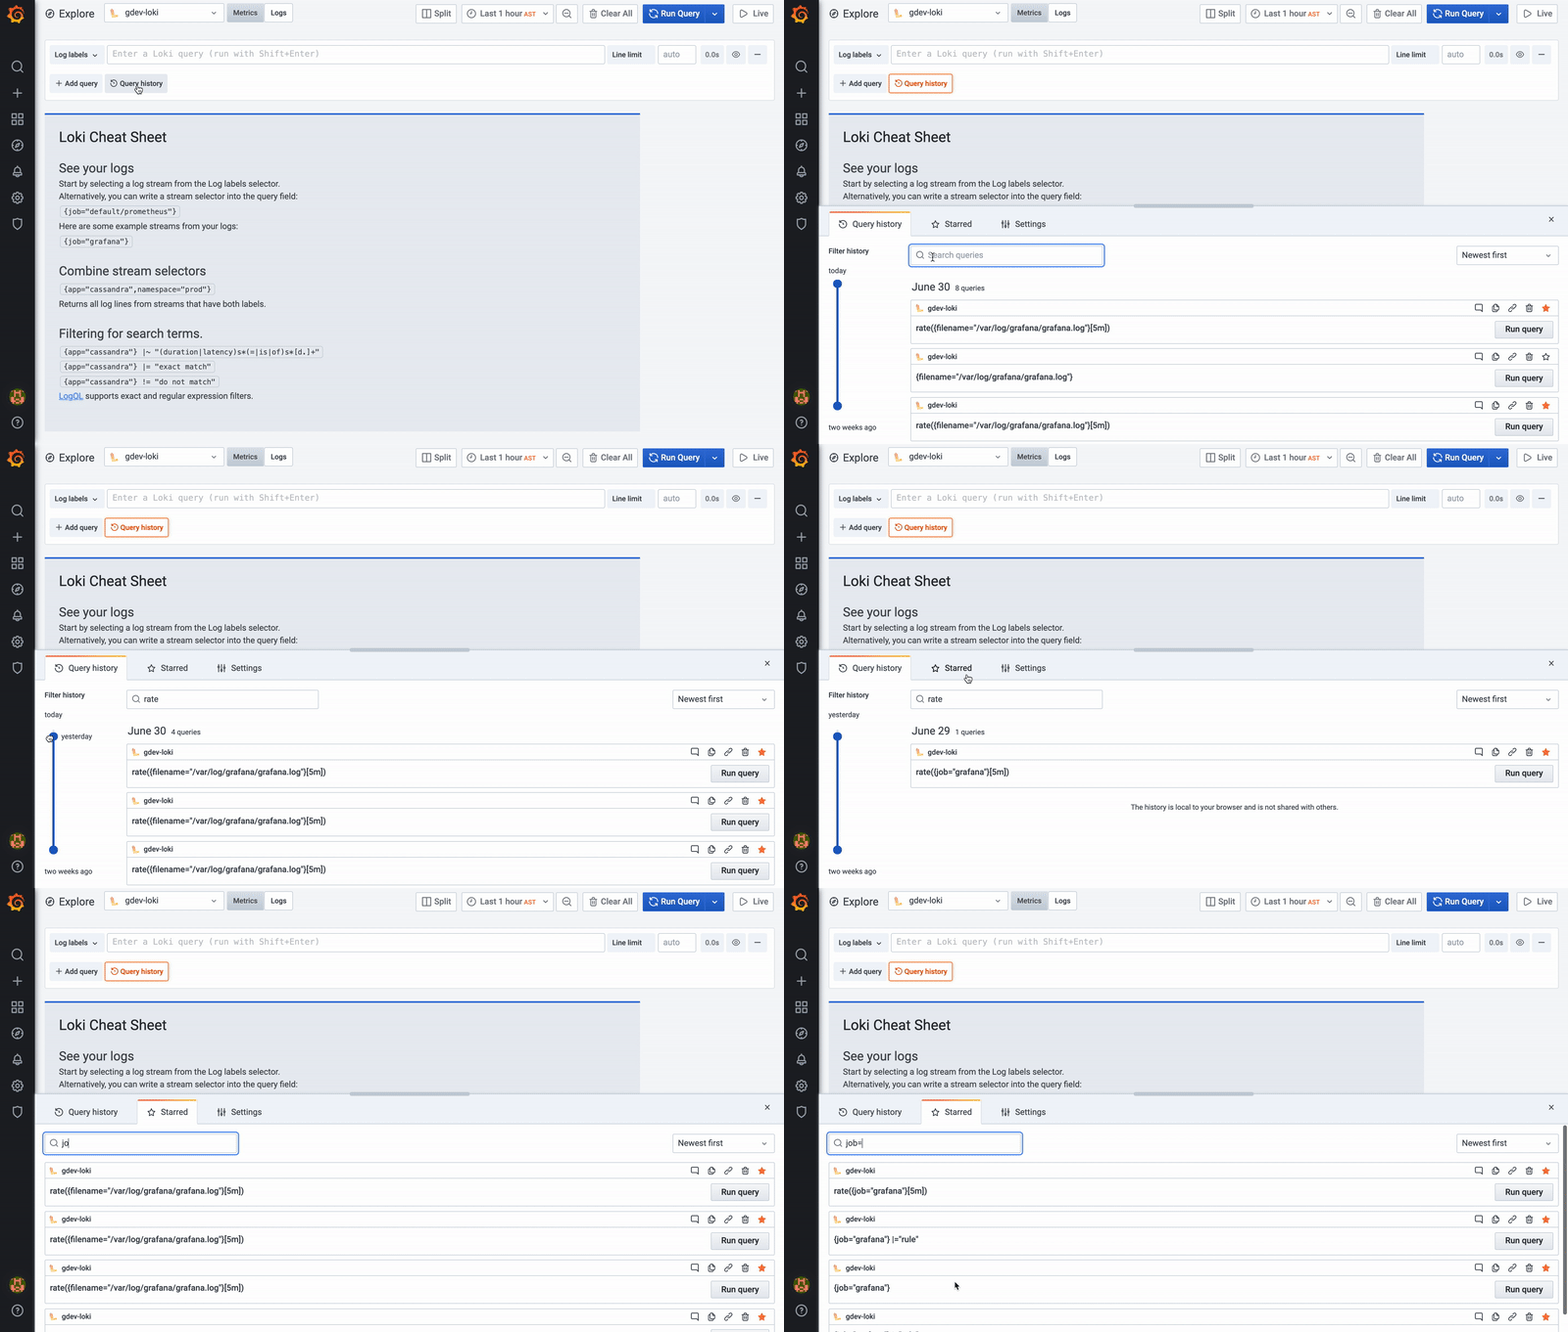
In Grafana v 7.1 we are introducing search functionality in Query history. You can search across queries and your comments. It is especially useful in combination with a time filter and data source filter. Read more about Query history here.

Explore modes unified
Grafana 7.1 includes a major change to Explore: it removes the query mode selector.
Many data sources tell Grafana whether a response contains time series data or logs data. Using this information, Explore chooses which visualization to use for that data. This means that you don’t need to switch back and forth between Logs and Metrics modes depending on the type of query that you want to make.
Internal links for Elasticsearch
The new internal linking feature for Elasticsearch allows you to link to other data sources from your logs. You can now create links in Elastic configuration that point to another data source (similar to an existing feature in Loki). An example would be using a traceID field from your logs to be able to link to traces in a tracing data source like Jaeger.
Transformations
We have added a new Merge on time transform that can combine many time series or table results. Unlike the join transform this combines the result into one table even when the time values does not align / match.
The new table panel introduced in 7.0 was missing a few features that the old table panel had. This feature, along with ad hoc filtering, means that the new table panel has achieved feature parity with the old table panel.
Ad hoc filtering in the new table panel
Ad hoc filtering, a way to automatically add filters to queries without having to define template variables is now supported in the new Table panel.
Stat panel text mode
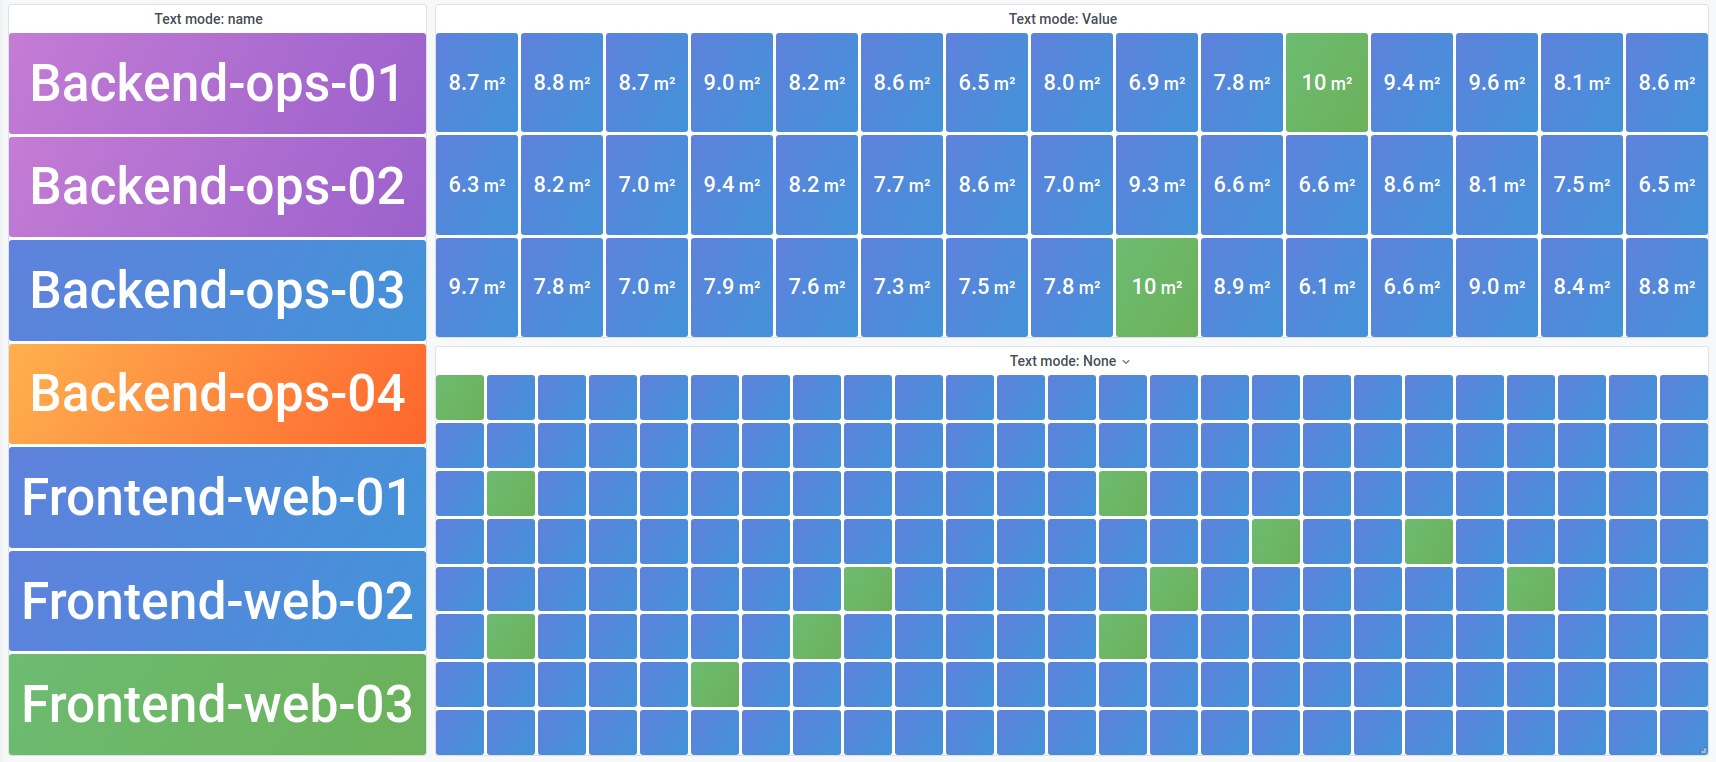
The stat panel has a new Text mode option to control what text to show.
By default, the Stat panel displays:
- Just the value for a single series or field.
- Both the value and name for multiple series or fields.
You can use the Text mode option to control what text the panel renders. If the value is not important, only name and color is, then change the Text mode to Name. The value will still be used to determine color and is displayed in a tooltip.

Provisioning of apps
Grafana v7.1 adds support for provisioning of app plugins. This allows app plugins to be configured and enabled/disabled using configuration files. Read more about provisioning of app plugins here.
Azure Monitor data source
Support for multiple dimensions has been added to all services in the Azure Monitor datasource. This means you can now group by more than one dimension with time series queries. With the Kusto based services, Log Analytics and Application Insights Analytics, you can also select multiple metrics as well as multiple dimensions.
Additionally, the Raw Edit mode for Application Insights Analytics has been replaced with a new service in the drop down for the data source and is called Insights Analytics. The new query editor behaves in the same way as Log Analytics.
Deep linking for Google Cloud Monitoring (formerly named Google Stackdriver) data source
A new feature in Grafana 7.1 is deep linking from Grafana panels to the Metrics Explorer in Gooogle Cloud Console. Click on a time series in the panel to see a context menu with a link to View in Metrics explorer in Google Cloud Console. Clicking that link opens the Metrics explorer in the Monitoring Google Cloud Console and runs the query from the Grafana panel there.
Time range picker update
With 7.1 we are updating the dashboard’s time range picker to allow time zone selection. You no longer need to go to dashboard settings to change the dashboard’s time zone.
The time zone picker itself also got UX improvements. Now you can search for the timezone using country or city name, time zone abbreviations, or UTC offsets.
Grafana Enterprise features
General features are included in the Grafana Enterprise edition software.
Support for HashiCorp Vault
You can now use HashiCorp Vault to get secrets for configuration and provisioning of Grafana Enterprise. Learn more about this feature here.
Support for monthly schedules in reports
With Grafana Enterprise 7.1, you can generate reports on a monthly schedule.
Upgrading
See upgrade notes.
Changelog
Check out CHANGELOG.md for a complete list of new features, changes, and bug fixes.


