Important: This documentation is about an older version. It's relevant only to the release noted, many of the features and functions have been updated or replaced. Please view the current version.
Alert Notifications
Alerting is only available in Grafana v4.0 and above.
When an alert changes state, it sends out notifications. Each alert rule can have
multiple notifications. In order to add a notification to an alert rule you first need
to add and configure a notification channel (can be email, PagerDuty or other integration).
This is done from the Notification Channels page.
Notification Channel Setup
On the Notification Channels page hit the New Channel button to go the page where you
can configure and setup a new Notification Channel.
You specify a name and a type, and type specific options. You can also test the notification to make sure it’s setup correctly.
Default (send on all alerts)
When checked, this option will notify for all alert rules - existing and new.
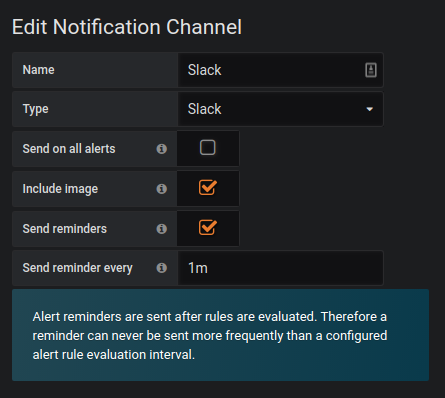
Send reminders
Only available in Grafana v5.3 and above.

When this option is checked additional notifications (reminders) will be sent for triggered alerts. You can specify how often reminders
should be sent using number of seconds (s), minutes (m) or hours (h), for example 30s, 3m, 5m or 1h etc.
Important: Alert reminders are sent after rules are evaluated. Therefore a reminder can never be sent more frequently than a configured alert rule evaluation interval.
These examples show how often and when reminders are sent for a triggered alert.
Disable resolve message
When checked, this option will disable resolve message [OK] that is sent when alerting state returns to false.
Supported Notification Types
Grafana ships with the following set of notification types:
To enable email notifications you have to setup SMTP settings
in the Grafana config. Email notifications will upload an image of the alert graph to an
external image destination if available or fallback to attaching the image to the email.
Be aware that if you use the local image storage email servers and clients might not be
able to access the image.
Slack

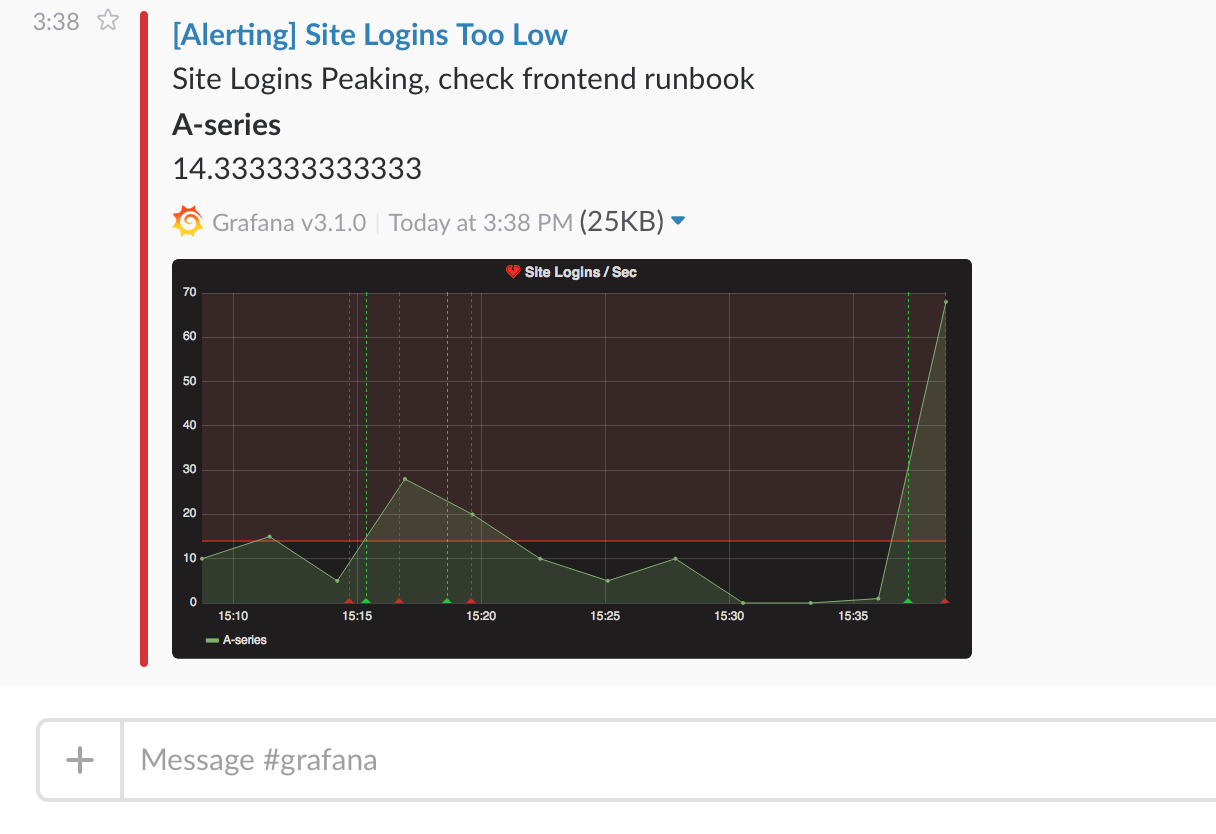
To set up slack you need to configure an incoming webhook url at slack. You can follow their guide on how to do that here. If you want to include screenshots of the firing alerts in the Slack messages you have to configure either the external image destination in Grafana, or a bot integration via Slack Apps. Follow Slack’s guide to set up a bot integration and use the token provided (https://api.slack.com/bot-users), which starts with “xoxb”.
If you are using the token for a slack bot, then you have to invite the bot to the channel you want to send notifications and add the channel to the recipient field.
PagerDuty
To set up PagerDuty, all you have to do is to provide an API key.
Note: The tags Class, Group, and Component have special meaning in the Pagerduty Common Event Format - PD-CEF. If an alert panel defines these tag keys they will be transposed to the root of the event sent to Pagerduty. This means they will be available within the Pagerduty UI and Filtering tools.
Webhook
The webhook notification is a simple way to send information about a state change over HTTP to a custom endpoint. Using this notification you could integrate Grafana into a system of your choosing.
Example json body:
{
  "dashboardId":1,
  "evalMatches":[
    {
      "value":1,
      "metric":"Count",
      "tags":{}
    }
  ],
  "imageUrl":"https://grafana.com/assets/img/blog/mixed_styles.png",
  "message":"Notification Message",
  "orgId":1,
  "panelId":2,
  "ruleId":1,
  "ruleName":"Panel Title alert",
  "ruleUrl":"http://localhost:3000/d/hZ7BuVbWz/test-dashboard?fullscreen\u0026edit\u0026tab=alert\u0026panelId=2\u0026orgId=1",
  "state":"alerting",
  "tags":{
    "tag name":"tag value"
  },
  "title":"[Alerting] Panel Title alert"
}```

- **state** - The possible values for alert state are: `ok`, `paused`, `alerting`, `pending`, `no_data`.

### DingDing/DingTalk

[Instructions in Chinese](https://open-doc.dingtalk.com/docs/doc.htm?spm=a219a.7629140.0.0.p2lr6t&treeId=257&articleId=105733&docType=1).

In DingTalk PC Client:

1. Click "more" icon on upper right of the panel.

2. Click "Robot Manage" item in the pop menu, there will be a new panel call "Robot Manage".

3. In the  "Robot Manage" panel, select "customized: customized robot with Webhook".

4. In the next new panel named "robot detail", click "Add" button.

5. In "Add Robot" panel, input a nickname for the robot and select a "message group" which the robot will join in. click "next".

6. There will be a Webhook URL in the panel, looks like this: https://oapi.dingtalk.com/robot/send?access_token=xxxxxxxxx. Copy this URL to the grafana Dingtalk setting page and then click "finish".

Dingtalk supports the following "message type": `text`, `link` and `markdown`. Only the `link` message type is supported.

### Kafka

Notifications can be sent to a Kafka topic from Grafana using the [Kafka REST Proxy](https://docs.confluent.io/1.0/kafka-rest/docs/index.html).
There are a couple of configuration options which need to be set up in Grafana UI under Kafka Settings:

1. Kafka REST Proxy endpoint.

2. Kafka Topic.

Once these two properties are set, you can send the alerts to Kafka for further processing or throttling.

### Google Hangouts Chat

Notifications can be sent by setting up an incoming webhook in Google Hangouts chat. Configuring such a webhook is described [here](https://developers.google.com/hangouts/chat/how-tos/webhooks).

### Squadcast

Squadcast helps you get alerted via Phone call, SMS, Email and Push notifications and lets you take actions on those alerts. Grafana notifications can be sent to Squadcast via a simple incoming webhook. Refer the official [Squadcast support documentation](https://support.squadcast.com/docs/grafana) for configuring these webhooks.

### All supported notifiers

Name | Type | Supports images | Support alert rule tags
-----|------|---------------- | -----------------------
DingDing | `dingding` | yes, external only | no
Discord | `discord` | yes | no
Email | `email` | yes | no
Google Hangouts Chat | `googlechat` | yes, external only | no
Hipchat | `hipchat` | yes, external only | no
Kafka | `kafka` | yes, external only | no
Line | `line` | yes, external only | no
Microsoft Teams | `teams` | yes, external only | no
OpsGenie | `opsgenie` | yes, external only | yes
Pagerduty | `pagerduty` | yes, external only | yes
Prometheus Alertmanager | `prometheus-alertmanager` | yes, external only | yes
Pushover | `pushover` | yes | no
Sensu | `sensu` | yes, external only | no
Slack | `slack` | yes | no
Squadcast | `webhook` | no | no
Telegram | `telegram` | yes | no
Threema | `threema` | yes, external only | no
VictorOps | `victorops` | yes, external only | no
Webhook | `webhook` | yes, external only | yes

# Enable images in notifications {#external-image-store}

Grafana can render the panel associated with the alert rule as a PNG image and include that in the notification. Read more about the requirements and how to configure image rendering [here](../../administration/image_rendering/).

Most Notification Channels require that this image be publicly accessible (Slack and PagerDuty for example). In order to include images in alert notifications, Grafana can upload the image to an image store. It currently supports
Amazon S3, Webdav, Google Cloud Storage and Azure Blob Storage. So to set that up you need to configure the [external image uploader](../../installation/configuration/#external-image-storage) in your grafana-server ini config file.

Be aware that some notifiers requires public access to the image to be able to include it in the notification. So make sure to enable public access to the images. If you're using local image uploader, your Grafana instance need to be accessible by the internet.

Notification services which need public image access are marked as 'external only'.

# Use alert rule tags in notifications {#alert-rule-tags}

> Only available in Grafana v6.3+.

Grafana can include a list of tags (key/value) in the notification.
It's called alert rule tags to contrast with tags parsed from timeseries.
It currently supports only the Prometheus Alertmanager notifier.

 This is an optional feature. You can get notifications without using alert rule tags.

# Configure the link back to Grafana from alert notifications

All alert notifications contain a link back to the triggered alert in the Grafana instance.
This url is based on the [domain](../../installation/configuration/#domain) setting in Grafana.


