Important: This documentation is about an older version. It's relevant only to the release noted, many of the features and functions have been updated or replaced. Please view the current version.
What’s New in Grafana v5.2
Grafana v5.2 brings new features, many enhancements and bug fixes. This article will detail the major new features and enhancements.
- Elasticsearch alerting it’s finally here!
- Native builds for ARM native builds of Grafana for many more platforms!
- Improved Docker image with support for docker secrets
- Security make your Grafana instance more secure
- Prometheus with alignment enhancements
- InfluxDB now supports the
modefunction - Alerting with alert notification channel type for Discord
- Dashboards & Panels with save & import enhancements
Elasticsearch alerting
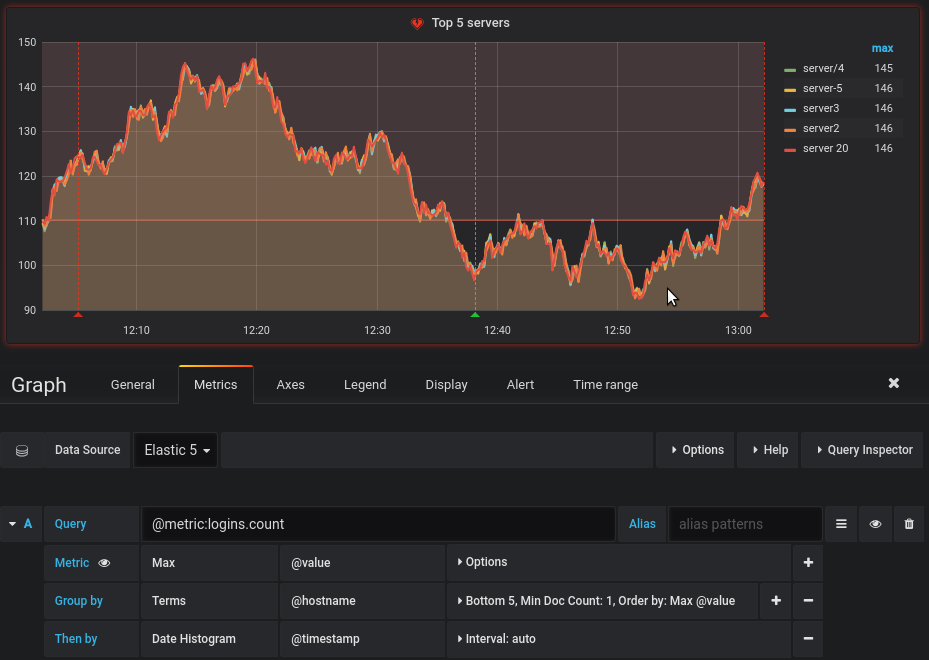
Grafana v5.2 ships with an updated Elasticsearch datasource with support for alerting. Alerting support for Elasticsearch has been one of the most requested features by our community and now it’s finally here. Please try it out and let us know what you think.
Native builds for ARM
Grafana v5.2 brings an improved build pipeline with cross-platform support. This enables native builds of Grafana for ARMv7 (x32) and ARM64 (x64). We’ve been longing for native ARM build support for ages. With the help from our amazing community this is now finally available. Please try it out and let us know what you think.
Another great addition with the improved build pipeline is that binaries for MacOS/Darwin (x64) and Windows (x64) are now automatically built and published for both stable and nightly builds.
Improved Docker image
The Grafana docker image adds support for Docker secrets which enables you to supply Grafana with configuration through files. More information in the Installing using Docker documentation.
Security
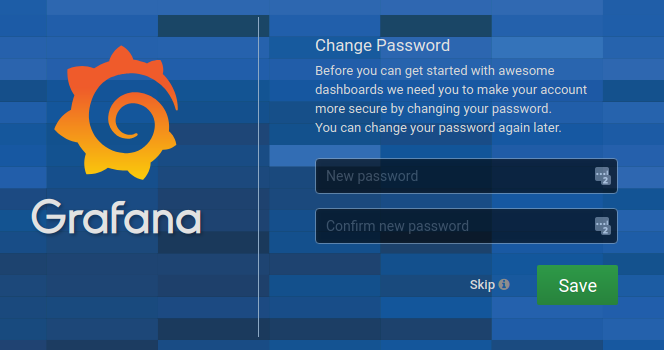
Starting from Grafana v5.2, when you login with the administrator account using the default password you’ll be presented with a form to change the password. We hope this encourages users to follow Grafana’s best practices and change the default administrator password.
Prometheus
The Prometheus datasource now aligns the start/end of the query sent to Prometheus with the step, which ensures PromQL expressions with rate functions get consistent results, and thus avoids graphs jumping around on reload.
InfluxDB
The InfluxDB datasource now includes support for the mode function which returns the most frequent value in a list of field values.
Alerting
By popular demand Grafana now includes support for an alert notification channel type for Discord.
Dashboards & Panels
Modified time range and variables are no longer saved by default
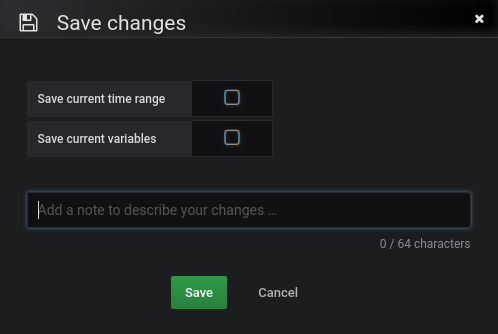
Starting from Grafana v5.2, a modified time range or variable are no longer saved by default. To save a modified time range or variable, you’ll need to actively select that when saving a dashboard, see screenshot. This should hopefully make it easier to have sane defaults for time and variables in dashboards and make it more explicit when you actually want to overwrite those settings.
Import dashboard enhancements
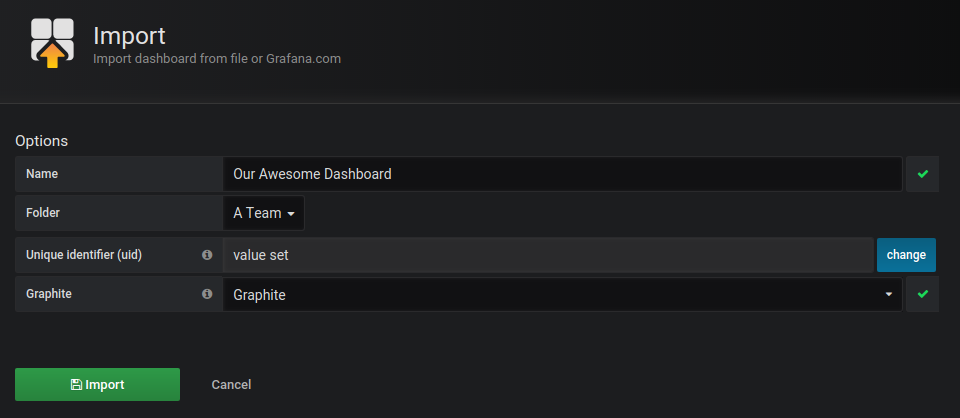
Grafana v5.2 adds support for specifying an existing folder or creating a new one when importing a dashboard - a long-awaited feature since Grafana v5.0 introduced support for dashboard folders and permissions. The import dashboard page has also got some general improvements and should now make it more clear if a possible import will overwrite an existing dashboard, or not.
This release also adds some improvements for those users only having editor or admin permissions in certain folders. The links to Create Dashboard and Import Dashboard are now available in the side navigation, in dashboard search and on the manage dashboards/folder page for a user that has editor role in an organization or the edit permission in at least one folder.
Changelog
Checkout the CHANGELOG.md file for a complete list of new features, changes, and bug fixes.


