Important: This documentation is about an older version. It's relevant only to the release noted, many of the features and functions have been updated or replaced. Please view the current version.
Alerting Engine & Rules Guide
Alerting is only available in Grafana v4.0 and above.
Introduction

Alerting in Grafana allows you to attach rules to your dashboard panels. When you save the dashboard Grafana will extract the alert rules into a separate alert rule storage and schedule them for evaluation.
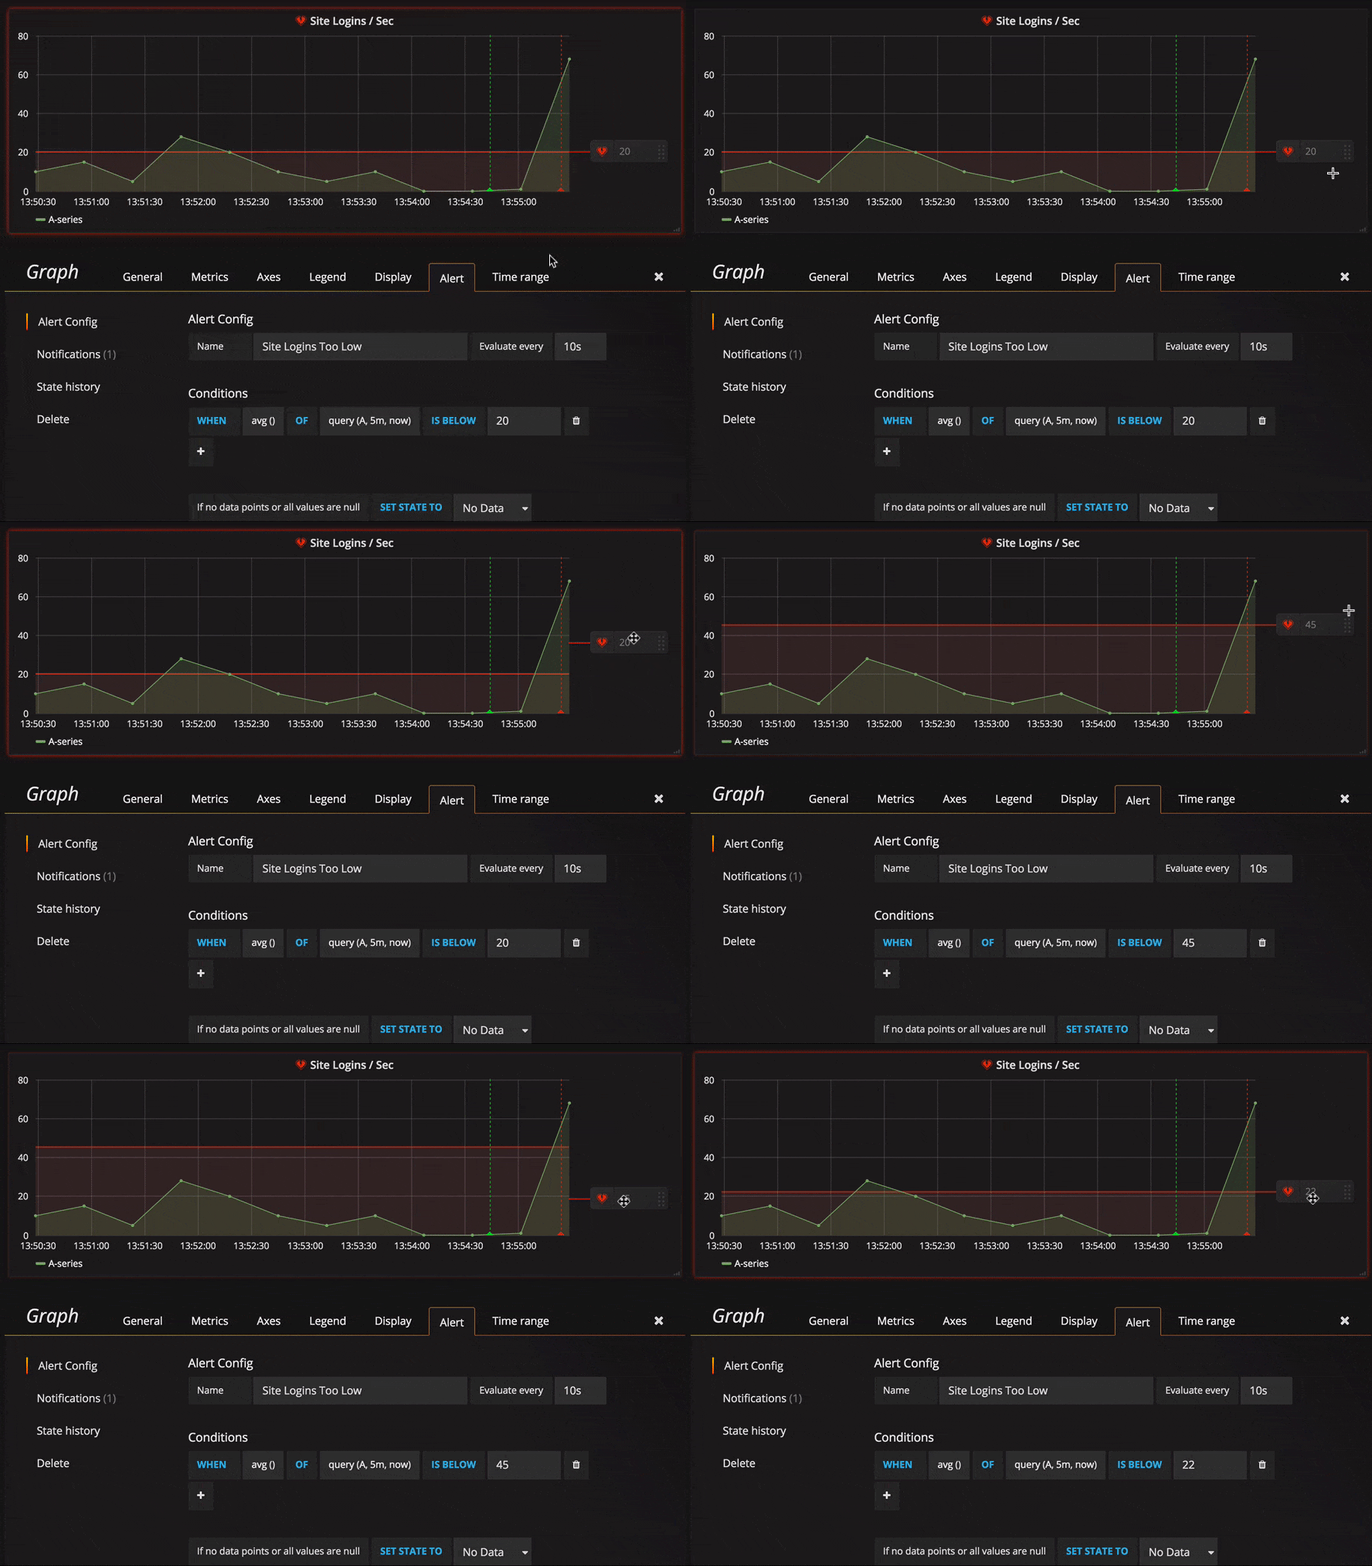
In the alert tab of the graph panel you can configure how often the alert rule should be evaluated and the conditions that need to be met for the alert to change state and trigger its notifications.
Execution
The alert rules are evaluated in the Grafana backend in a scheduler and query execution engine that is part
of core Grafana. Only some data sources are supported right now. They include Graphite, Prometheus,
InfluxDB and OpenTSDB.
Clustering
Currently alerting supports a limited form of high availability. Since v4.2.0 of Grafana, alert notifications are deduped when running multiple servers. This means all alerts are executed on every server but no duplicate alert notifications are sent due to the deduping logic. Proper load balancing of alerts will be introduced in the future.
Rule Config

Currently only the graph panel supports alert rules but this will be added to the Singlestat and Table panels as well in a future release.
Name & Evaluation interval
Here you can specify the name of the alert rule and how often the scheduler should evaluate the alert rule.
Conditions
Currently the only condition type that exists is a Query condition that allows you to
specify a query letter, time range and an aggregation function.
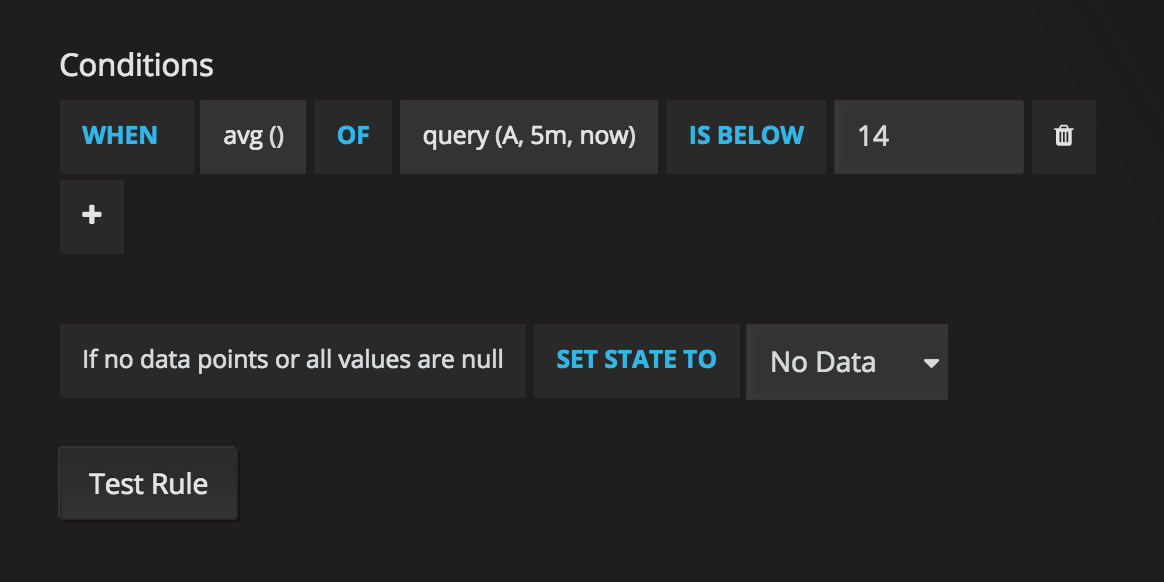
Query condition example
avg() OF query(A, 5m, now) IS BELOW 14avg()Controls how the values for each series should be reduced to a value that can be compared against the threshold. Click on the function to change it to another aggregation function.query(A, 5m, now)The letter defines what query to execute from the Metrics tab. The second two parameters define the time range,5m, nowmeans 5 minutes from now to now. You can also do10m, now-2mto define a time range that will be 10 minutes from now to 2 minutes from now. This is useful if you want to ignore the last 2 minutes of data.IS BELOW 14Defines the type of threshold and the threshold value. You can click onIS BELOWto change the type of threshold.
The query used in an alert rule cannot contain any template variables. Currently we only support AND and OR operators between conditions and they are executed serially.
For example, we have 3 conditions in the following order:
condition:A(evaluates to: TRUE) OR condition:B(evaluates to: FALSE) AND condition:C(evaluates to: TRUE)
so the result will be calculated as ((TRUE OR FALSE) AND TRUE) = TRUE.
We plan to add other condition types in the future, like Other Alert, where you can include the state
of another alert in your conditions, and Time Of Day.
Multiple Series
If a query returns multiple series then the aggregation function and threshold check will be evaluated for each series. What Grafana does not do currently is track alert rule state per series. This has implications that are detailed in the scenario below.
- Alert condition with query that returns 2 series: server1 and server2
- server1 series cause the alert rule to fire and switch to state
Alerting - Notifications are sent out with message: load peaking (server1)
- In a subsequence evaluation of the same alert rule the server2 series also cause the alert rule to fire
- No new notifications are sent as the alert rule is already in state
Alerting.
So as you can see from the above scenario Grafana will not send out notifications when other series cause the alert
to fire if the rule already is in state Alerting. To improve support for queries that return multiple series
we plan to track state per series in a future release.
No Data / Null values
Below your conditions you can configure how the rule evaluation engine should handle queries that return no data or only null values.
Execution errors or timeouts
The last option tells how to handle execution or timeout errors.
If you have an unreliable time series store from which queries sometime timeout or fail randomly you can set this option
to Keep Last State in order to basically ignore them.
Notifications
In alert tab you can also specify alert rule notifications along with a detailed messsage about the alert rule. The message can contain anything, information about how you might solve the issue, link to runbook, etc.
The actual notifications are configured and shared between multiple alerts. Read the notifications guide for how to configure and setup notifications.
Alert State History & Annotations
Alert state changes are recorded in the internal annotation table in Grafana’s database. The state changes
are visualized as annotations in the alert rule’s graph panel. You can also go into the State history
submenu in the alert tab to view & clear state history.
Troubleshooting

First level of troubleshooting you can do is hit the Test Rule button. You will get result back that you can expand to the point where you can see the raw data that was returned from your query.
Further troubleshooting can also be done by inspecting the grafana-server log. If it’s not an error or for some reason the log does not say anything you can enable debug logging for some relevant components. This is done in Grafana’s ini config file.
Example showing loggers that could be relevant when troubleshooting alerting.
[log]
filters = alerting.scheduler:debug \
          alerting.engine:debug \
          alerting.resultHandler:debug \
          alerting.evalHandler:debug \
          alerting.evalContext:debug \
          alerting.extractor:debug \
          alerting.notifier:debug \
          alerting.notifier.slack:debug \
          alerting.notifier.pagerduty:debug \
          alerting.notifier.email:debug \
          alerting.notifier.webhook:debug \
          tsdb.graphite:debug \
          tsdb.prometheus:debug \
          tsdb.opentsdb:debug \
          tsdb.influxdb:debug \
If you want to log raw query sent to your TSDB and raw response in log you also have to set grafana.ini option app_mode to
development.


