Important: This documentation is about an older version. It's relevant only to the release noted, many of the features and functions have been updated or replaced. Please view the current version.
Templating

Dashboard Templating allows you to make your Dashboards more interactive and dynamic.
They’re one of the most powerful and most used features of Grafana, and they’ve recently gotten even more attention in Grafana 2.0 and Grafana 2.1.
You can create Dashboard Template variables that can be used practically anywhere in a Dashboard: data queries on individual Panels (within the Query Editor), the names in your legends, or titles in Panels and Rows.
You can configure Dashboard Templating by clicking the dropdown cog on the top of the Dashboard while viewing it.
Variable types
There are three different types of Template variables: query, custom, and interval.
They can all be used to create dynamic variables that you can use throughout the Dashboard, but they differ in how they get the data for their values.
Query
Note: The Query type is Data Source specific. Please consult the appropriate documentation for your particular Data Source.
Query is the most common type of Template variable. Use the Query template type to generate a dynamic list of variables, simply by allowing Grafana to explore your Data Source metric namespace when the Dashboard loads.
For example a query like prod.servers.* will fill the variable with all possible values that exists in that wildcard position (in the case of the Graphite Data Source).
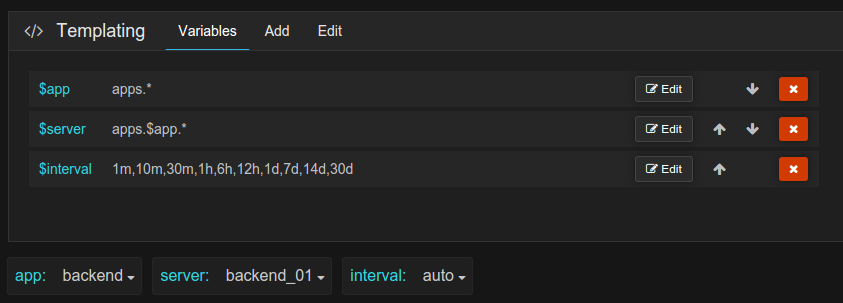
You can even create nested variables that use other variables in their definition. For example apps.$app.servers.* uses the variable $app in its own query definition.
You can utilize the special ** All ** value to allow the Dashboard user to query for every single Query variable returned. Grafana will automatically translate ** All ** into the appropriate format for your Data Source.
Multi-select
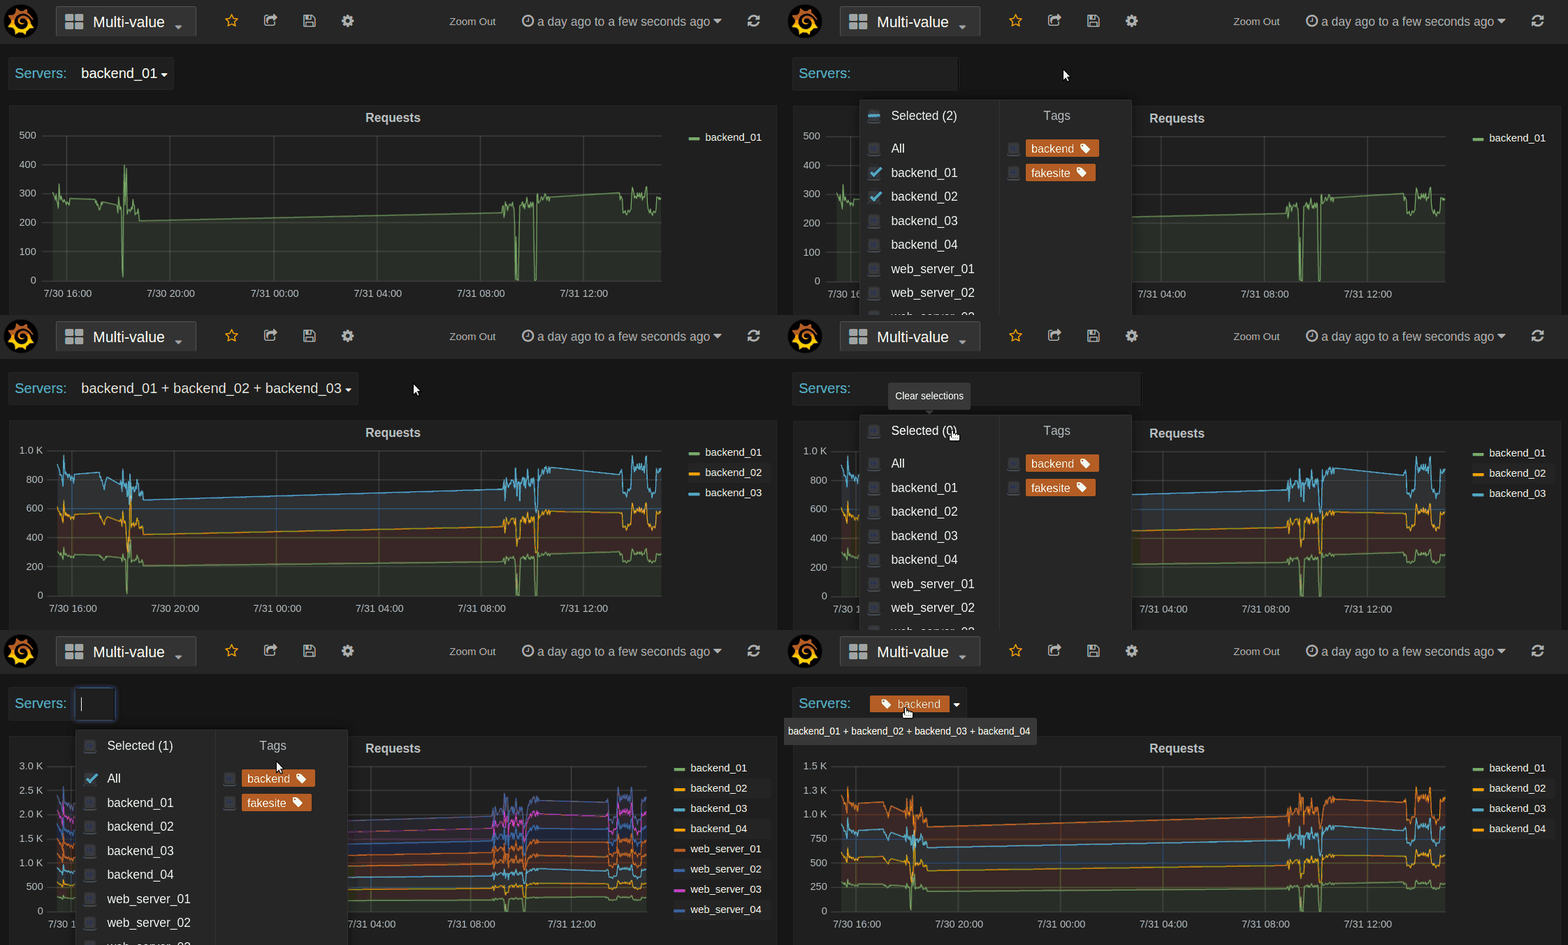
As of Grafana 2.1, it is now possible to select a subset of Query Template variables (previously it was possible to select an individual value or ‘All’, not multiple values that were less than All). This is accomplished via the Multi-Select option. If enabled, the Dashboard user will be able to enable and disable individual variables.
The Multi-Select functionality is taken a step further with the introduction of Multi-Select Tagging. This functionality allows you to group individual Template variables together under a Tag or Group name.
For example, if you were using Templating to list all 20 of your applications, you could use Multi-Select Tagging to group your applications by function or region or criticality, etc.
Note: Multi-Select Tagging functionality is currently experimental but is part of Grafana 2.1. To enable this feature click the enable icon when editing Template options for a particular variable.

Grafana gets the list of tags and the list of values in each tag by performing two queries on your metric namespace.
The Tags query returns a list of Tags.
The Tag values query returns the values for a given Tag.
Note: a proof of concept shim that translates the metric query into a SQL call is provided. This allows you to maintain your tag:value mapping independently of your Data Source.
Once configured, Multi-Select Tagging provides a convenient way to group and your template variables, and slice your data in the exact way you want. The Tags can be seen on the right side of the template pull-down.

Interval
Use the Interval type to create Template variables around time ranges (eg. 1m,1h, 1d). There is also a special auto option that will change depending on the current time range, you can specify how many times the current time range should be divided to calculate the current auto range.

Custom
Use the Custom type to manually create Template variables around explicit values that are hard-coded into the Dashboard, and not dependent on any Data Source. You can specify multiple Custom Template values by separating them with a comma.
Repeating Panels and Repeating Rows
Template Variables can be very useful to dynamically change what you’re visualizing on a given panel. Sometimes, you might want to create entire new Panels (or Rows) based on what Template Variables have been selected. This is now possible in Grafana 2.1.
Once you’ve got your Template variables (of any type) configured the way you’d like, check out the Repeating Panels and Repeating Row documentation


