Important: This documentation is about an older version. It's relevant only to the release noted, many of the features and functions have been updated or replaced. Please view the current version.
Using InfluxDB in Grafana
Grafana ships with very feature rich data source plugin for InfluxDB. Supporting a feature rich query editor, annotation and templating queries.
Adding the data source

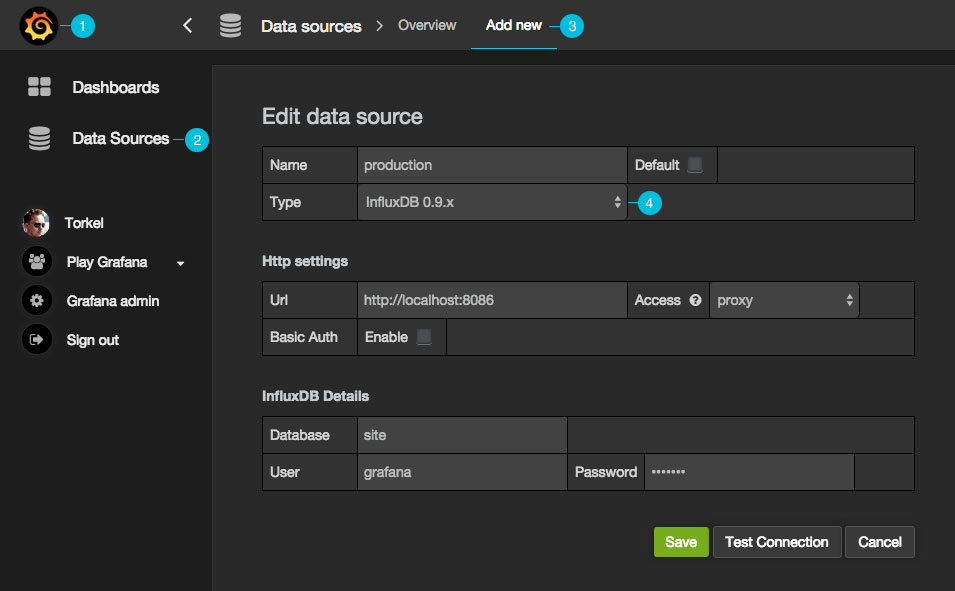
Open the side menu by clicking the the Grafana icon in the top header.
In the side menu under the
Dashboardslink you should find a link namedData Sources.NOTE: If this link is missing in the side menu it means that your current user does not have the
Adminrole for the current organization.Click the
Add newlink in the top header.Select
InfluxDB 0.9.xorInfluxDB 0.8.xfrom the dropdown.
Proxy access means that the Grafana backend will proxy all requests from the browser, and send them on to the Data Source. This is useful because it can eliminate CORS (Cross Origin Site Resource) issues, as well as eliminate the need to disseminate authentication details to the Data Source to the browser.
Direct access is still supported because in some cases it may be useful to access a Data Source directly depending on the use case and topology of Grafana, the user, and the Data Source.
Query Editor

You find the InfluxDB editor in the metrics tab in Graph or Singlestat panel’s edit mode. You enter edit mode by clicking the panel title, then edit. The editor allows you to select metrics and tags.
Filter data (WHERE)
To add a tag filter click the plus icon to the right of the WHERE condition. You can remove tag filters by clicking on
the tag key and select --remove tag filter--.
Regex matching
You can type in regex patterns for metric names or tag filter values, be sure to wrap the regex pattern in forward slashes (/). Grafana
will automatically adjust the filter tag condition to use the InfluxDB regex match condition operator (=~).
Field & Aggregation functions
In the SELECT row you can specify what fields and functions you want to use. If you have a
group by time you need an aggregation function. Some functions like derivative require an aggregation function.
The editor tries simplify and unify this part of the query. For example:
![]()
The above will generate the following InfluxDB SELECT clause:
SELECT derivative(mean("value"), 10s) /10 AS "REQ/s" FROM ....Select multiple fields
Use the plus button and select Field > field to add another SELECT clause. You can also
specify an asterix * to select all fields.
Group By
To group by a tag click the plus icon at the end of the GROUP BY row. Pick a tag from the dropdown that appears.
You can remove the group by by clicking on the tag and then click on the x icon.
Text Editor Mode (RAW)
You can switch to raw query mode by clicking hamburger icon and then Switch editor mode.
If you use Raw Query be sure your query at minimum have
WHERE $timeFilterAlso please always have a group by time and an aggregation function, otherwise InfluxDB can easily return hundreds of thousands of data points that will hang the browser.
Alias patterns
- $m = replaced with measurement name
- $measurement = replaced with measurement name
- $col = replaced with column name
- $tag_hostname = replaced with the value of the hostname tag
- You can also use [[tag_hostname]] pattern replacement syntax
Table query / raw data

You can remove the group by time by clicking on the time part and then the x icon. You can
change the option Format As to Table if you want to show raw data in the Table panel.
Templating
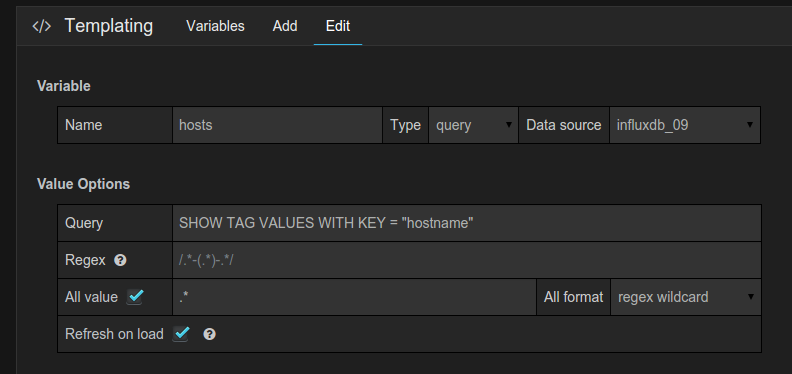
You can create a template variable in Grafana and have that variable filled with values from any InfluxDB metric exploration query. You can then use this variable in your InfluxDB metric queries.
For example you can have a variable that contains all values for tag hostname if you specify a query like this
in the templating edit view.
SHOW TAG VALUES WITH KEY = "hostname"You can also create nested variables. For example if you had another variable, for example region. Then you could have
the hosts variable only show hosts from the current selected region with a query like this:
SHOW TAG VALUES WITH KEY = "hostname" WHERE region =~ /$region/Always use
regex valuesorregex wildcardfor All format or multi select format.

Annotations
Annotations allows you to overlay rich event information on top of graphs.
An example query:
SELECT title, description from events WHERE $timeFilter order asc


