
Important: This documentation is about an older version. It's relevant only to the release noted, many of the features and functions have been updated or replaced. Please view the current version.
Using AWS CloudWatch in Grafana
Grafana ships with built in support for CloudWatch. You just have to add it as a data source and you will be ready to build dashboards for you CloudWatch metrics.
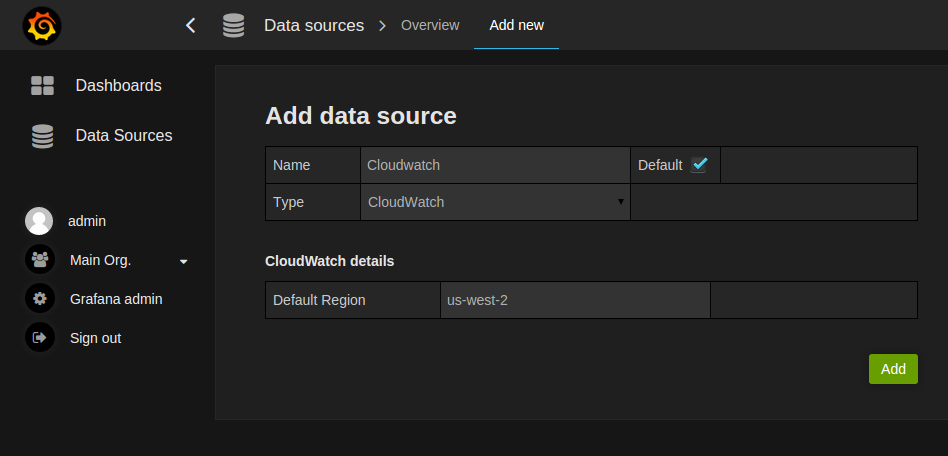
Adding the data source
Open the side menu by clicking the the Grafana icon in the top header.
In the side menu under the
Dashboardslink you should find a link namedData Sources.NOTE: If this link is missing in the side menu it means that your current user does not have the
Adminrole for the current organization.Click the
Add newlink in the top header.Select
CloudWatchfrom the dropdown.NOTE: If at any moment you have issues with getting this datasource to work and grafana is giving you undescriptive errors then dont forget to check your log file (try looking in /var/log/grafana/).
Authentication
IAM Roles
Currently all access to CloudWatch is done server side by the Grafana backend using the official AWS SDK. If you grafana server is running on AWS you can use IAM Roles and authentication will be handled automatically.
Checkout AWS docs on IAM Roles
AWS credentials file
Create a file at ~/.aws/credentials. That is the HOME path for user running grafana-server.
> NOTE: If you think you have the credentials file in the right place but it is still not working then you might try moving your .aws file to ‘/usr/share/grafana/’ and make sure your credentials file has at most 0644 permissions.
Example content:
[default]
aws_access_key_id = asdsadasdasdasd
aws_secret_access_key = dasdasdsadasdasdasdsa
region = us-west-2
Metric Query Editor
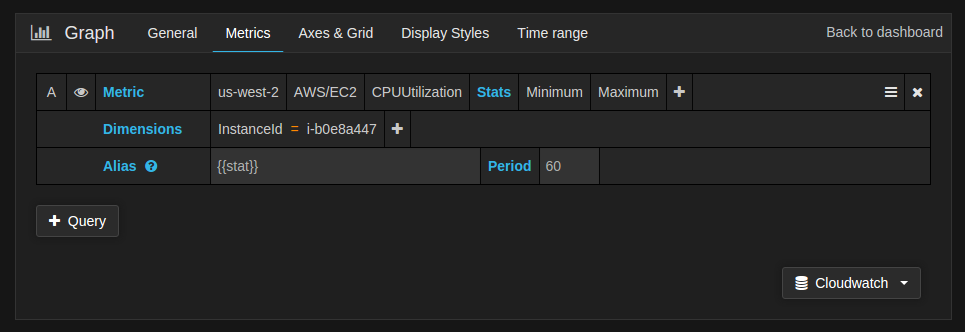
You need to specify a namespace, metric, at least one stat, and at least one dimension.
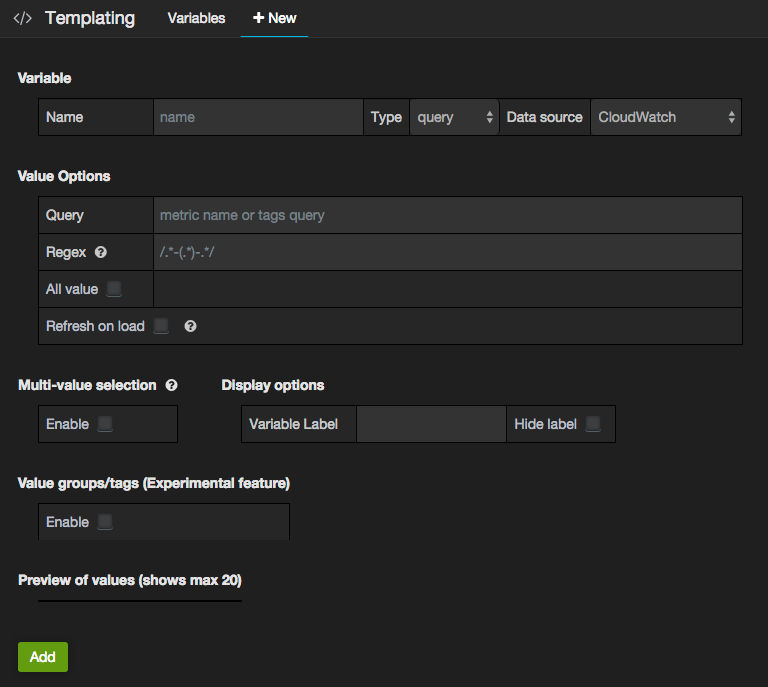
Templated queries
CloudWatch Datasource Plugin provides the following functions in Variables values query field in Templating Editor to query region, namespaces, metric names and dimension keys/values on the CloudWatch.
For details about the metrics CloudWatch provides, please refer to the CloudWatch documentation.
Example templated Queries
Example dimension queries which will return list of resources for individual AWS Services:
ec2_instance_attribute JSON filters
The ec2_instance_attribute query take filters in JSON format.
You can specify pre-defined filters of ec2:DescribeInstances.
Specify like { filter_name1: [ filter_value1 ], filter_name2: [ filter_value2 ] }
Example ec2_instance_attribute() query
ec2_instance_attribute(us-east-1, InstanceId, { "tag:Environment": [ "production" ] })
Cost
Amazon provides 1 million CloudWatch API requests each month at no additional charge. Past this, it costs $0.01 per 1,000 GetMetricStatistics or ListMetrics requests. For each query Grafana will issue a GetMetricStatistics request and every time you pick a dimension in the query editor Grafana will issue a ListMetrics request.


