Important: This documentation is about an older version. It's relevant only to the release noted, many of the features and functions have been updated or replaced. Please view the current version.
Welcome to Grafana 12.2! This release focuses on making it easier to gain insights from your data.
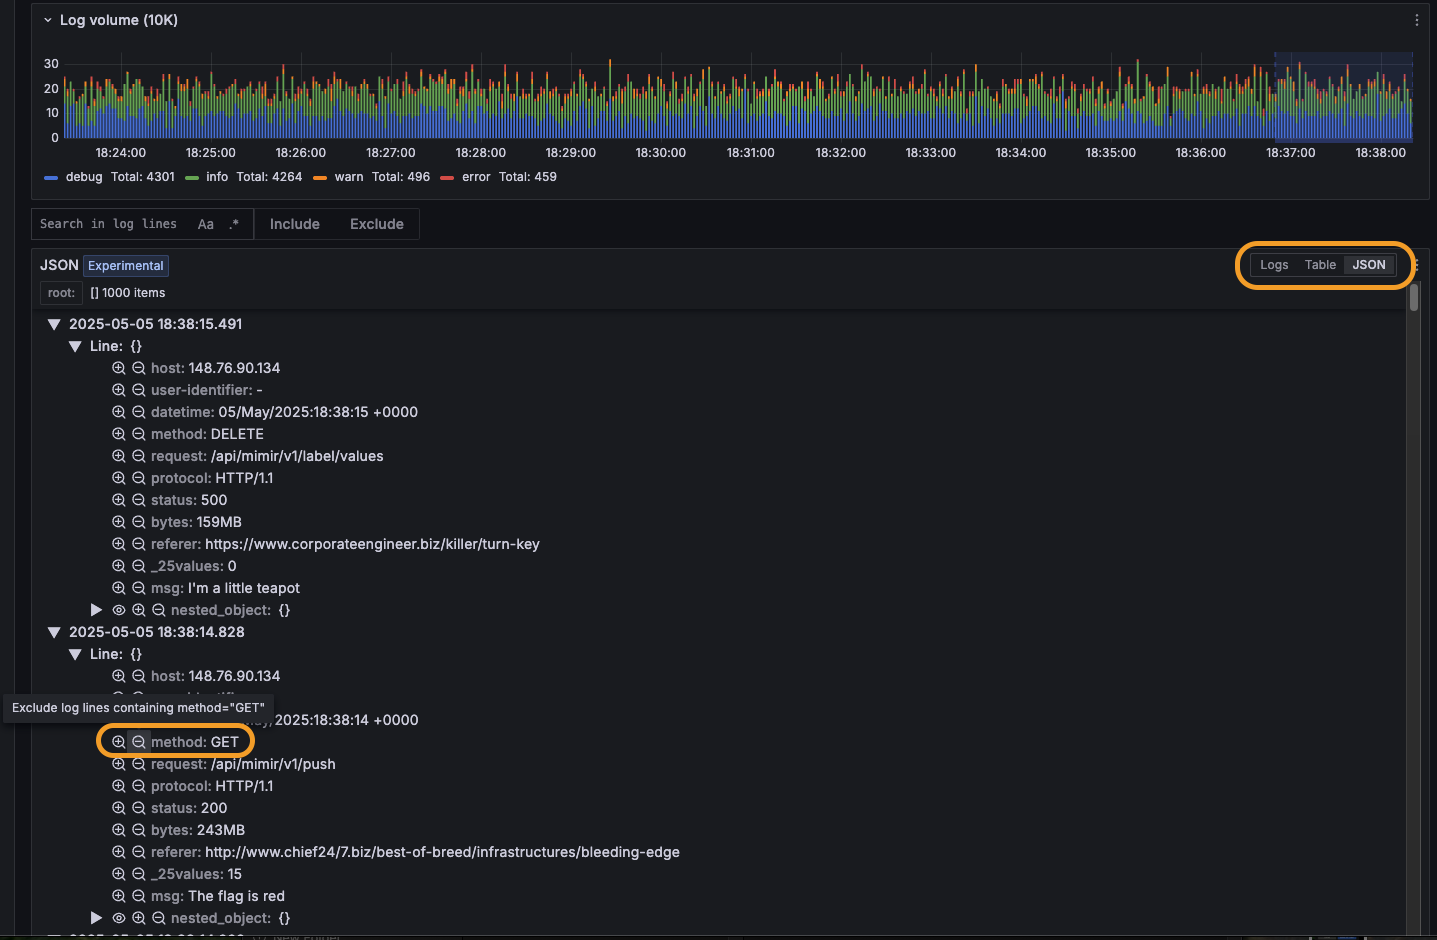
We’re excited to announce several features are now GA. Enhanced ad hoc filtering transforms your dashboards into true command centers, allowing you to slice and dice datasets on the fly. The redesigned table visualization offers improved performance and visual aids for quick pattern and anomaly identification, helping you make faster decisions. The Logs Drilldown JSON viewer makes intimidating log structures organized and explorable. Metrics Drilldown now integrates with alert creation in Grafana, so you can explore Prometheus data with intuitive point-and-click interactions, find the right visualization, and easily use its query in your alert rule.
We’re also collecting feedback on some new public preview features. AI-powered SQL expressions eliminate the barrier between questions and answers by generating SQL queries from natural language and providing instant explanations for existing queries. Our enhanced Canvas Pan and Zoom experience lets you design complex dashboards exactly as you envision them.
Keep reading to learn more about everything 12.2 has in store.
For even more detail about all the changes in this release, refer to the changelog. For the specific steps we recommend when you upgrade to v12.2, check out our
Upgrade Guide.
Grafana CloudAvailable in public previewOpen sourceEnterpriseAvailable in public preview
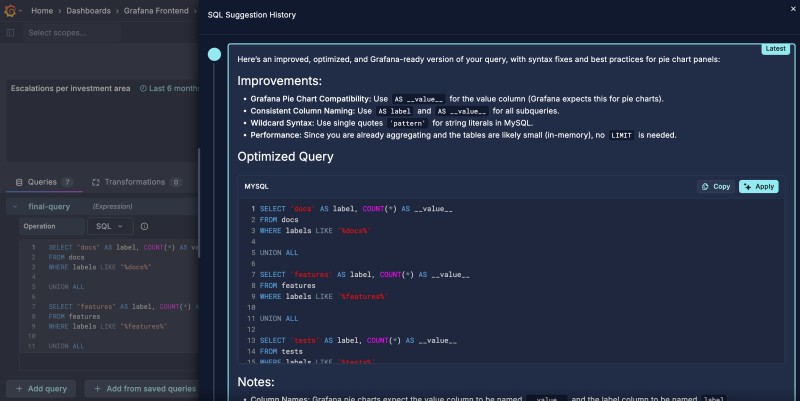
Grafana SQL Expressions, Grafana’s solution for manipulating and transforming the results of data source queries using SQL (MySQL dialect) syntax, is now available in Public Preview.
Grafana CloudGenerally AvailableOpen sourceEnterpriseGenerally Available
Dashboards and visualizations
In May 2025, we refactored the table visualization to use the react-data-grid library, resulting in significant performance improvements. We released this in public preview. Now, this version of the table is generally available, and along with that, we’ve made a number of improvements, big and small. We’ve added the following options:
Grafana CloudGenerally AvailableOpen sourceEnterpriseGenerally Available
Dashboards and visualizations
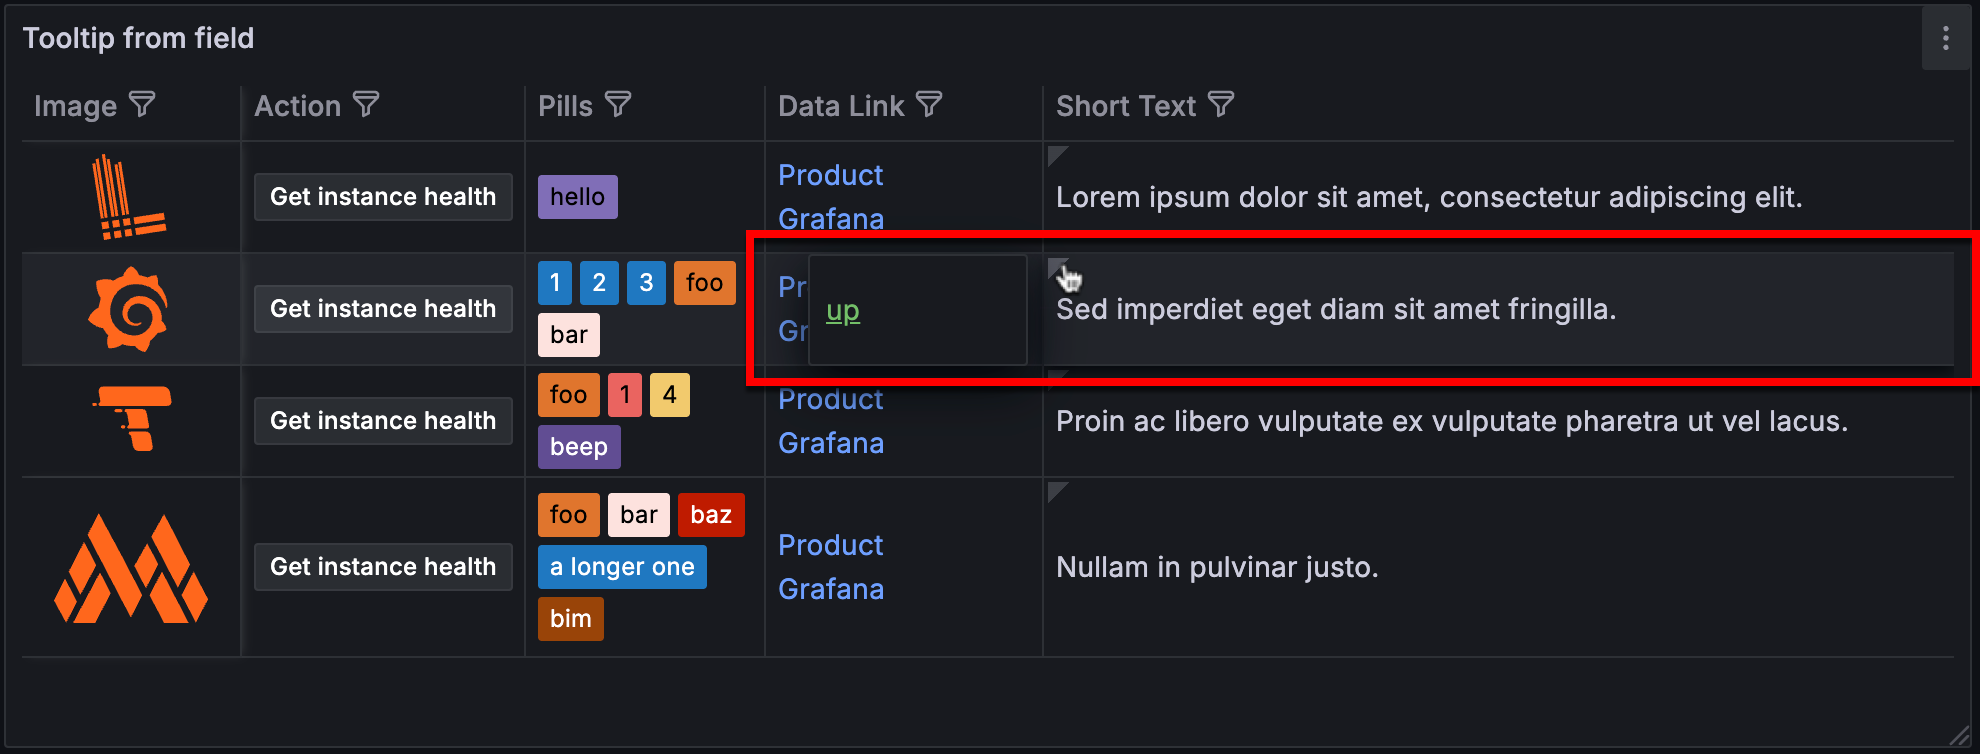
The Tooltip from field option in table visualizations allows you to use the values from another field (or column) in a tooltip.
When you toggle the switch on, you can select from a drop-down list any of the fields in the table to be used as the source of the tooltip content. All table fields are available for selection, whether visible or hidden.
Grafana CloudGenerally AvailableOpen sourceEnterpriseGenerally Available
Dashboards and visualizations
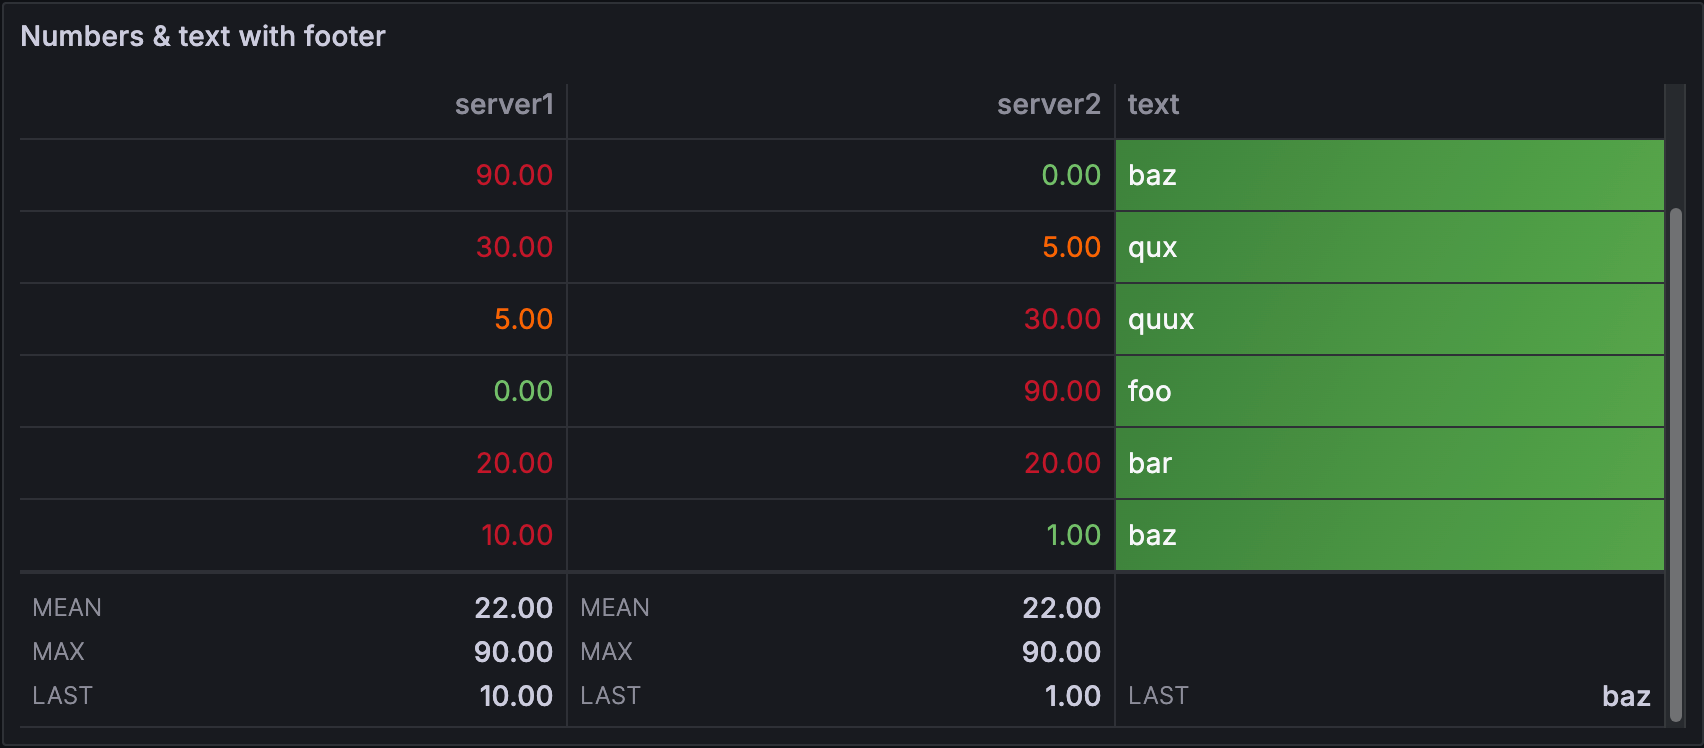
The table footer displays the results of calculations (and reducer functions) on fields. We’ve updated the footer so that you can apply multiple calculations or reducers simultaneously:
Grafana CloudGenerally AvailableOpen sourceEnterpriseGenerally Available
Dashboards and visualizations
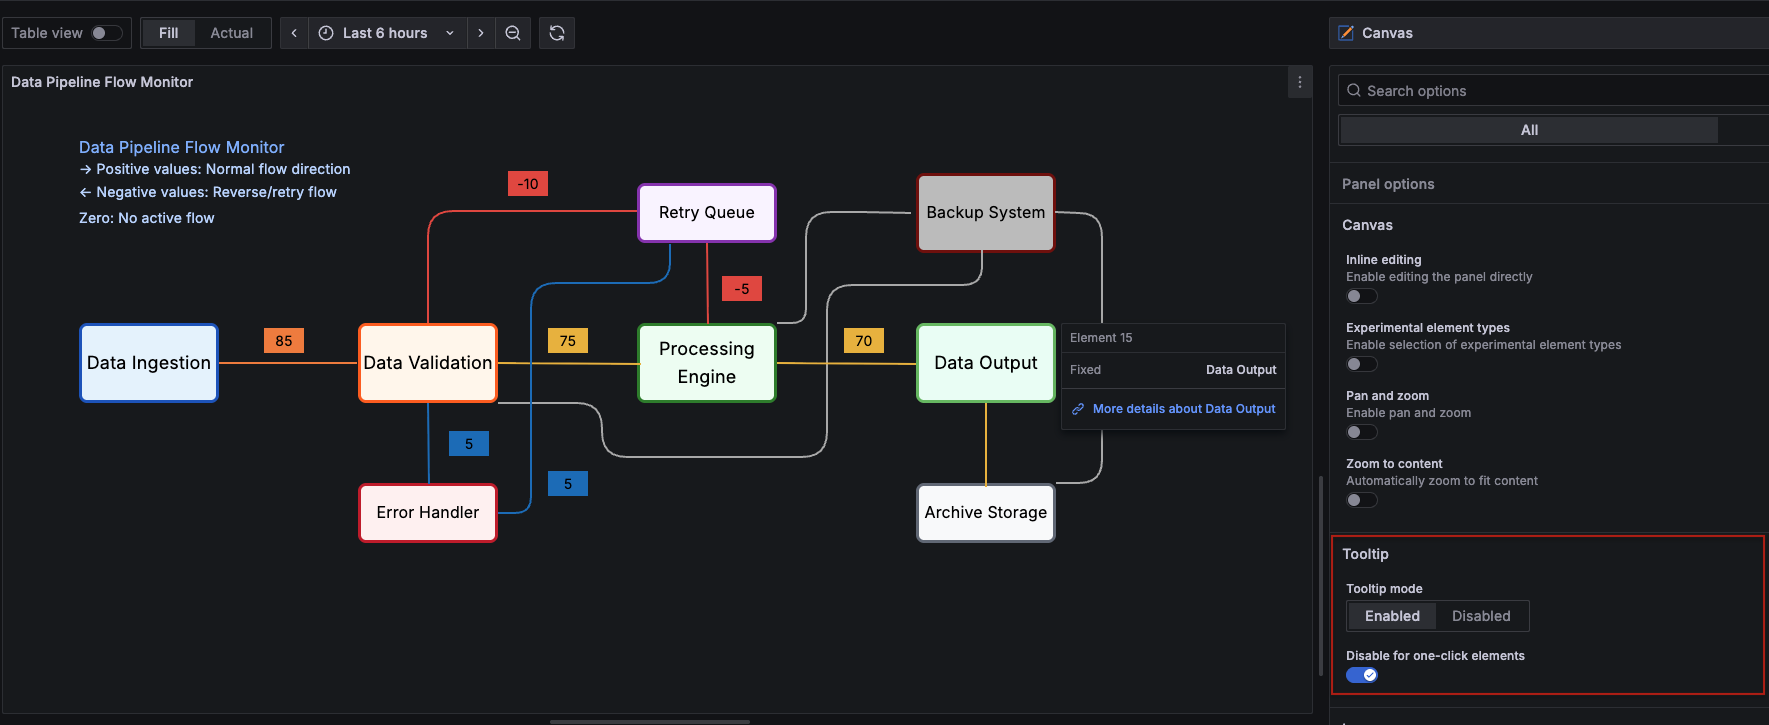
You can now choose to enable or disable tooltips in canvas visualizations. The Tooltip mode setting controls the display of tooltips when hovering over elements in a canvas that are connected to data, data links, or actions.
Grafana CloudGenerally AvailableOpen sourceEnterpriseGenerally Available
Dashboards and visualizations
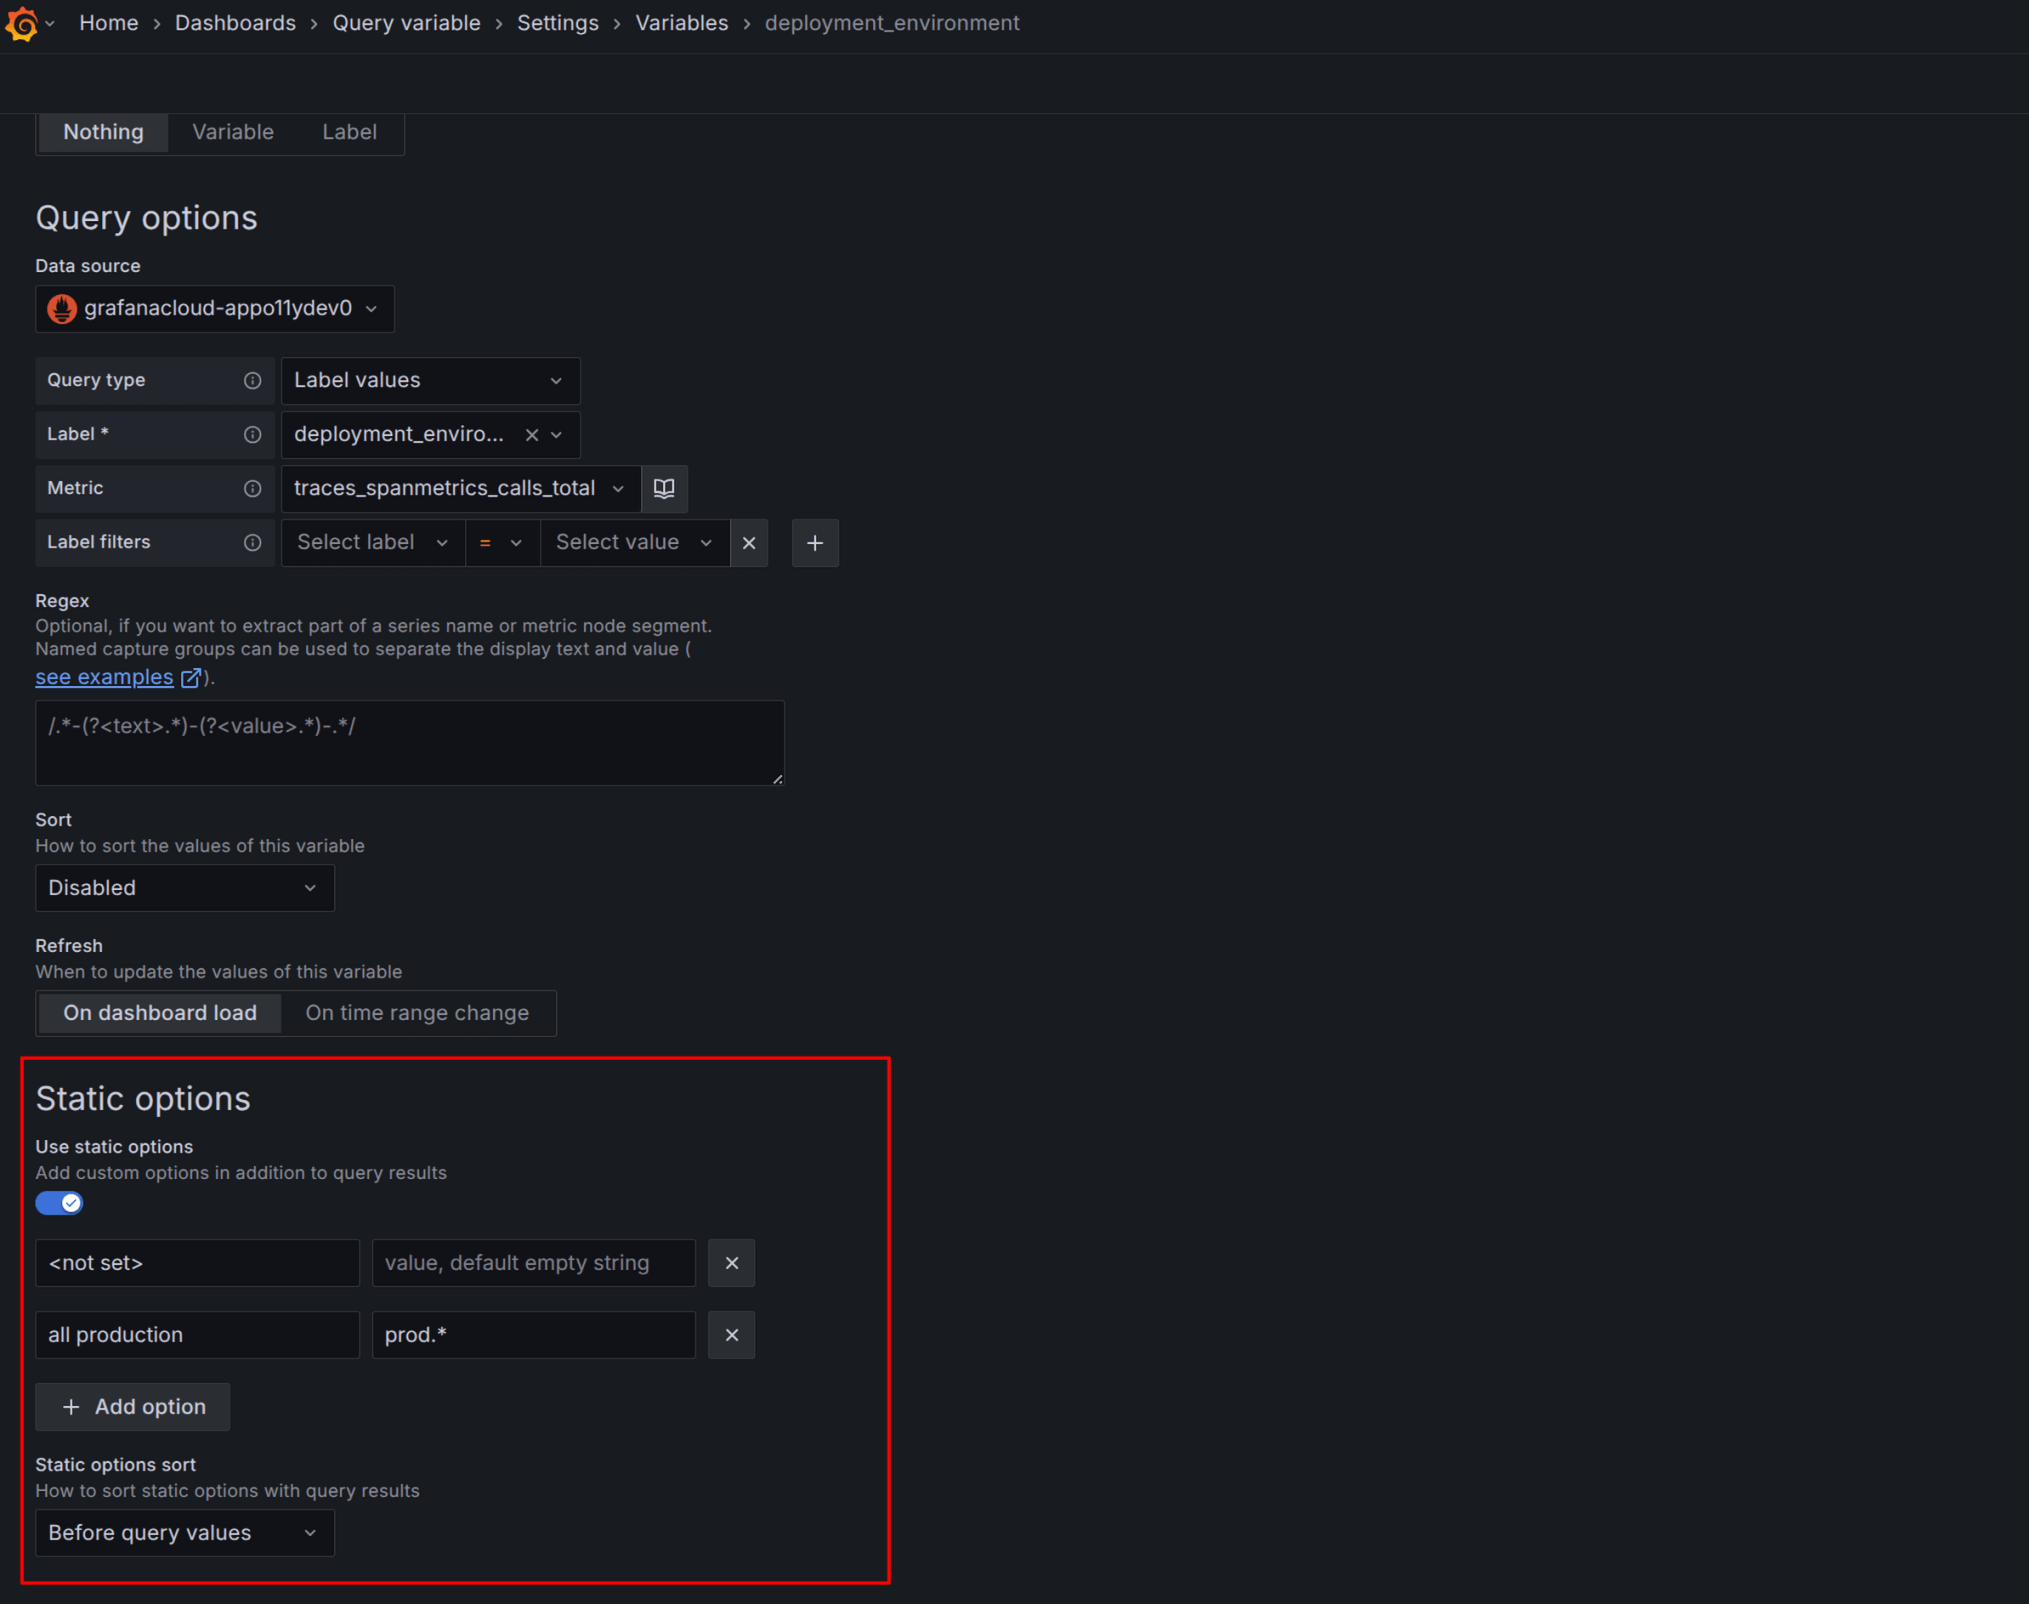
You can now define additional static options for query variables to be included with the options retrieved by querying the data source. This affords you more flexibility, allowing you to create options like “value not set” or “all clusters in Asia”.
Grafana CloudGenerally AvailableOpen sourceEnterpriseGenerally Available
Dashboards and visualizations
You can now control the direction of connections between canvas elements by mapping the direction to a field value. A positive value draws the connection arrow forward, a negative value draws it in reverse, and a value of zero removes the directional arrow entirely. Alternatively, you can assign a fixed direction value.
Grafana CloudAvailable in public previewOpen sourceEnterpriseAvailable in public preview
Dashboards and visualizations
Overview
The canvas visualization editor now offers a completely re-engineered pan and zoom experience.
You can now place elements anywhere—even beyond panel edges—without disrupting connections or layouts. Background images stay consistent, connection anchors rotate with elements, and an optional Zoom to content toggle automatically fits your canvas content to any view. Constraints remain intact thanks to a transparent root container, ensuring layout behavior stays reliable across pan and zoom operations.
Grafana CloudAvailable in public previewOpen sourceEnterpriseAvailable in public preview
Dashboards and visualizations
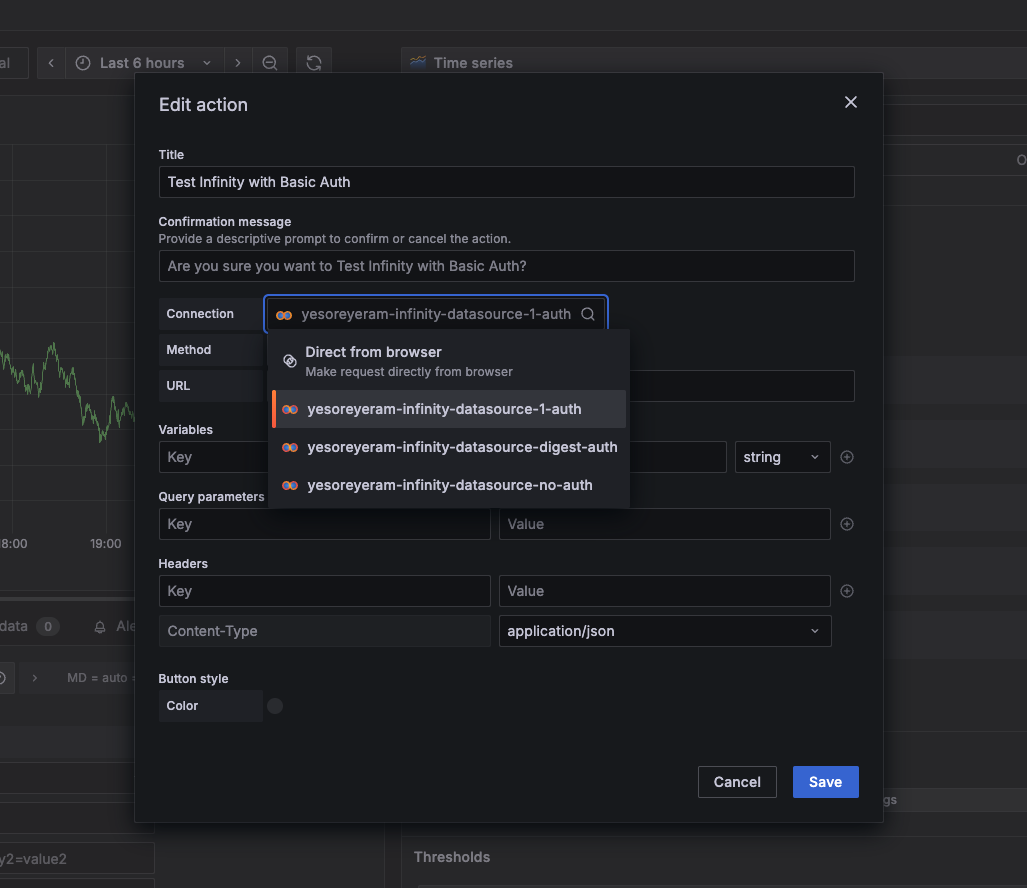
Visualization actions now support authenticated HTTP requests by integrating with the Infinity data source. This lets you perform actions that require authentication by leveraging preconfigured Infinity data source connections.
Grafana CloudGenerally AvailableOpen sourceEnterpriseGenerally Available
Dashboards and visualizations
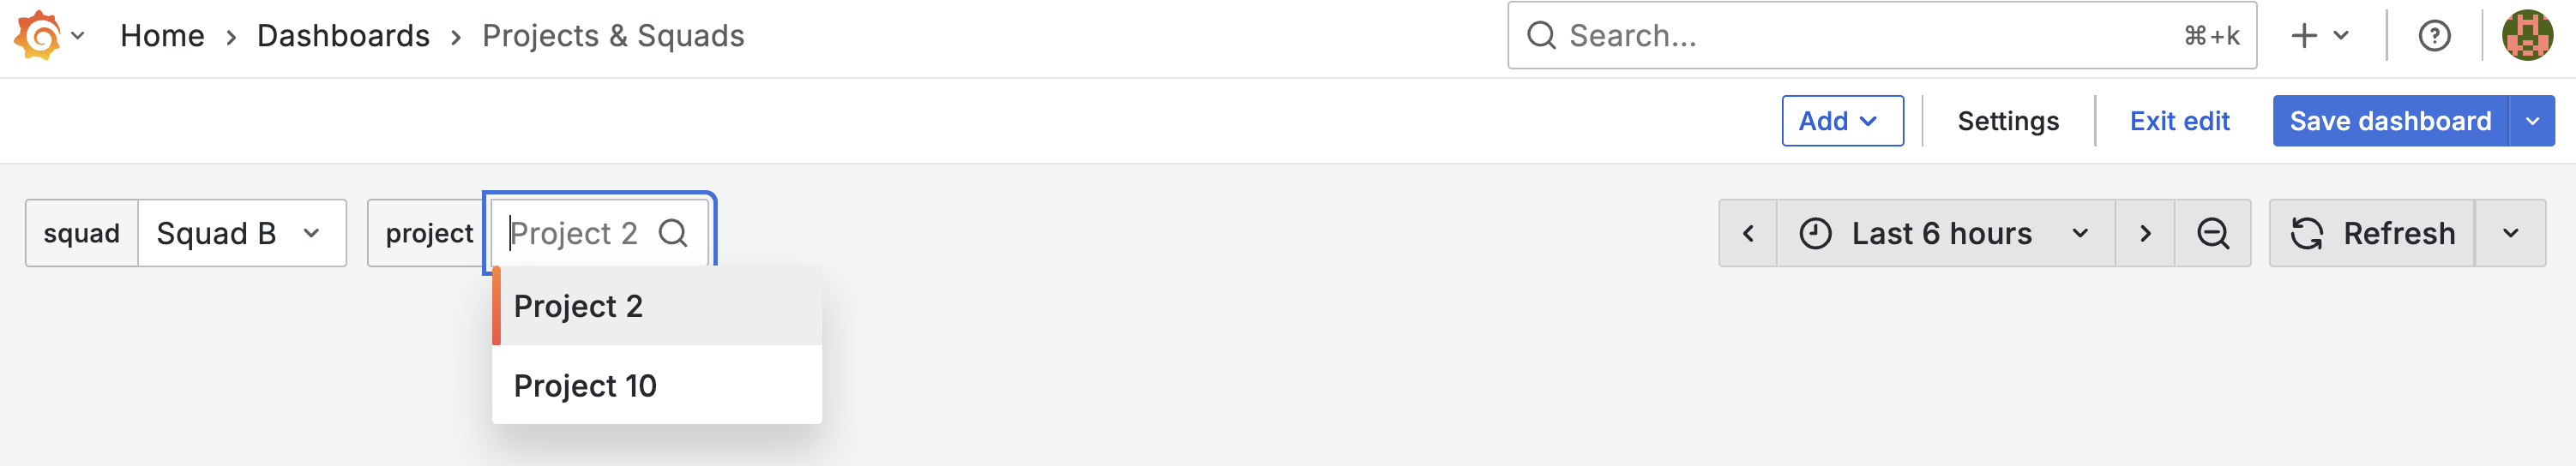
Because Ad hoc filters can’t be reliably implemented on SQL data sources, we’re introducing a new way forward. Starting with this release, you can now query a dataset from a first panel using a SQL data source, then build the rest of your dashboard on top of that dataset—and use ad hoc filters to drill into it.
Grafana CloudGenerally AvailableOpen sourceEnterpriseGenerally Available
Dashboards and visualizations
With this release, we’re rethinking our dashboard APIs and making the default a new model that is consistent, versioned, and resource-oriented.
We started the rollout in May. Since then, we’ve gathered feedback, measured impact, and improved testing. We’re now confident the APIs are stable and have made them the default.
Grafana CloudAvailable in public previewEnterpriseAvailable in public preview
Dashboards and visualizationsReporting
We’ve redesigned the Reporting feature to make the report creation process simpler and more intuitive!
Key updates include:
Creating reports from dashboards while maintaining dashboard context
One-page report creation
Easy access to organization report settings
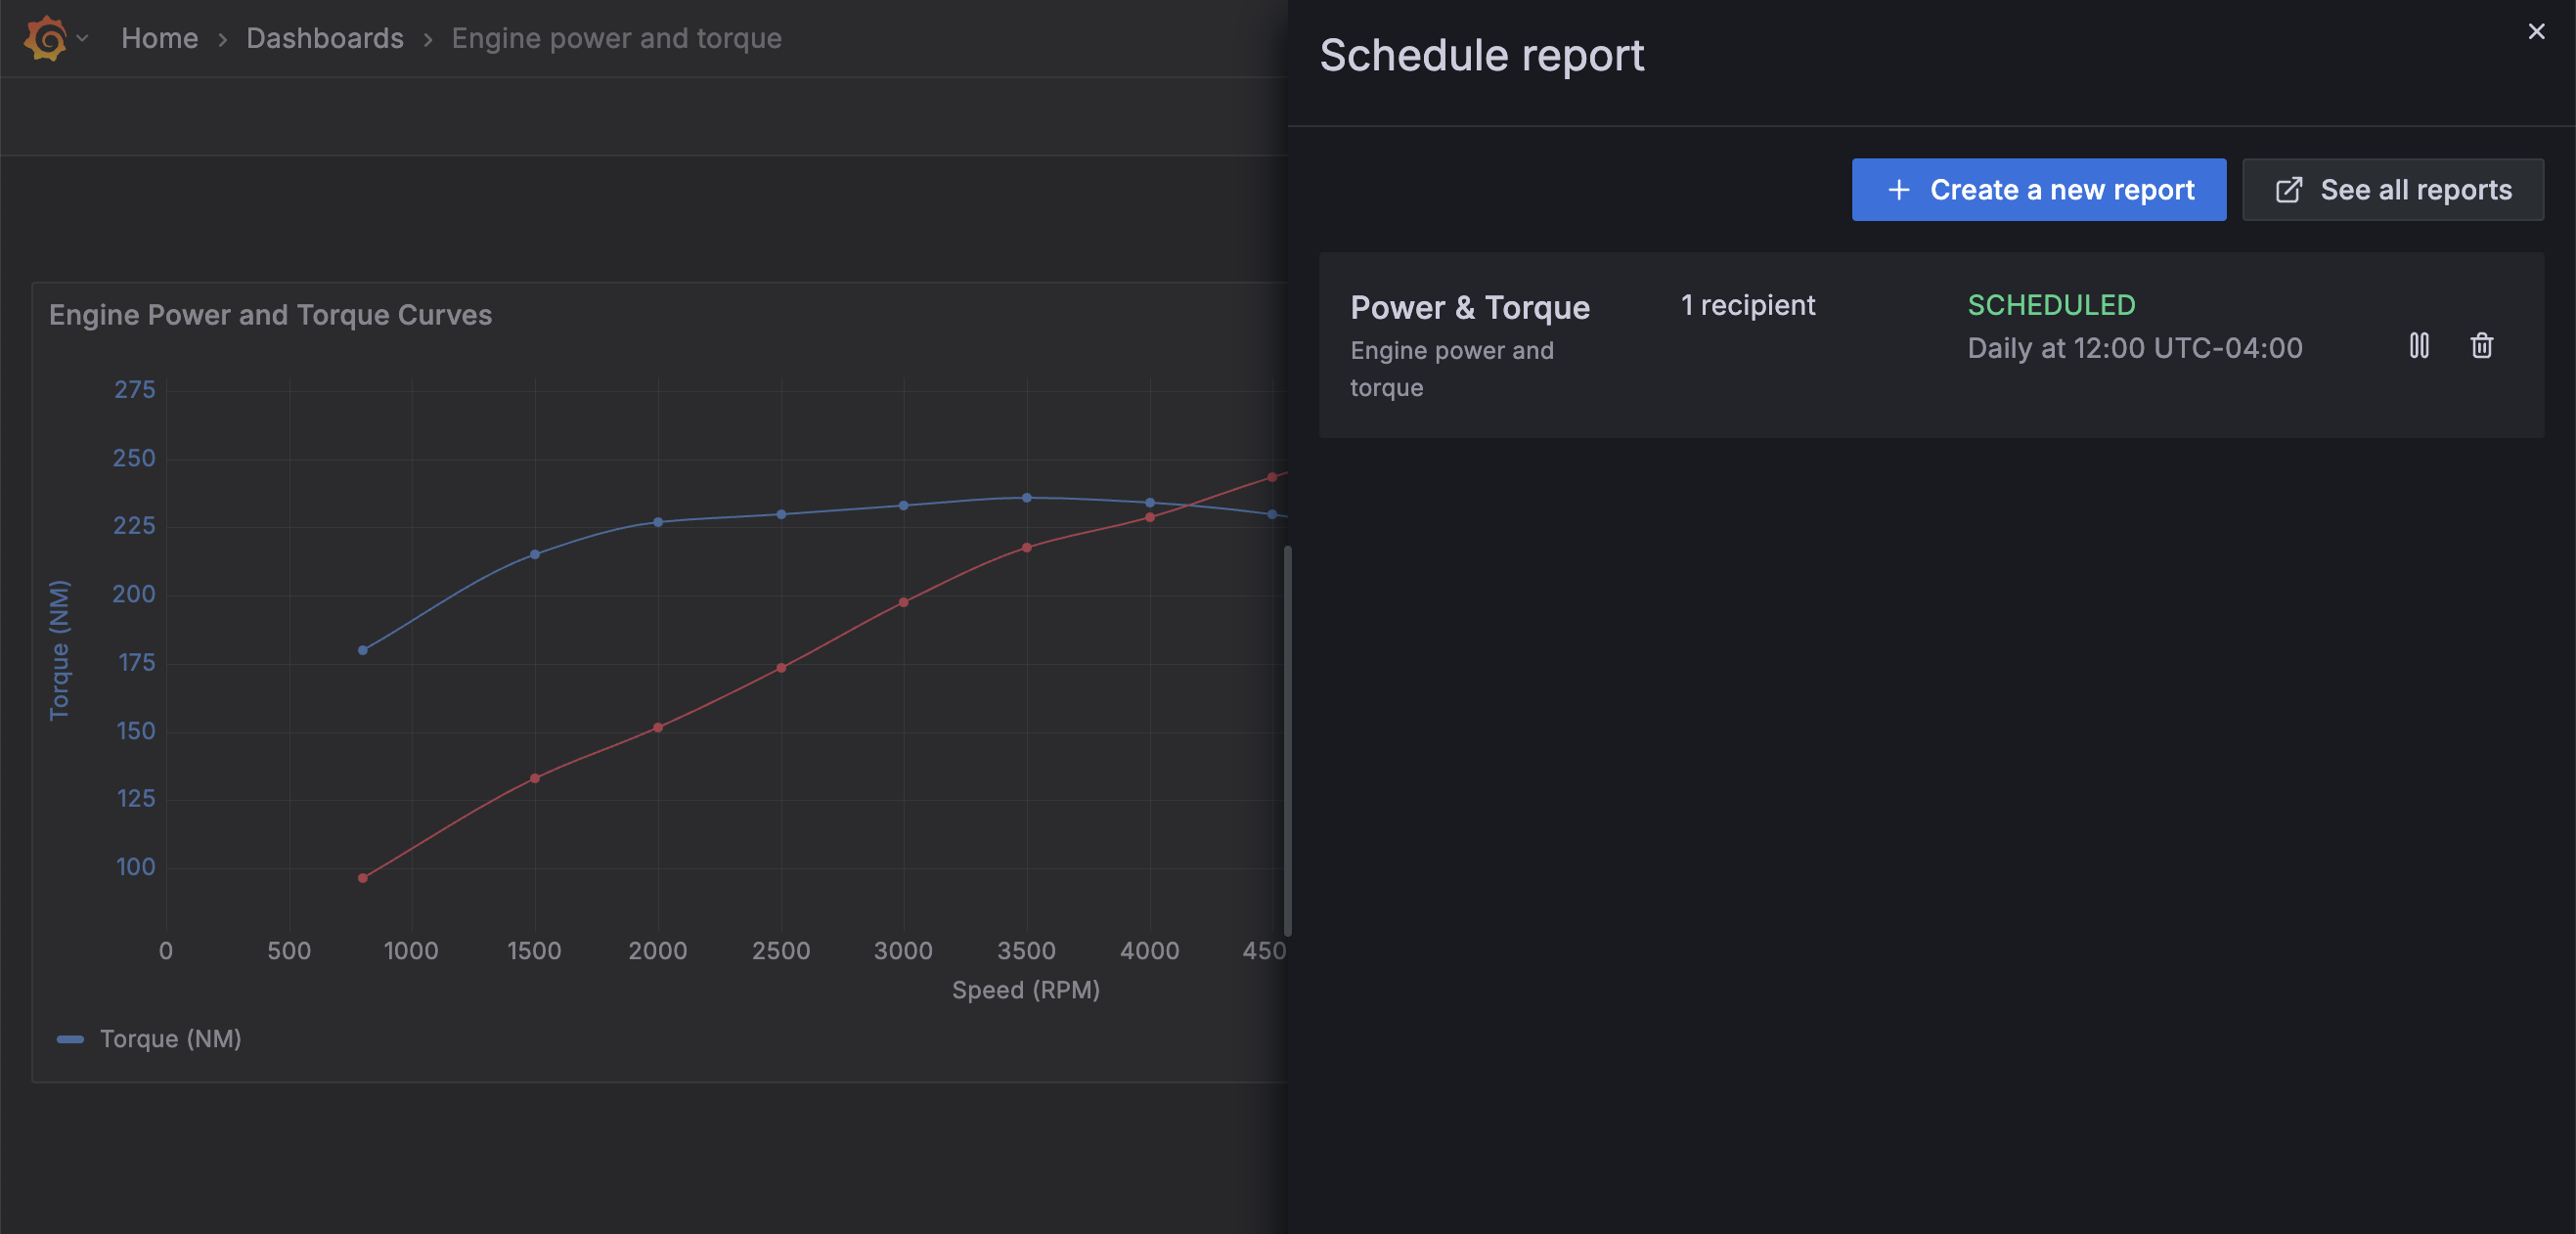
When you click Share > Schedule report from a dashboard, a drawer opens where you can complete the entire report form. With this change, you’re no longer taken out of the dashboard, but instead maintain your original context. If other reports include this dashboard, they are also listed in the drawer, helping to reduce duplication of efforts.
Grafana CloudAvailable in public previewEnterpriseAvailable in public preview
PluginsData sources
The Jenkins data source allows you to query and visualize metrics such as projects, builds, build queues, nodes and load statistics from within Grafana.
This enterprise plugin includes two built-in dashboards to help you quickly get started visualizing Jenkins data:
Grafana CloudGenerally AvailableOpen sourceEnterpriseGenerally Available
Data sourcesDashboards and visualizations
The Google Sheets data source just got more powerful! Our 2.2.0 release adds support for template variables, making it easier to build interactive and adaptable dashboards directly from your spreadsheets.
Grafana CloudAvailable in public previewEnterpriseAvailable in public preview
ExploreDashboards and visualizations
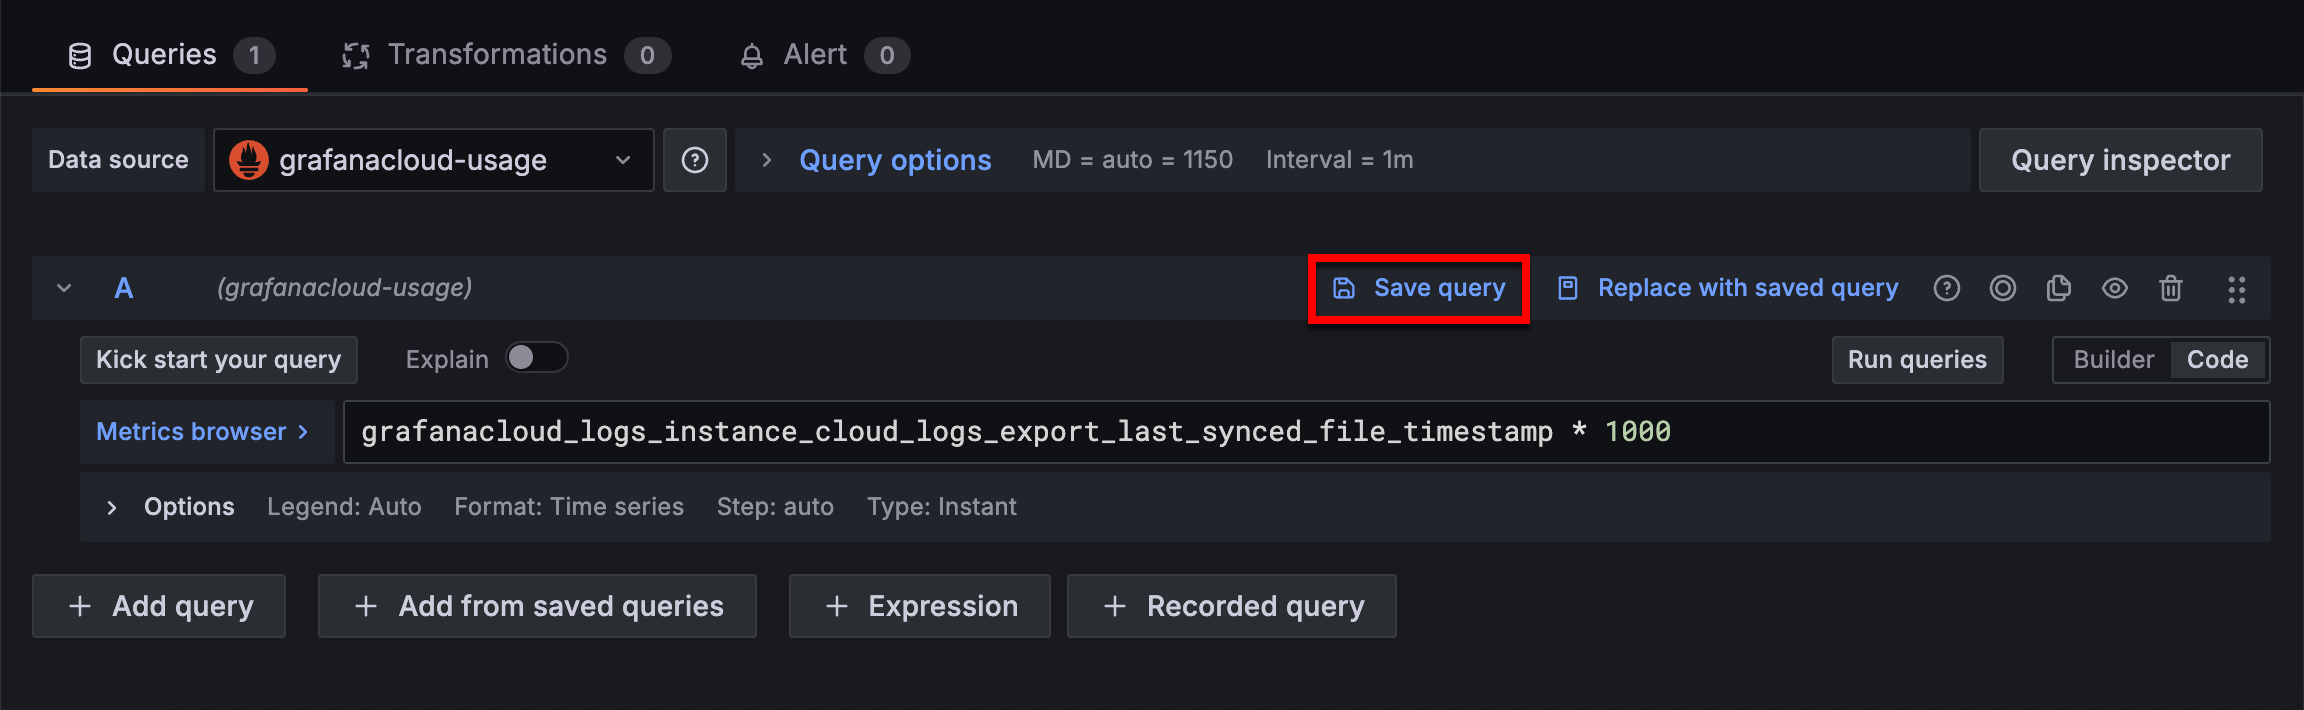
We’ve introduced the ability to save queries in Dashboards and Explore! With this addition, you can save and reuse queries, as well as share them with others in your organization.
Grafana CloudGenerally AvailableOpen sourceEnterpriseGenerally Available
Metrics Drilldown
Using queryless experience of Metrics Drilldown to build an Alert Rule
The Challenge:
Creating effective alert rules often requires knowing exactly what query to write upfront. But sometimes you need to explore your data first — understanding how metrics behave across different label combinations, spotting patterns, and building confidence in your monitoring approach before committing to an alert rule.
Grafana CloudGenerally AvailableOpen sourceEnterpriseGenerally Available
Translate your plugin
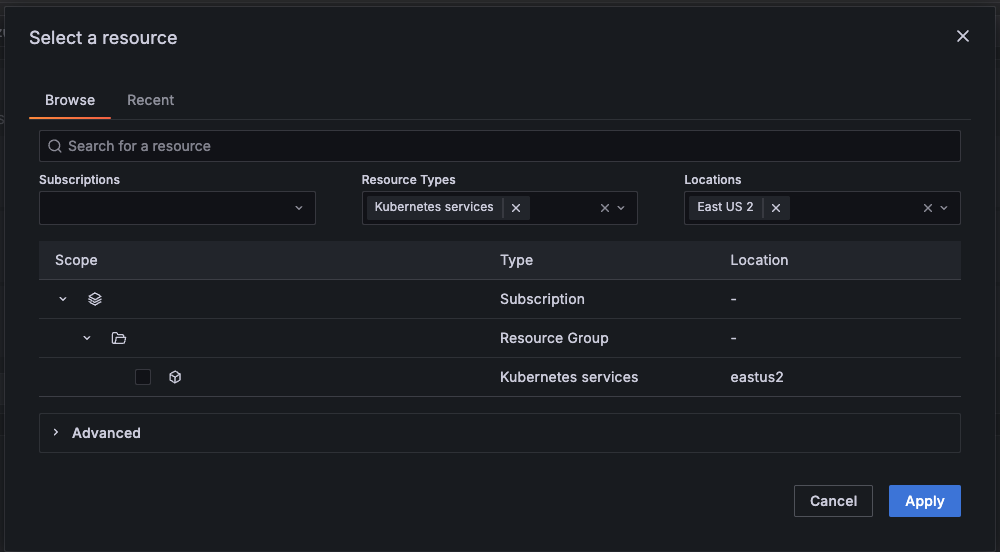
Internationalization of plugins is here! You can now make your plugin more user-friendly by translating it into multiple languages. You can find the list of available languages in GitHub, and how to translate plugins in our docs page. For Microsoft users, we’ve added translations to MS SQL and Azure Monitor data sources.
Grafana CloudAvailable in public previewEnterpriseAvailable in public preview
Authentication and authorization
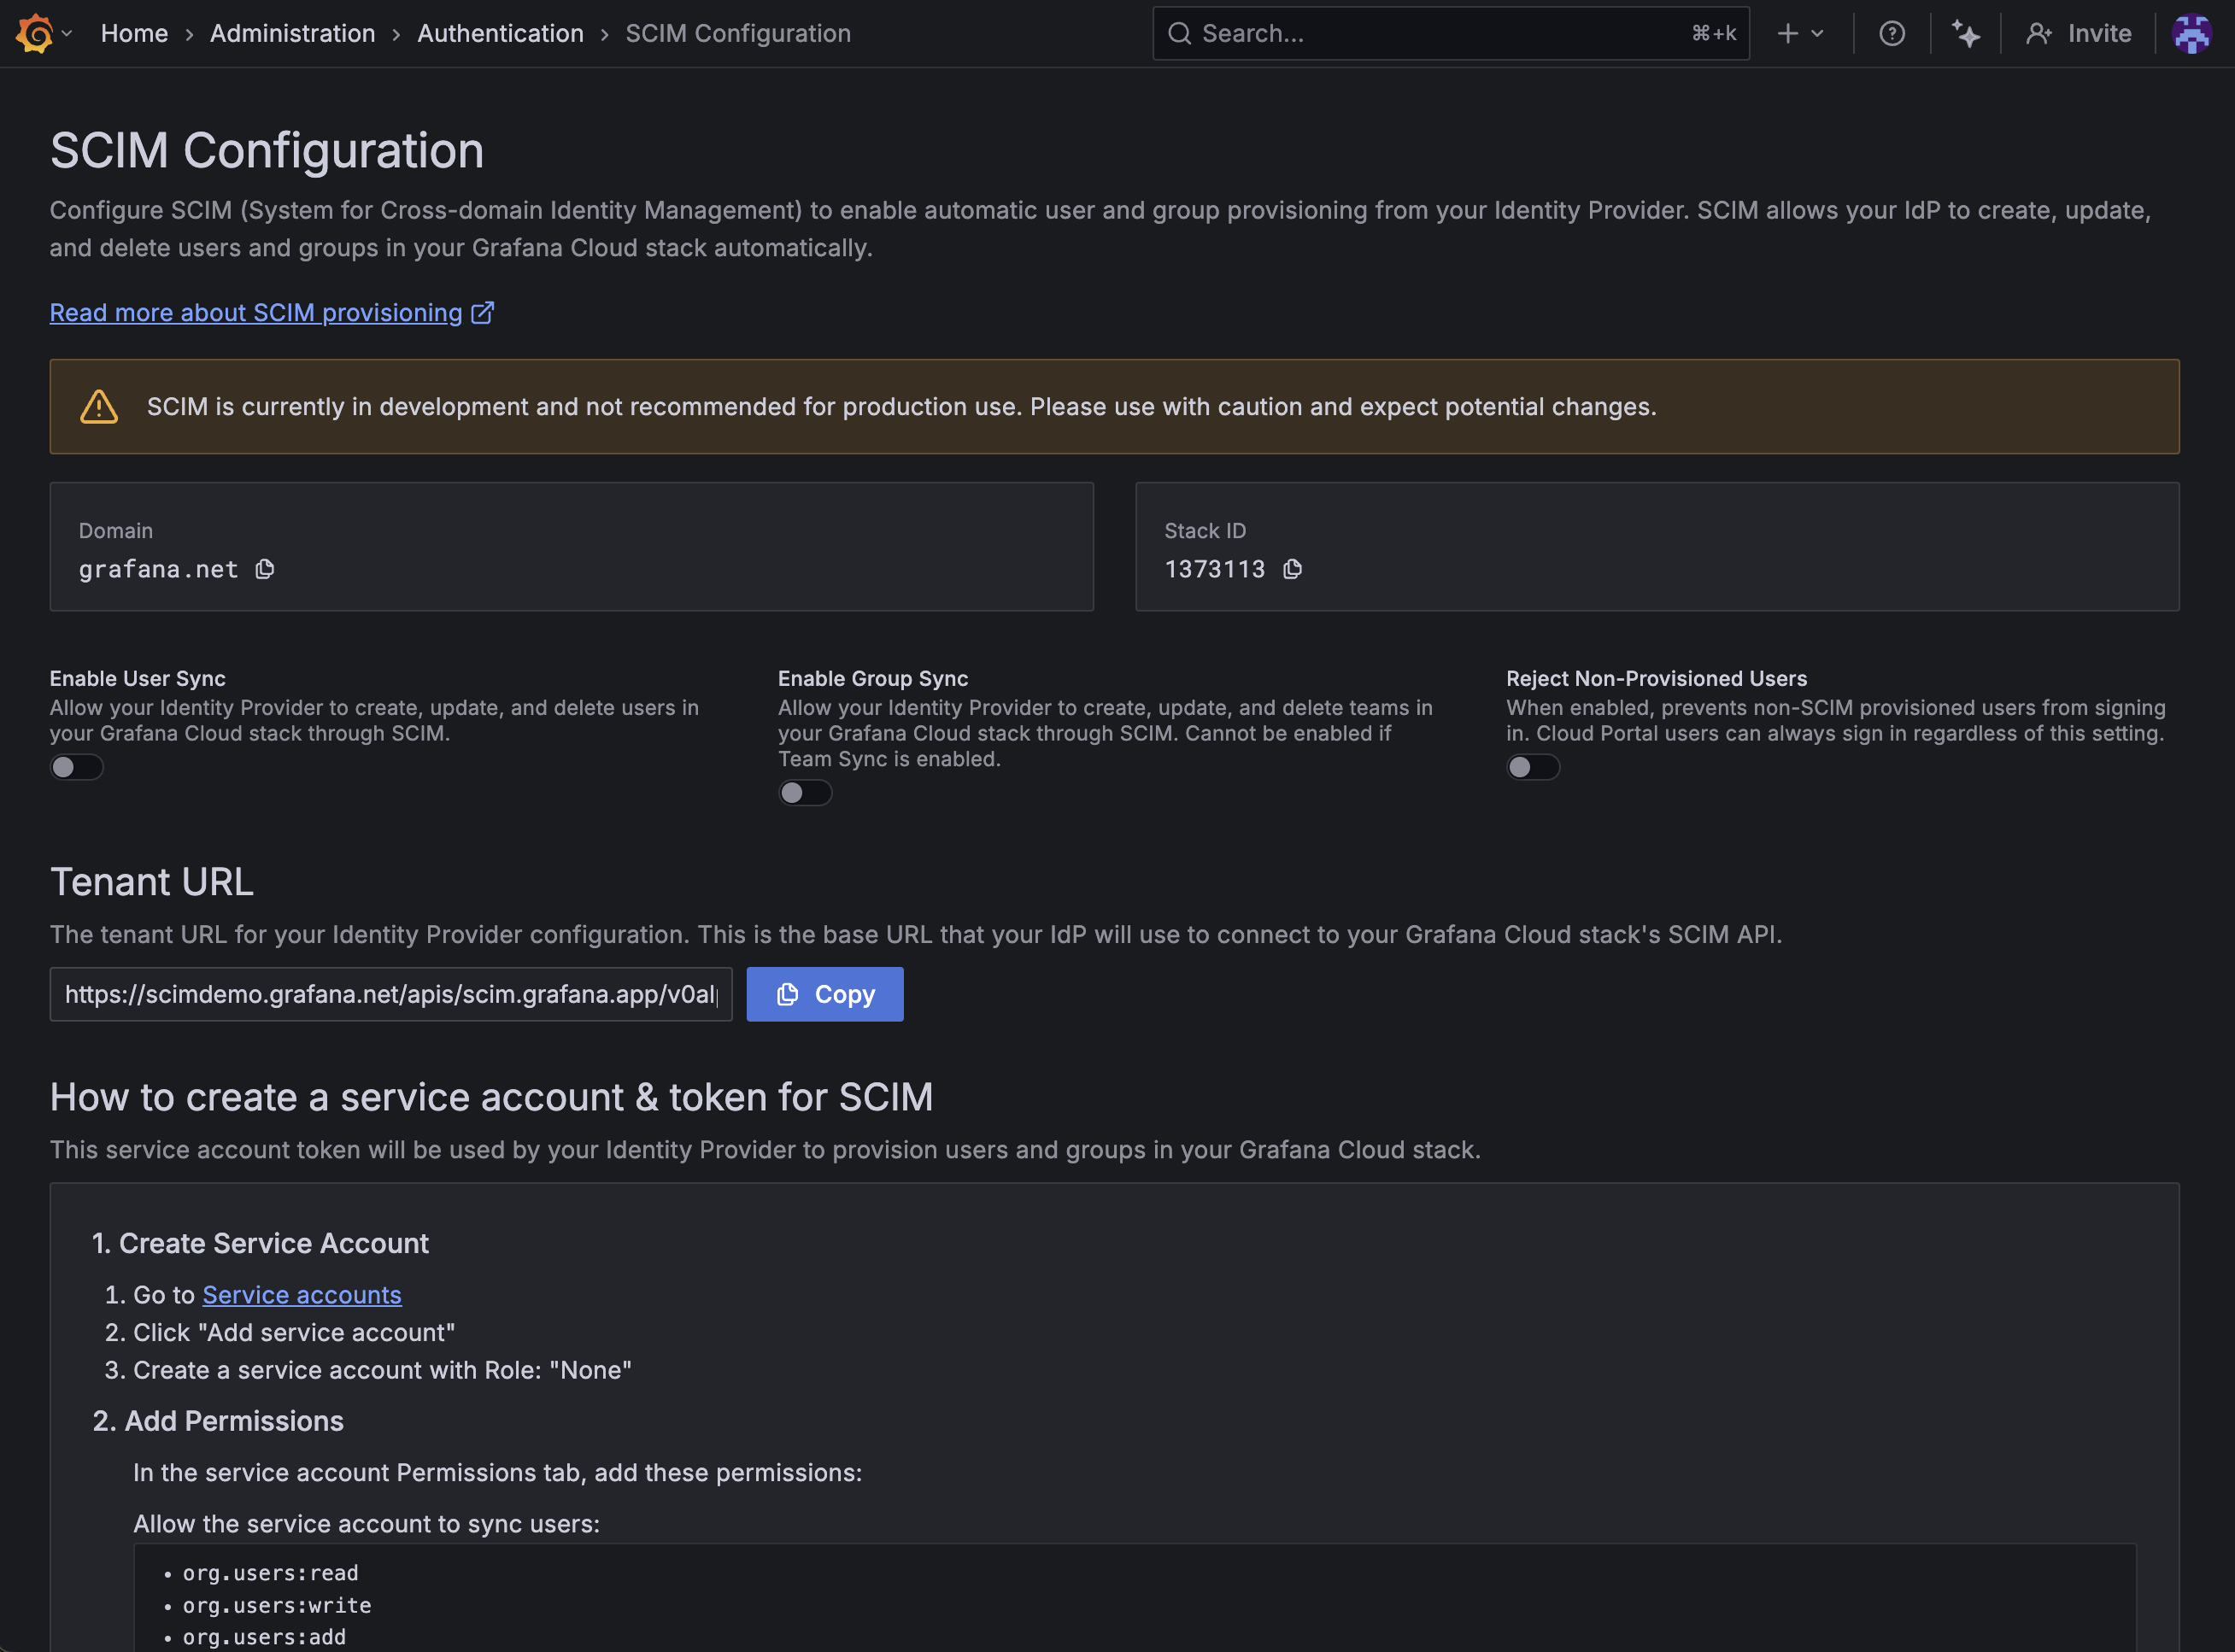
Introducing the SCIM Configuration UI in Grafana.
We recently announced SCIM for user and group provisioning in Grafana, and now we’re excited to announce that SCIM configuration is easy with the SCIM Configuration UI. Here you can easily toggle SCIM configuration options without restarting your instance, find information like your Tenant URL, Domain, and Stack ID for configuring SCIM in your IdP, and learn how to create a service account and token with the correct permissions.