Important: This documentation is about an older version. It's relevant only to the release noted, many of the features and functions have been updated or replaced. Please view the current version.
Investigate traces using Search query builder
Inspired by PromQL and LogQL, TraceQL is a query language designed for selecting traces. TraceQL provides a method for formulating precise queries so you can zoom in to the data you need. Query results are returned faster because the queries limit what is searched.
To learn more about how to query by TraceQL, refer to the TraceQL documentation.
The Search query builder, located on the Explore > Query type > Search in Grafana, provides drop-down lists and text fields to help you write a query.
Enable Search with the query builder
This feature is automatically available in Grafana 10 (and newer) and Grafana Cloud.
To enable the TraceQL query builder in self-hosted Grafana through version 10.1, enable the traceqlSearch feature toggle.
Write TraceQL queries using Search
The Search query builder, located on the Explore > Query type > Search in Grafana, provides drop-down lists and text fields to help you write a query. The selections you make automatically generate a TraceQL query.

The builder lets you run the most common queries in as few clicks as possible. You don’t need to know the underlying query language or database architecture to use it.
The builder supports a subset of TraceQL capabilities, including some structural operators (>>, >, =~, !=).
To access Search, select your Tempo data source, and then choose Explore and select Query type > Search. You can use the query builder to search trace data by resource service name, span name, duration, one or more tags. The examples on this page use the default filters.
In addition, you can add query builder blocks, view the query history, and use the Inspector to see details.
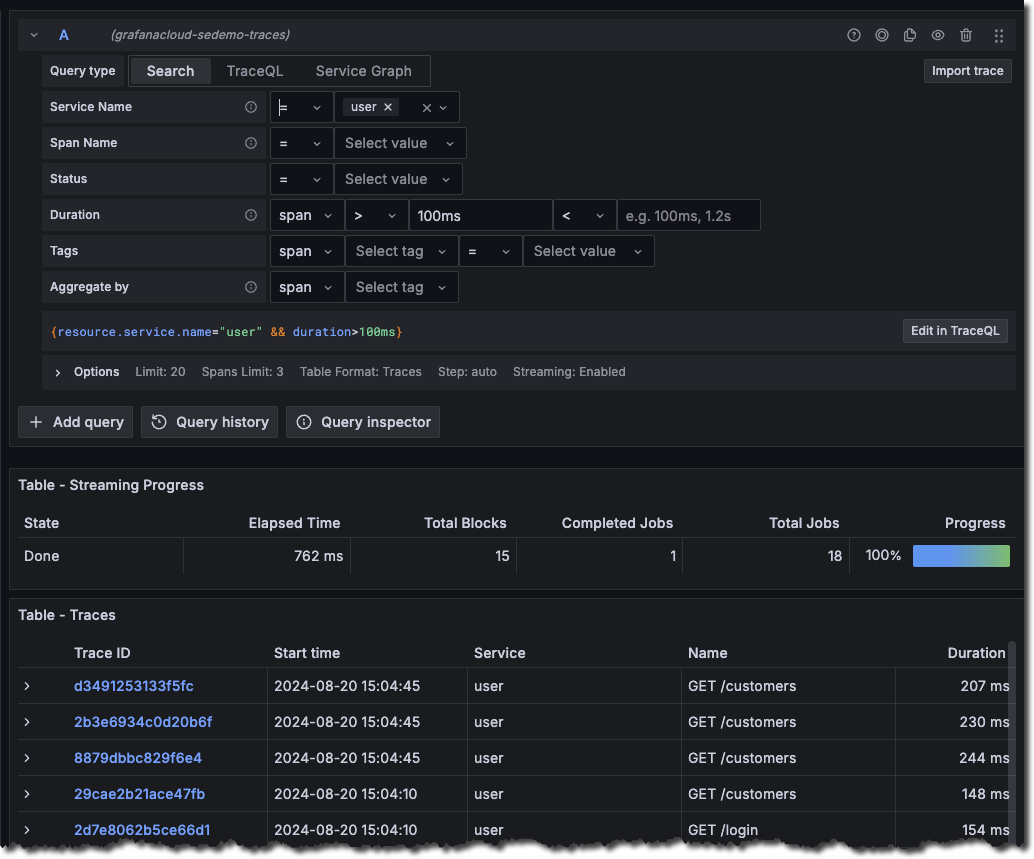
Perform a search
To perform a search, you need to select filters and then run the query. The results appear underneath the query builder. The screenshot identifies the areas used to perform a search.
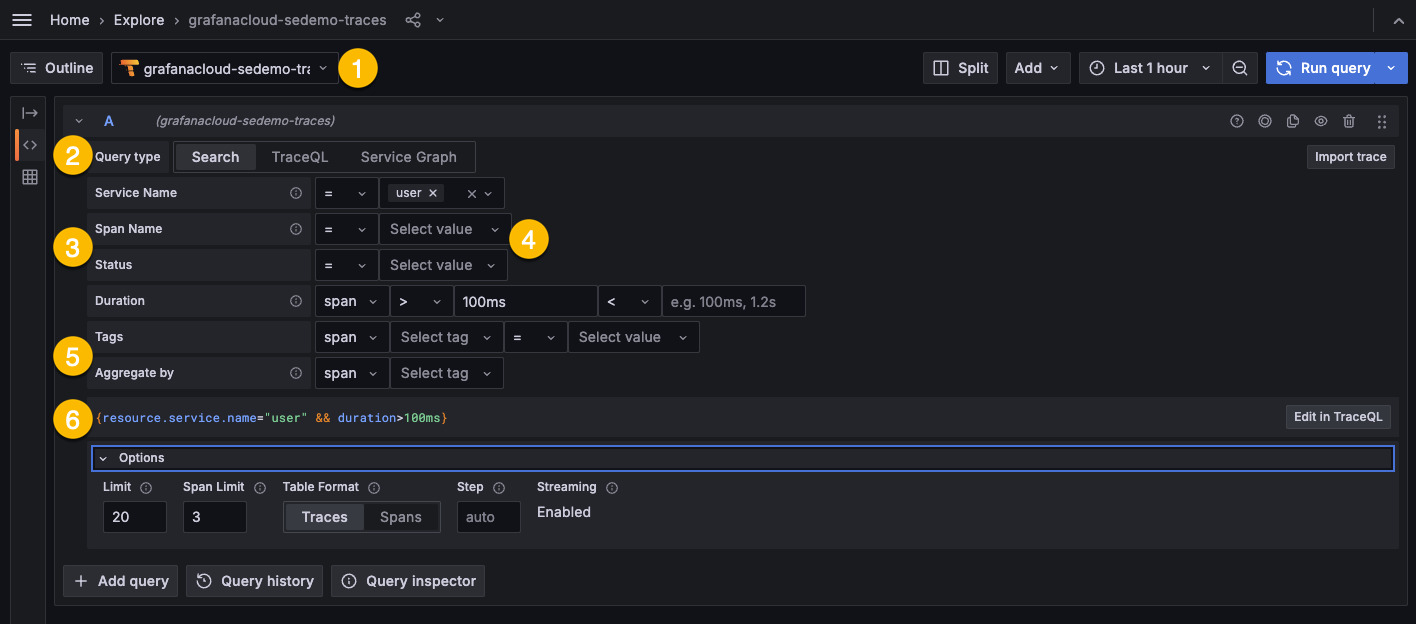
Every query searches the data for the selected time frame. By default, queries run against data from the last hour. Select Time range to the left of Run query to choose the time range for the data your query runs against. Read the dashboard time range documentation to learn more.
To access the Search query builder, use the following steps:
- Sign into Grafana.
- Select your Tempo data source.
- From the menu, choose Explore and select Query type > Search.
Define filters
Using filters, you refine the data returned from the query by selecting Service Name, Span Name, Status, or Duration. Duration represents span time, calculated by subtracting the end time from the start time of the span.
Grafana administrators can change the default filters using the Tempo data source configuration.
Filters can be limited by the operators.
The field type determines the available operators.
For example, Span Name and Service Name are string fields so the comparison operators are equals (=), not equal (!=), matches regular expressions (=~), or doesn’t match regular expression (!~).
Duration is a duration field type and uses range selections (>, >=, <, <=).
When you select multiple values for the same filter, Grafana automatically changes the operator to the regular expression (regex) operator =~ and concatenates the values with a |.
This capability only applies to fields with drop-down value selection.
For example, if you choose Span Name = get and then Span Name = log_results_cache, operator drop-down list changes from = to =~ and both get and log_results_cache are listed in the Span Name field.
The resulting query is updated with this:
{duration>5ms && duration<10ms && name=~"get|log_results_cache"}
To define filters, follow these steps:
- Choose one of the filters.
- Select a comparison operator from the drop-down.
- Service Name, Span Name, and Status only: Select one or more values from the drop-down.
- Duration only: Enter values and units for the range and choose comparison operators for the drop-downs. Units can be nanoseconds (
ns), milliseconds (ms), seconds (s), minutes (m), and hours (h).
You can either select Run query to execute the query or define tags and then run the query.
Define tags
You can add any tags to your query to further filter the results. Tags can be selected by scoped (span or resource) or unscoped. If you select unscoped, then all tags are searched for matches.
To add a tag, follow these steps:
- Select span, resource, or unscoped.
- Select a tag from the Select tag drop-down.
- Select a comparison operator.
- Select a value from the Select value drop-down. This field is populated based upon the tag.
- Optional: Select + to add another tag.
Optional: Use Aggregate by
Warning
Aggregate by is an experimental feature. Engineering and on-call support is not available. Documentation is either limited or not provided outside of code comments. No SLA is provided. Enable the
metricsSummaryfeature toggle in Grafana to use this feature. Your Grafana Tempo data source must also point to a Tempo database with the Metrics Summary API enabled. Contact Grafana Support to enable this feature in Grafana Cloud.
Using Aggregate by, you can calculate RED metrics (total span count, percent erroring spans, and latency information) for spans of kind=server that match your filter criteria, grouped by one or more attributes.
This capability is based on the metrics summary API.
Metrics summary only calculates summaries based on spans received within the last hour.
For additional information, refer to Traces to metrics: Ad-hoc RED metrics in Grafana Tempo with Aggregate by.
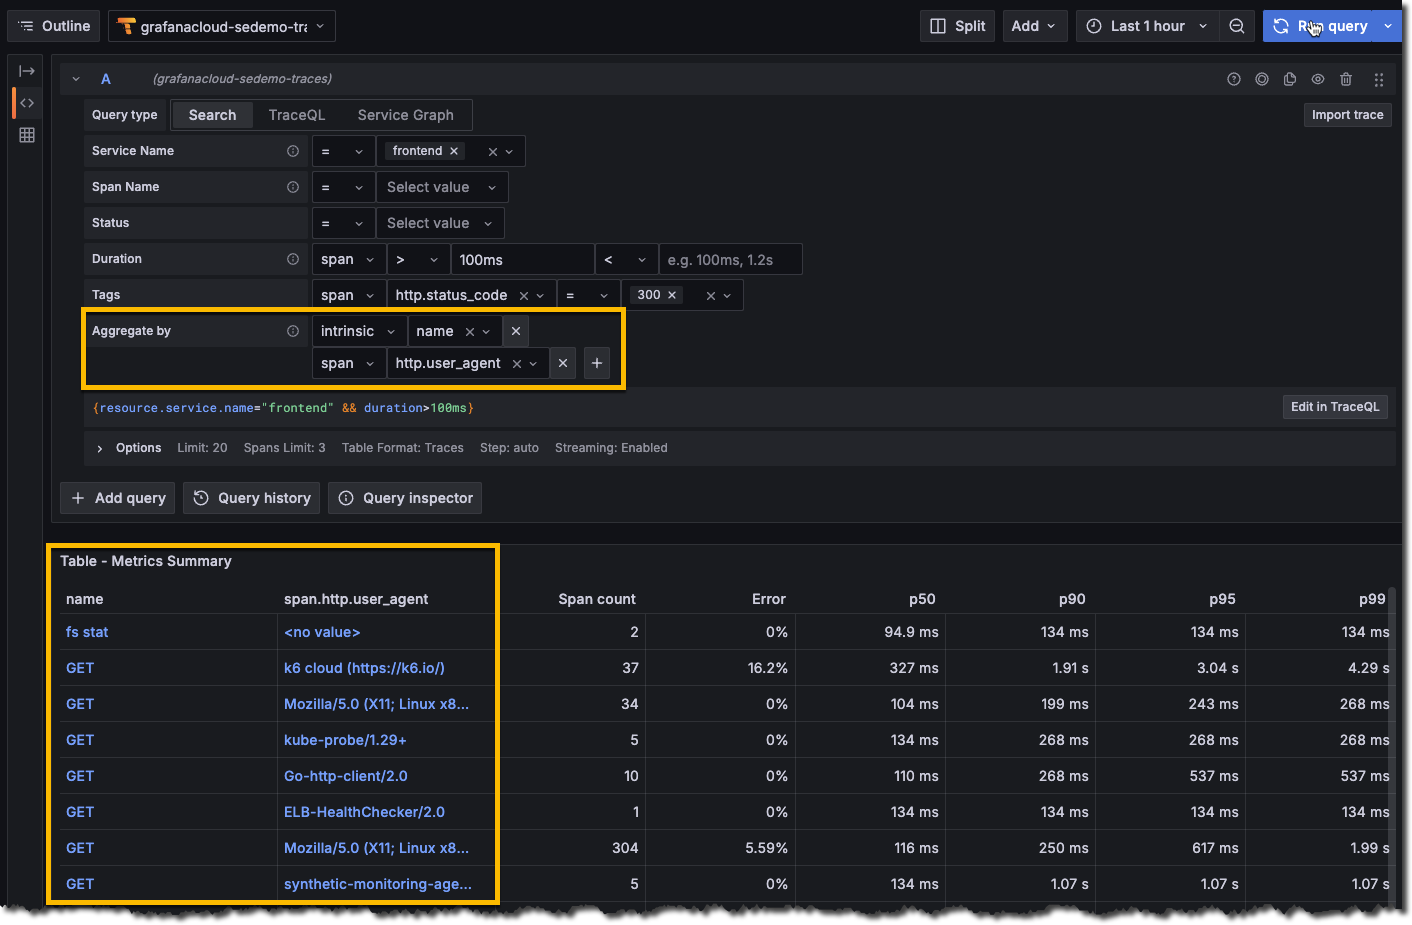
When you use Aggregate by, the selections you make determine how the information is reported in the Table. Every combination that matches selections in your data is listed in the table.
Each aggregate value, for example intrinsic:name, has a corresponding column in the results table.
For example, names matching GET /:endpoint with a span.http.user_agent of k6/0.46 appeared in 31,466 spans. Instead of being listed by traces and associated spans, the query results are grouped by the selections in Aggregate by.
The RED metrics are calculated for every name and user agent combination found in your data.
The screenshot shows all of the successful HTTP status_code API calls against the mystical-server service.
The results are shown in the same order used in Aggregate by.
For example, Aggregate by lists intrinsic.name followed by span.http.user_agent.
The first column in the results Table shows name and then span.http.user_agent.
To use this capability:
- In the Aggregate by row, select a scope from the first drop-down box. For example,
span. - Select an attribute from the second drop-down.
- Optional: Select + to add an Aggregate by row.
- Optional: Select a Time range to expand or narrow the data set for an hour’s range.
- Select Run query.
Optional: Add query and service graph blocks
Using Add query, you can have successive query or service node blocks that run in sequential order. For example, query A runs and then query B. You can reorder the queries by dragging and dropping them above or below other queries. Select + Add query to add another query block.
For more information, refer to Use query types together.
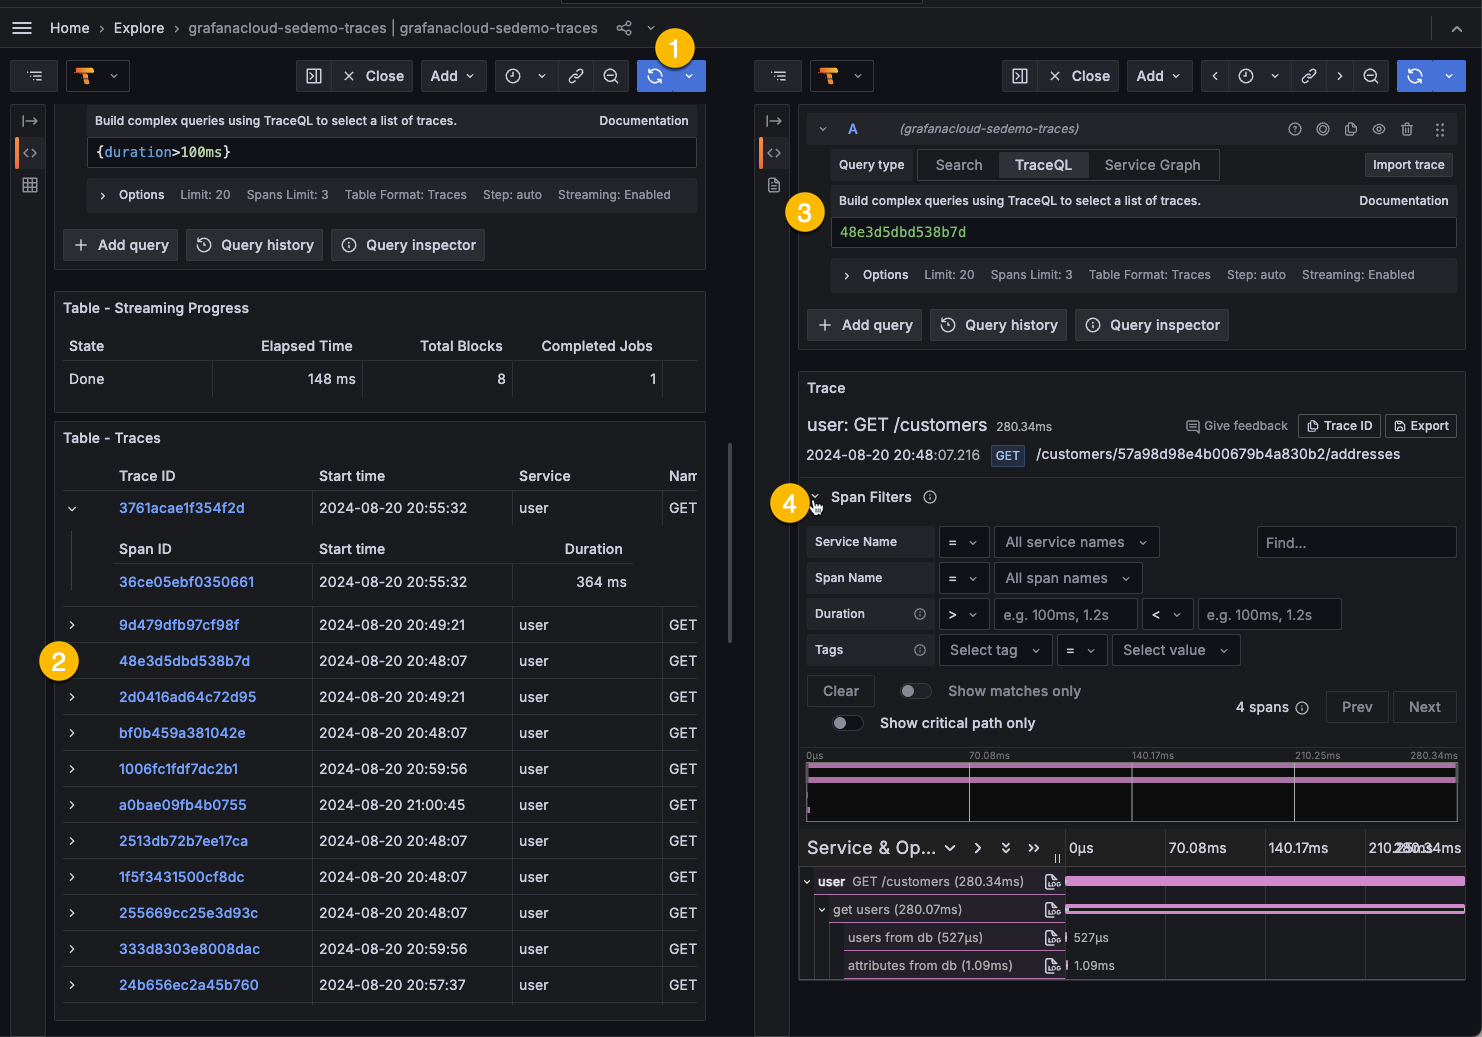
Run queries and view results
Select Run query to run the TraceQL query (1 in the screenshot).
Queries can take a little while to return results. The results appear in a table underneath the query builder. Selecting a Trace ID (2 in the screenshot) displays more detailed information (3 in the screenshot). Span Filters (4 in the screenshot) provide an additional to refine the query results.
Stream results
The Tempo data source supports streaming responses to TraceQL queries so you can see partial query results as they come in without waiting for the whole query to finish.
Note
To use this public preview feature, enable the
traceQLStreamingfeature toggle. When active, all configured Tempo data sources will attempt to use streaming. You can control which Tempo data sources do and don’t attempt to stream results at the per-data source level using the Streaming section of the Tempo data source configuration.
Streaming is available for both the Search and TraceQL query types. You’ll get immediate visibility of incoming traces on the results table.
Use filters and tags on spans
Using Span Filters, you can use filters to refine results when viewing span details. These filters are available when viewing details for a trace.
You can continue to apply filters until you have narrowed down your resulting spans to the select few you are most interested in.
Service Name, Span Name, Duration, and Tags have the same function and operation as the filters of the same name in the Search query builder.
In addition, you can search for a keyword, opt to Show matches only, opt to Show critical path only, and browse matches using Prev and Next.
Use Clear to reset the filters.


