
Important: This documentation is about an older version. It's relevant only to the release noted, many of the features and functions have been updated or replaced. Please view the current version.
Write TraceQL queries with the editor
Inspired by PromQL and LogQL, TraceQL is a query language designed for selecting traces. TraceQL provides a method for formulating precise queries so you can zoom in to the data you need. Query results are returned faster because the queries limit what is searched.
To learn more about how to query by TraceQL, refer to the TraceQL documentation.
The TraceQL query editor in Grafana Explore lets you search by trace ID and write TraceQL queries using autocomplete.

Before you begin
This feature is automatically available in Grafana 10 (and newer) and Grafana Cloud.
To use the TraceQL query editor in self-hosted Grafana 9.3.2 and older, you need to enable the traceqlEditor feature toggle.
Streaming and gRPC
If you’re trying to query a self-managed Grafana Tempo or Grafana Enterprise Traces database with a gateway, such as nginx, in front of it from your hosted Grafana, that gateway (for example, nginx) must allow gRPC connections. If it doesn’t, streaming won’t work and queries will fail to return results.
If you can’t configure your gateway to allow gRPC, deactivate streaming in your hosted Grafana. In Grafana 11.2 and newer, you can deactivate the Streaming option in your Tempo data source settings from Connections > Data sources in the Grafana main menu. You can also open a support escalation to request streaming query results be disabled in your hosted Grafana.
Write TraceQL queries using the query editor
The Tempo data source’s TraceQL query editor helps you query and display traces from Tempo in Explore.
To access the query editor, follow these steps:
Sign into Grafana or Grafana Cloud.
Select Explore from the main menu.
Select a Tempo data source.
Select the TraceQL tab.
Start your query on the text line by entering
{. For help with TraceQL syntax, refer to the Construct a TraceQL query documentation.Optional: Select Copy query from Search to transfer a builder query to the editor.
Optional: Use the Time picker drop-down list to change the time and range for the query (refer to the documentation for instructions).
Once you’ve finished your query, select Run query.
This video provides an example of creating a TraceQL query using the custom tag grouping.
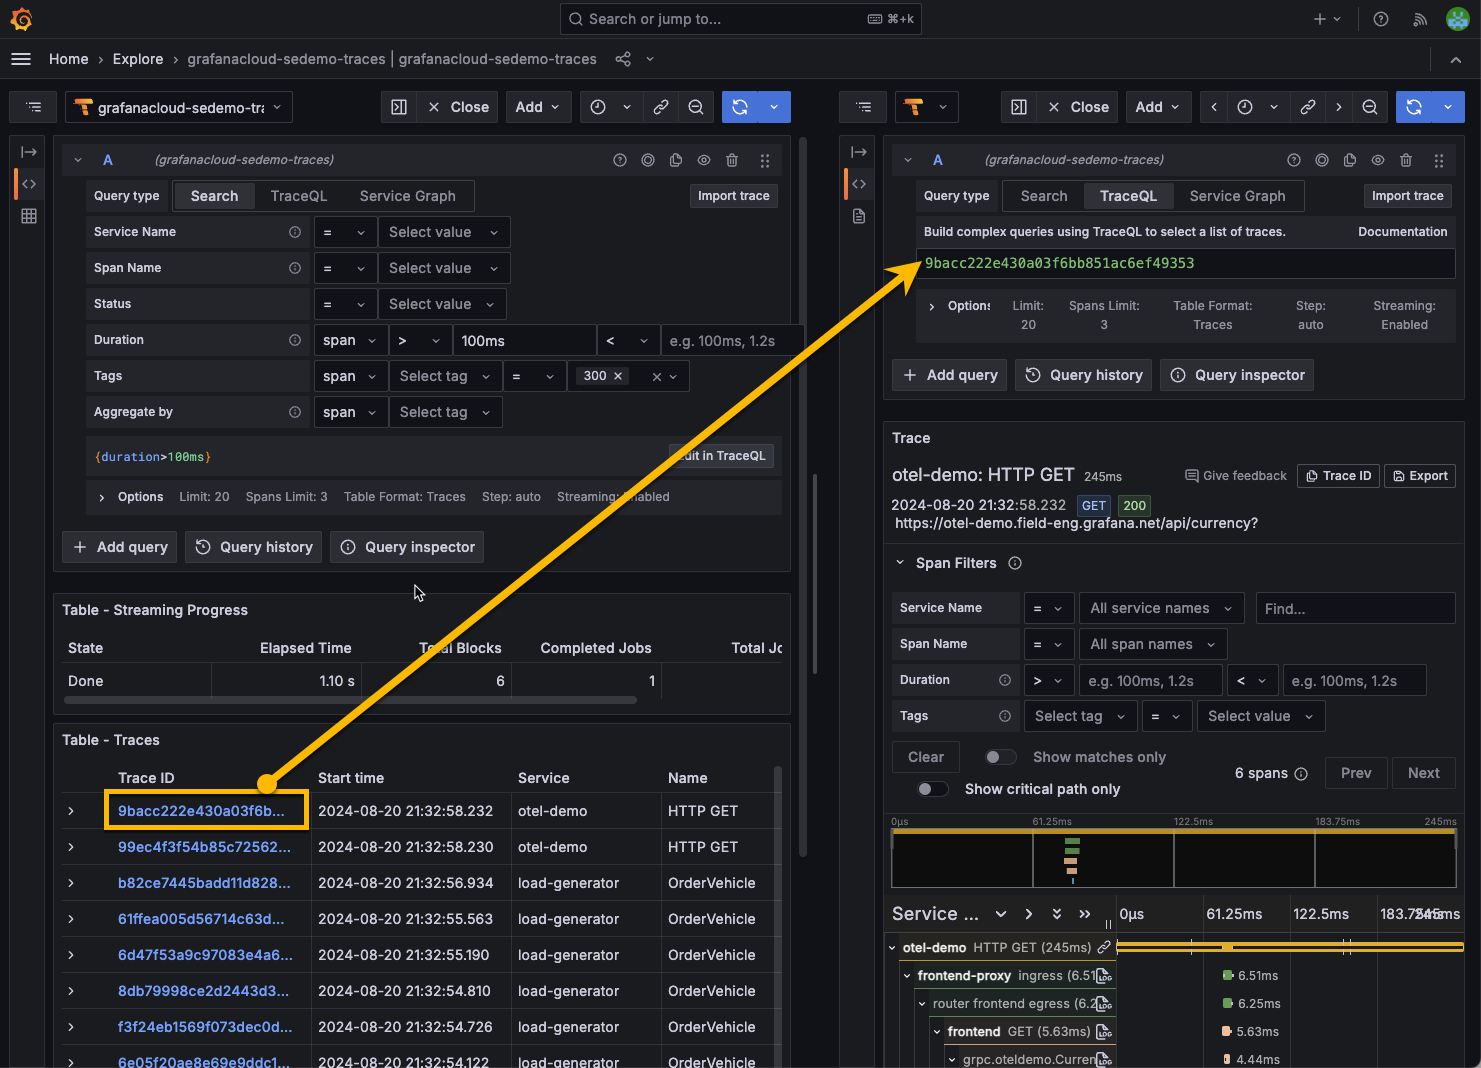
Query by TraceID
To query a particular trace by its trace ID:
- From the menu, choose Explore, select the desired Tempo data source, and navigate to the TraceQL tab.
- Enter the trace ID into the query field. For example:
41928b92edf1cdbe0ba6594baee5ae9 - Click Run query or use the keyboard shortcut Shift + Enter.
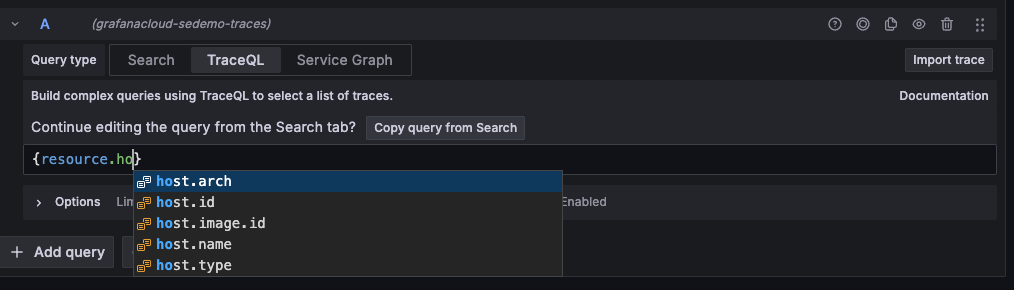
Use autocomplete to write queries
You can use the query editor’s autocomplete suggestions to write queries. The editor detects spansets to provide relevant autocomplete options. It uses regular expressions (regex) to detect where it is inside a spanset and provide attribute names, scopes, intrinsic names, logic operators, or attribute values from the Tempo API, depending on what’s expected for the current situation.
To create a query using autocomplete, follow these steps:
From the menu, choose Explore, select the desired Tempo data source, and navigate to the TraceQL tab.
Enter your query. As you type your query, autocomplete suggestions appear as a drop-down. Each letter you enter refines the autocomplete options to match.
Use your mouse or arrow keys to select any option you wish. When the desired option is highlighted, press Tab on your keyboard to add the selection to your query.
Once your query is complete, select Run query.
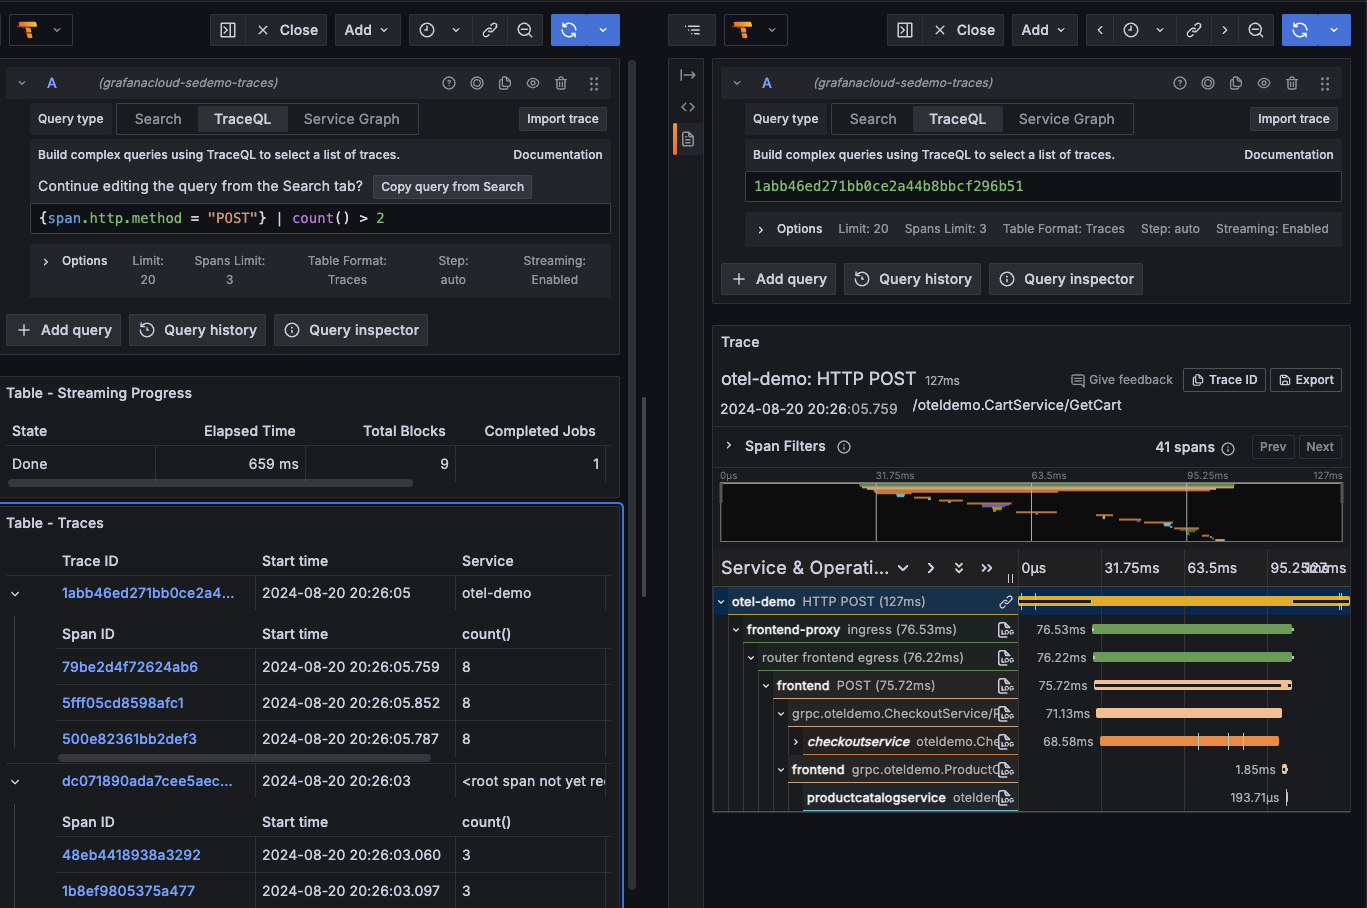
View query results
Query results appear in a table, such as Table - Traces, under the query editor. Each span (and the trace it belongs to) matching the query conditions is returned by the query. If there are no filter conditions, all spans are matching and thus returned with their associated traces.
A query is performed against a defined time interval, relative (for example, the last 3 hours) or absolute (for example, from X date-time to Y date-time). The query response is also limited by the number of traces (Limit) and spans per spanset (Span Limit).
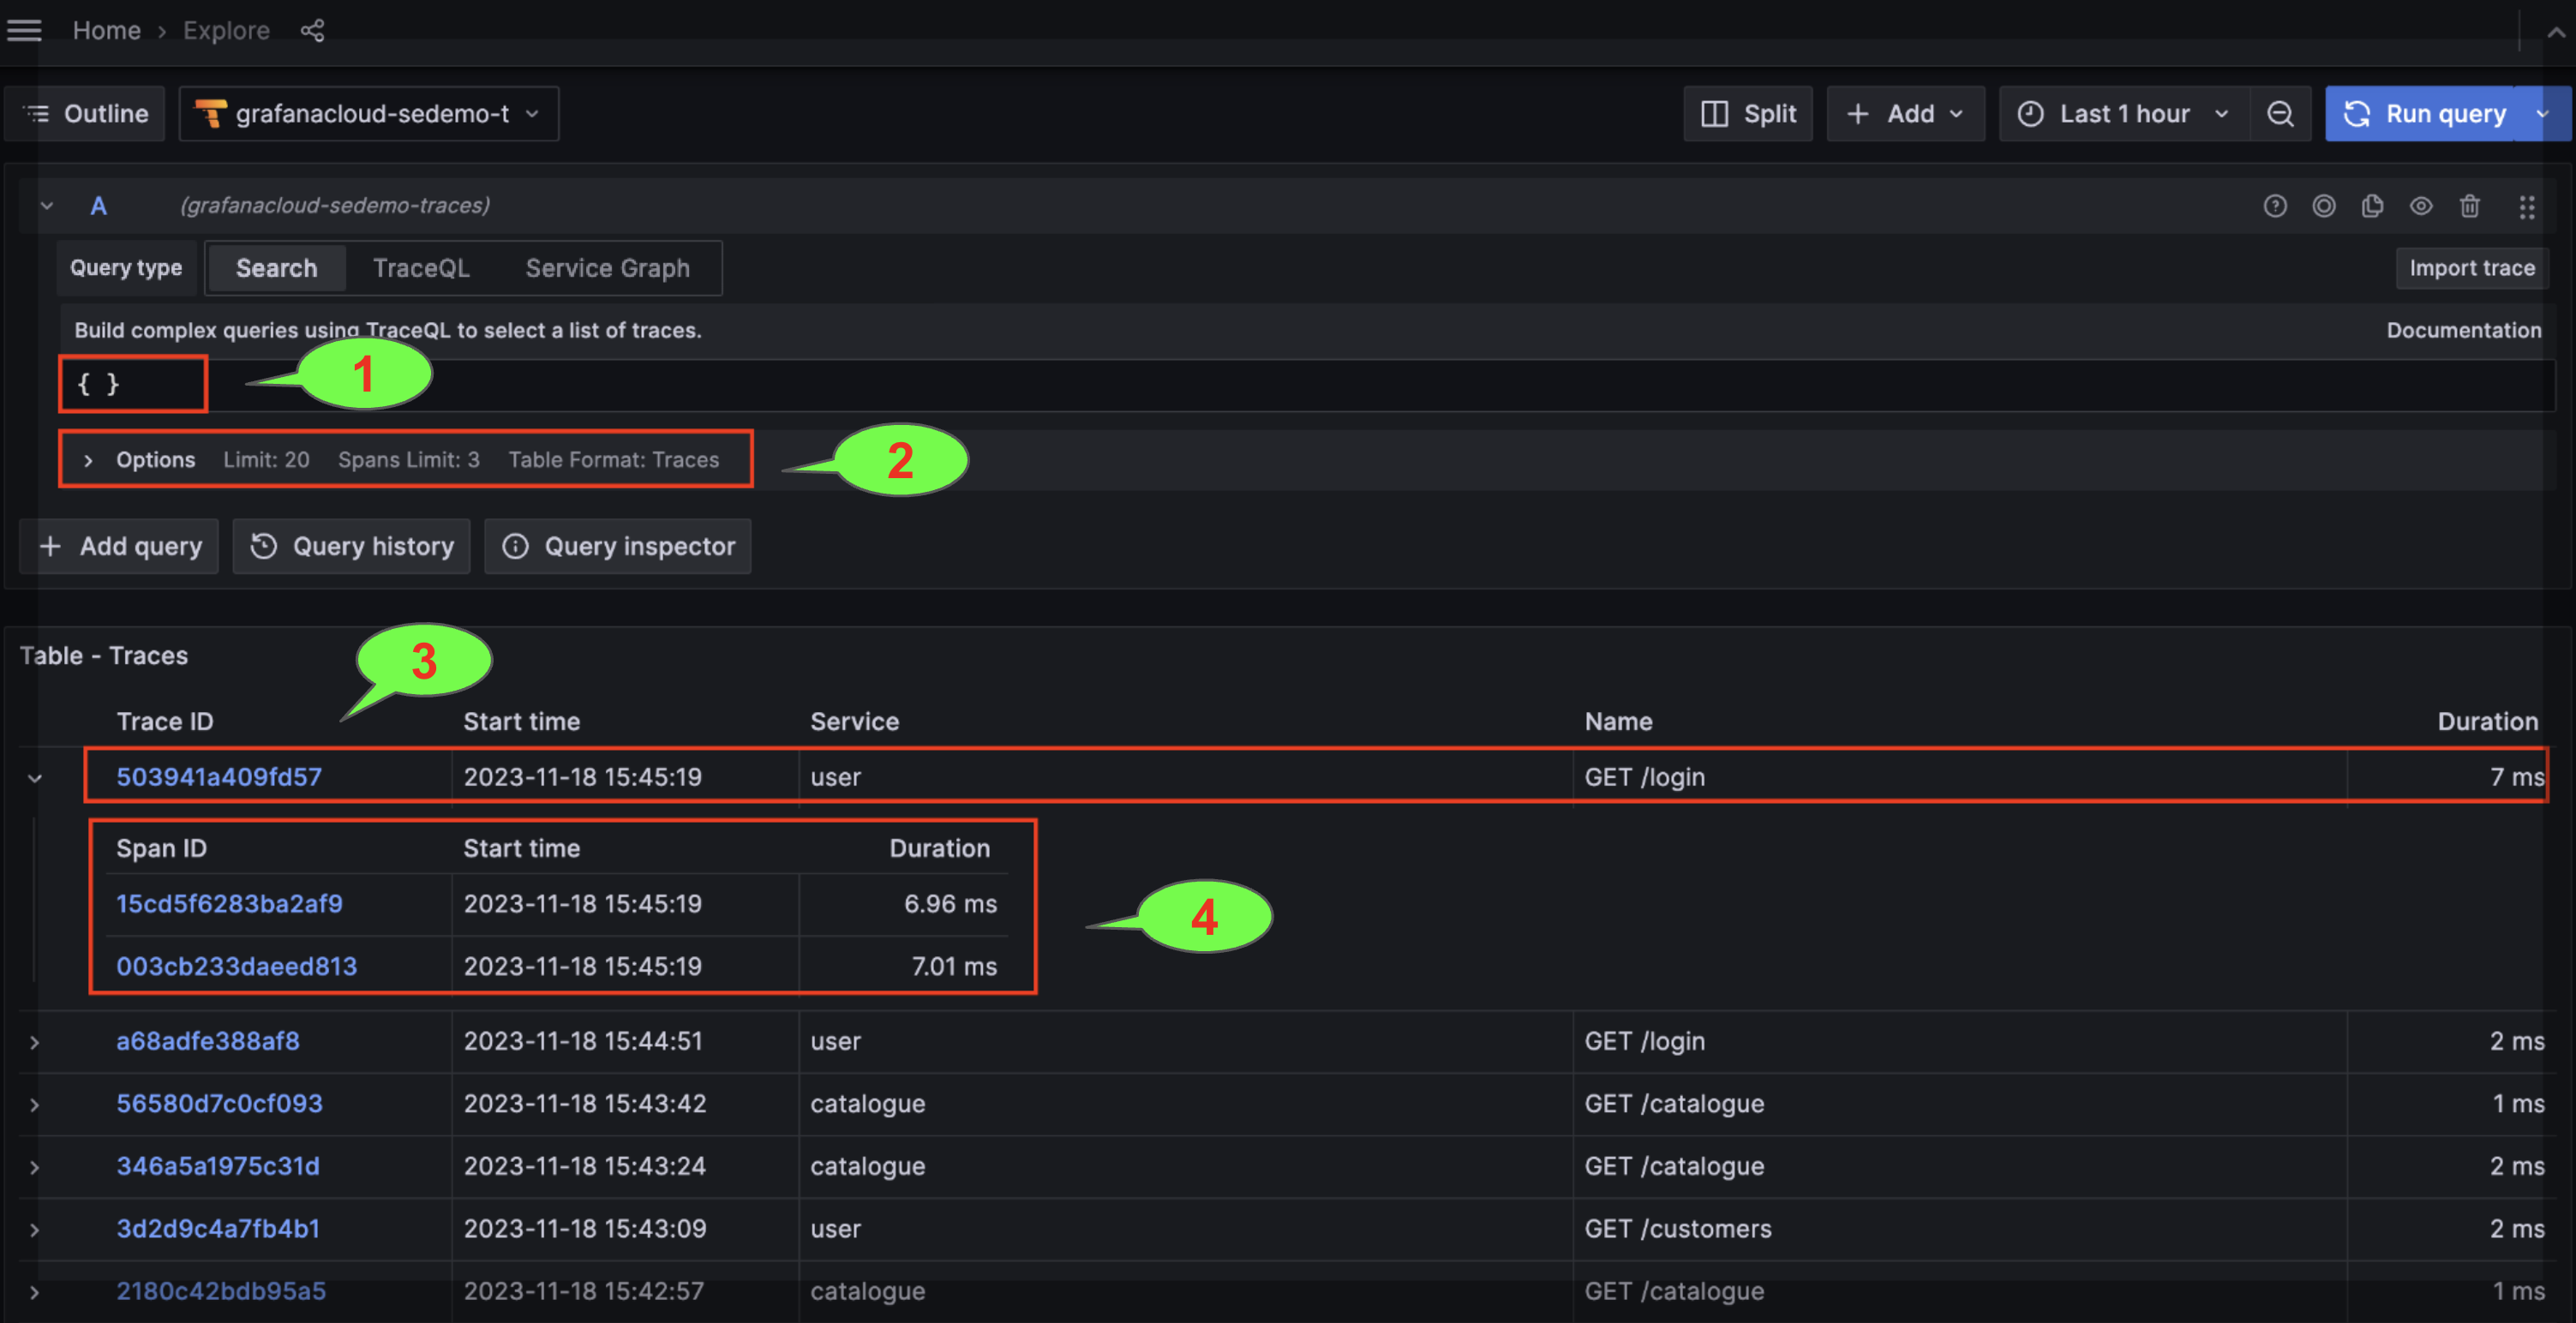
- TraceQL query editor
- Query options: Limit, Span Limit and Table Format (Traces or Spans).
- Trace (by Trace ID). The Name and Service columns are displaying the trace root span name and associated service.
- Spans associated with the Trace.
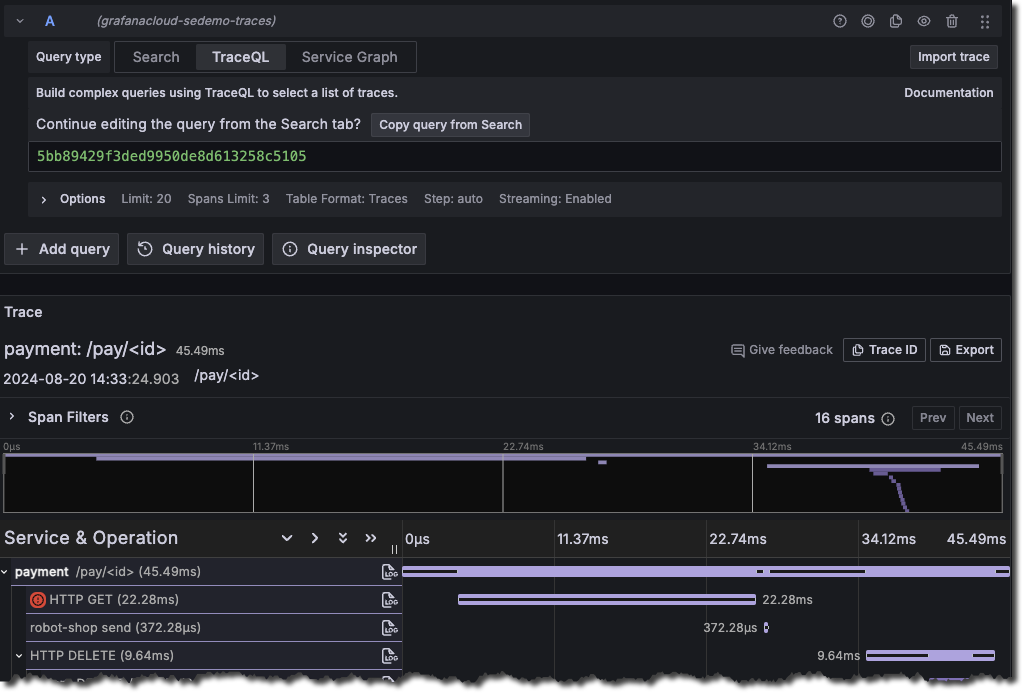
Selecting the trace ID from the returned results opens a trace diagram. Selecting a span from the returned results opens a trace diagram and reveals the relevant span in the trace diagram.
For more information on span details, refer to Traces in Explore.
Focus on traces or spans
Under Options, you can choose to display the table as Traces or Spans focused.
When the Table Type option is set to Spans, the traces and spansets are flattened into a list of spans. The trace service and trace name are added to the row of each span to add context.
Using the Spans option makes it easier access the spans to apply transformations and plot them in dashboards.
Stream results
The Tempo data source supports streaming responses to TraceQL queries so you can see partial query results as they come in without waiting for the whole query to finish.
Note
To use this feature in Grafana OSS v10.1 and later, enable the
traceQLStreamingfeature toggle. This capability is enabled by default in Grafana Cloud.
Streaming is available for both the Search and TraceQL query types, and you’ll get immediate visibility of incoming traces on the results table.


