
Important: This documentation is about an older version. It's relevant only to the release noted, many of the features and functions have been updated or replaced. Please view the current version.
Configure Alertmanagers
Grafana Alerting is based on the architecture of the Prometheus alerting system. Grafana sends firing and resolved alerts to an Alertmanager, which is responsible for handling notifications.
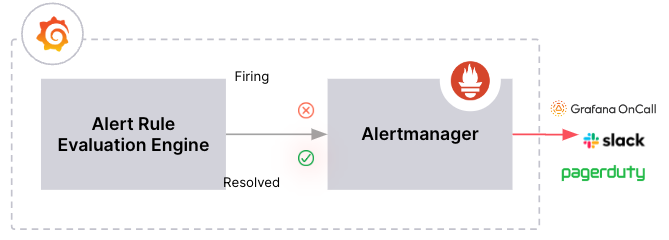
This architecture decouples alert rule evaluation from notification handling, allowing alerts to be forwarded to other Alertmanagers.
Grafana can use different Alertmanagers. It’s important to note that each Alertmanager manages its own independent alerting resources, such as:
- Contact points and notification templates
- Notification policies and mute timings
- Silences
- Active notifications
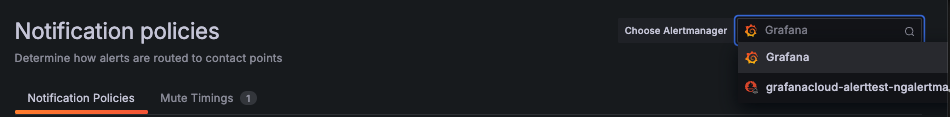
Use the Choose Alertmanager on these pages to switch between Alertmanagers.
Types of Alertmanagers in Grafana
Grafana can be configured to manage both Grafana-managed and data source-managed alerts using various Alertmanagers, depending on your infrastructure and alerting requirements.
Grafana Alertmanager: Grafana has its own built-in Alertmanager, referred to as “Grafana” in the user interface. It is the default Alertmanager and can only handle Grafana-managed alerts.
Cloud Alertmanager: Each Grafana Cloud instance comes preconfigured with an additional Alertmanager (
grafanacloud-STACK_NAME-ngalertmanager) from the Mimir (Prometheus) instance running in the Grafana Cloud Stack.The Cloud Alertmanager is available exclusively in Grafana Cloud and can handle both Grafana-managed and data source-managed alerts.
Some Grafana Cloud services, such as Kubernetes Monitoring and Synthetic Monitoring use the Cloud Alertmanager to create and manage alerts.
Other Alertmanagers: Grafana Alerting also supports sending alerts to other Alertmanagers, such as the Prometheus Alertmanager, which can handle Grafana-managed alerts and data sources-managed alerts such as alerts from Loki, Mimir, and Prometheus.
You can use a combination of Alertmanagers. The decision often depends on your alerting setup and where your alerts are being generated. Here are two examples of when you may want to add an Alertmanager and send your alerts there instead of using the built-in Grafana Alertmanager.
You may already have Alertmanagers on-premises in your own Cloud infrastructure that you still want to use because you have other alert generators, such as Prometheus.
You want to use both Prometheus on-premises and hosted Grafana to send alerts to the same Alertmanager that runs in your Cloud infrastructure.
Add an Alertmanager
From Grafana, you can configure and administer your own Alertmanager to receive Grafana alerts.
After adding an Alertmanager, you can use the Grafana Alerting UI to manage notification policies, contact points, and other alerting resources from within Grafana, with support for HTTP basic authentication credentials.
Alertmanagers should be configured as data sources using Grafana Configuration from the main Grafana navigation menu. To add an Alertmanager, complete the following steps.
Click Connections in the left-side menu.
On the Connections page, search for
Alertmanager.Click the Create a new data source button.
If you don’t see this button, you may need to install the plugin, relaunch your Cloud instance, and then repeat steps 1 and 2.
Fill out the fields on the page, as required.
If you are provisioning your data source, set the flag
handleGrafanaManagedAlertsin thejsonDatafield totrueto send Grafana-managed alerts to this Alertmanager.Note: Prometheus, Grafana Mimir, and Cortex implementations of Alertmanager are supported. For Prometheus, contact points and notification policies are read-only in the Grafana Alerting UI.
Click Save & test.
Note
Grafana Alerting does not support sending alerts to the AWS Managed Service for Prometheus due to the lack of sigv4 support in Prometheus.
Manage Alertmanager configurations
On the Settings page, you can manage your Alertmanager configurations and configure where Grafana-managed alert instances are forwarded.
- Manage which Alertmanagers receive alert instances from Grafana-managed rules without navigating and editing data sources.
- Manage version snapshots for the built-in Alertmanager, which allows administrators to roll back unintentional changes or mistakes in the Alertmanager configuration.
- Compare the historical snapshot with the latest configuration to see which changes were made.


