Important: This documentation is about an older version. It's relevant only to the release noted, many of the features and functions have been updated or replaced. Please view the current version.
Loki data source
Grafana ships with built-in support for Loki, an open-source log aggregation system by Grafana Labs. If you are new to Loki the following documentation will help you get started:
Configure the Loki data source
To add the Loki data source, complete the following steps:
- Click Connections in the left-side menu.
- Under Connections, click Add new connection.
- Enter
Lokiin the search bar. - Select Loki data source.
- Click Create a Loki data source in the upper right.
You will be taken to the Settings tab where you will set up your Loki configuration.
Configuration options
The following is a list of configuration options for Loki.
The first option to configure is the name of your connection:
Name - The data source name. This is how you refer to the data source in panels and queries. Examples: loki-1, loki_logs.
Default - Toggle to select as the default name in dashboard panels. When you go to a dashboard panel this will be the default selected data source.
HTTP section
URL - The URL of your Loki server. Loki uses port 3100. If your Loki server is local, use
http://localhost:3100. If it is on a server within a network, this is the URL with port where you are running Loki. Example:http://loki.example.orgname:3100.Allowed cookies - Specify cookies by name that should be forwarded to the data source. The Grafana proxy deletes all forwarded cookies by default.
Timeout - The HTTP request timeout. This must be in seconds. There is no default, so this setting is up to you.
Auth section
There are several authentication methods you can choose in the Authentication section.
Note
Use TLS (Transport Layer Security) for an additional layer of security when working with Loki. For information on setting up TLS encryption with Loki see Grafana Loki configuration parameters.
Basic authentication - The most common authentication method. Use your
data sourceuser name anddata sourcepassword to connect.With credentials - Toggle on to enable credentials such as cookies or auth headers to be sent with cross-site requests.
TLS client authentication - Toggle on to use client authentication. When enabled, add the
Server name,Client certandClient key. The client provides a certificate that is validated by the server to establish the client’s trusted identity. The client key encrypts the data between client and server.With CA cert - Authenticate with a CA certificate. Follow the instructions of the CA (Certificate Authority) to download the certificate file.
Skip TLS verify - Toggle on to bypass TLS certificate validation.
Forward OAuth identity - Forward the OAuth access token (and also the OIDC ID token if available) of the user querying the data source.
Custom HTTP headers
Header - Add a custom header. This allows custom headers to be passed based on the needs of your Loki instance.
Value - The value of the header.
Alerting
- Manage alert rules in Alerting UI - Toggle on to manage alert rules for the Loki data source. To manage other alerting resources add an
Alertmanagerdata source.
Queries
- Maximum lines - Sets the maximum number of log lines returned by Loki. Increase the limit to have a bigger results set for ad-hoc analysis. Decrease the limit if your browser is sluggish when displaying log results. The default is
1000.
Derived fields
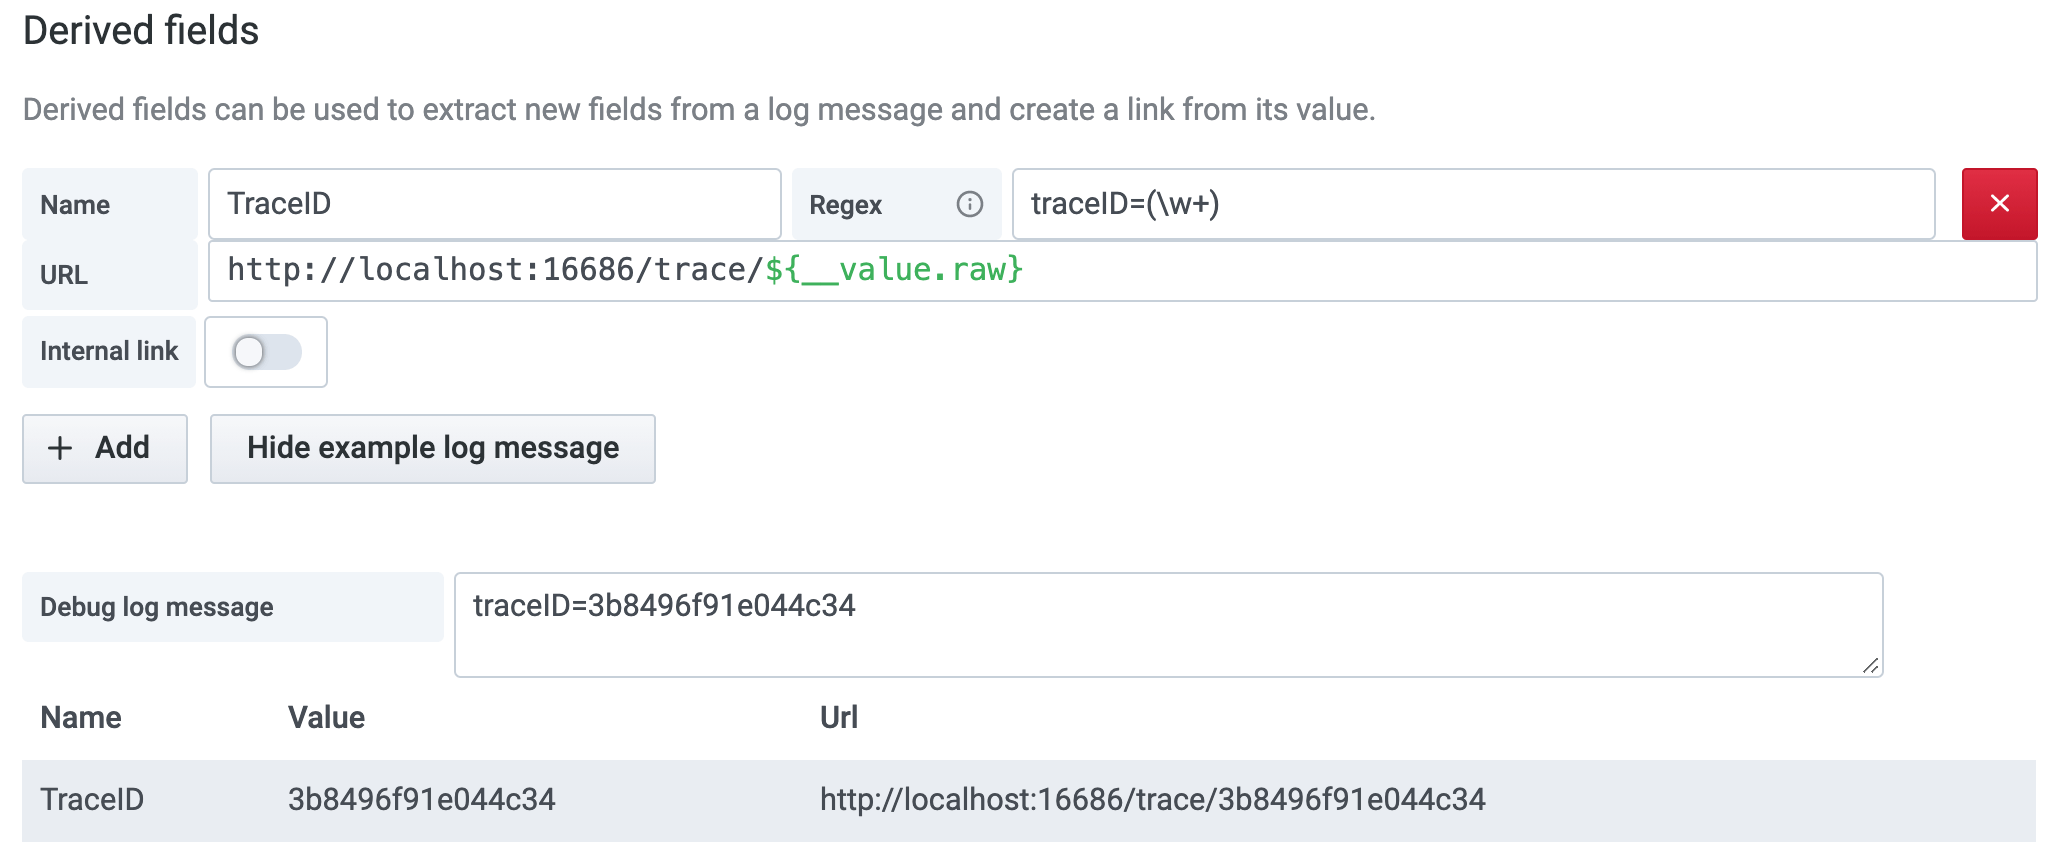
Derived Fields are used to extract new fields from your logs and create a link from the value of the field.
For example, you can link to your tracing backend directly from your logs, or link to a user profile page if the log line contains a corresponding userId.
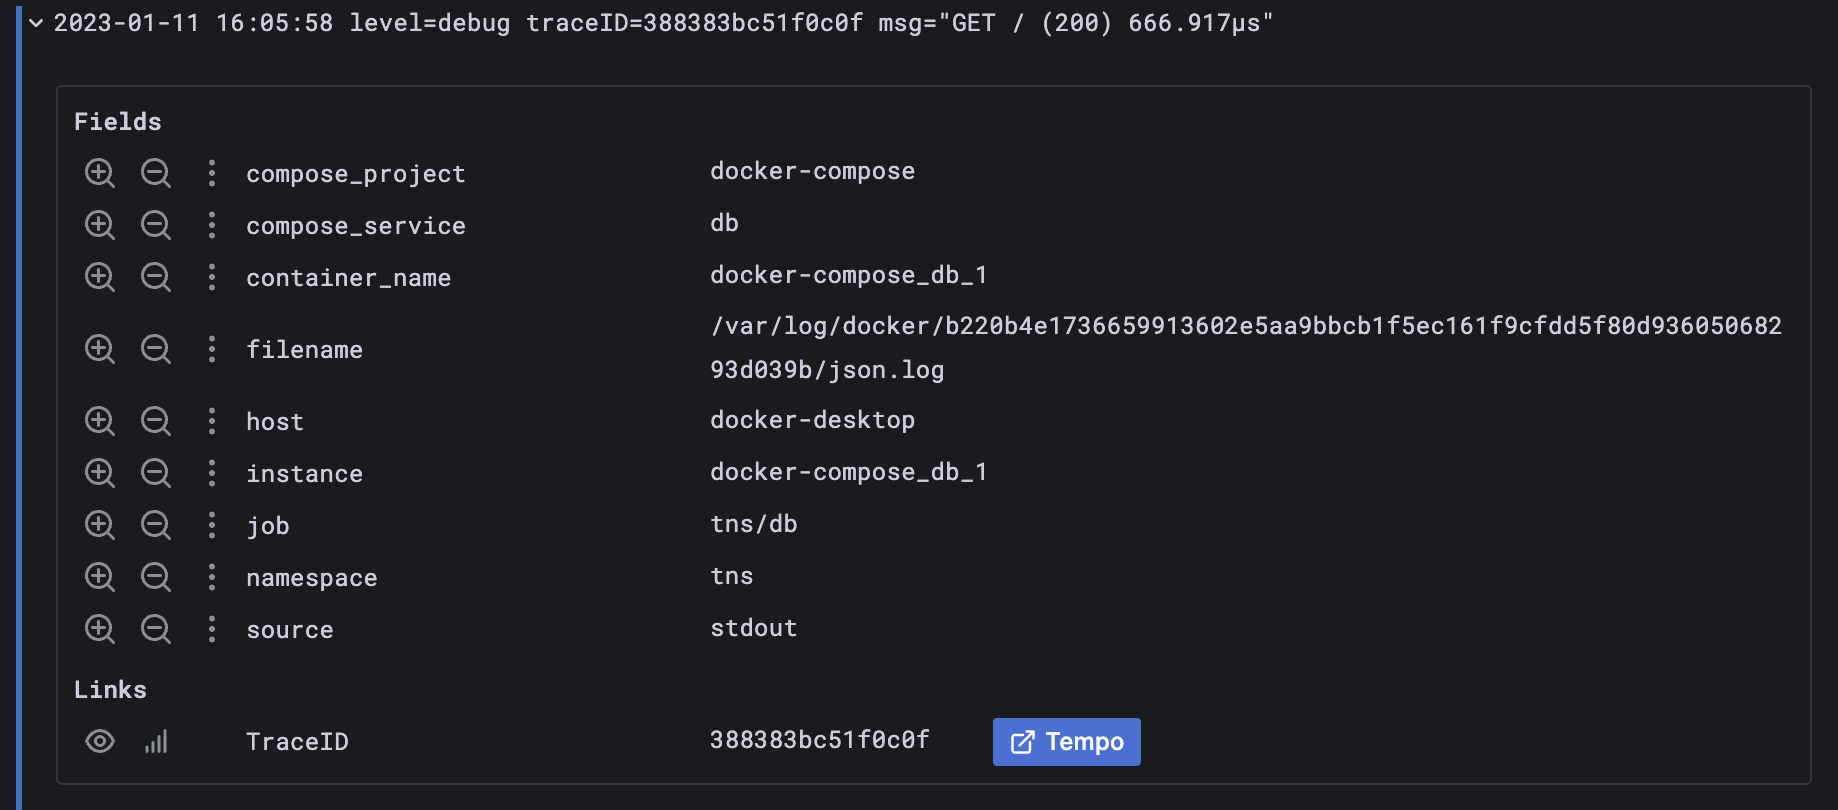
These links appear in the
log details.
You can add multiple derived fields.
Note
If you use Grafana Cloud, you can request modifications to this feature by clicking Open a Support Ticket from the Grafana Cloud Portal.
Each derived field consists of the following:
Name - Sets the field name. Displayed as a label in the log details.
Type - Defines the type of the derived field. It can be either:
Regex: A regular expression to parse a part of the log message and capture it as the value of the new field. Can contain only one capture group.
Label: A label from the selected log line. This can be any type of label - indexed, parsed or structured metadata. The label’s value will be used as the value of the derived field.
URL/query Sets the full link URL if the link is external, or a query for the target data source if the link is internal. You can interpolate the value from the field with the
${__value.raw}macro.URL Label - Sets a custom display label for the link. This setting overrides the link label, which defaults to the full external URL or name of the linked internal data source.
Internal link - Toggle on to define an internal link. For internal links, you can select the target data source from a selector. This supports only tracing data sources.
Show example log message - Click to paste an example log line to test the regular expression of your derived fields.
Click Save & test to test your connection.
Troubleshoot interpolation
You can use a debug section to see what your fields extract and how the URL is interpolated. Select Show example log message to display a text area where you can enter a log message.

The new field with the link shown in log details:


