Welcome to Grafana 11.5!
Read on to learn about new sharing, reporting, and export options, cross-cluster search for Elasticsearch, PDC support for several new data sources, and more.
The Grafana Cloud Migration Assistant is in public preview and now supports all plugins and Grafana Alerts, in addition to dashboards, folders, and data sources.
We’ve also made it more secure to run third-party apps and data sources, and improved user session handling for OAuth 2.0 and SAML.
For even more detail about all the changes in this release, refer to the changelog. For the specific steps we recommend when you upgrade to v11.5, check out our
Upgrade Guide.
Grafana CloudAvailable in public previewOpen sourceEnterpriseAvailable in public preview
Dashboards and visualizationsData sourcesPluginsAlerting
Migrate your Grafana OSS/Enterprise instance to Grafana Cloud in just a few clicks.
The Grafana Cloud Migration Assistant launched in Grafana 11.2 with initial support for dashboards, data sources, and folders. We’re excited to announce support for plugins and Grafana alerts.
Grafana CloudGenerally AvailableOpen sourceAvailable in public preview
Dashboards and visualizations
We’ve redesigned dashboard filters for an improved filter creation experience!
The redesigned filters are more prominent in the dashboard and filters based on the same ad hoc filter variable are more clearly related. In the new design, you can click anywhere in the filter field to begin creating a one and Grafana automatically detects which part of the filter you’re setting up. It takes fewer clicks to create a filter and the creation process using keyboard strokes is smoother than previously.
Grafana CloudGenerally AvailableOpen sourceEnterpriseGenerally Available
Dashboards and visualizations
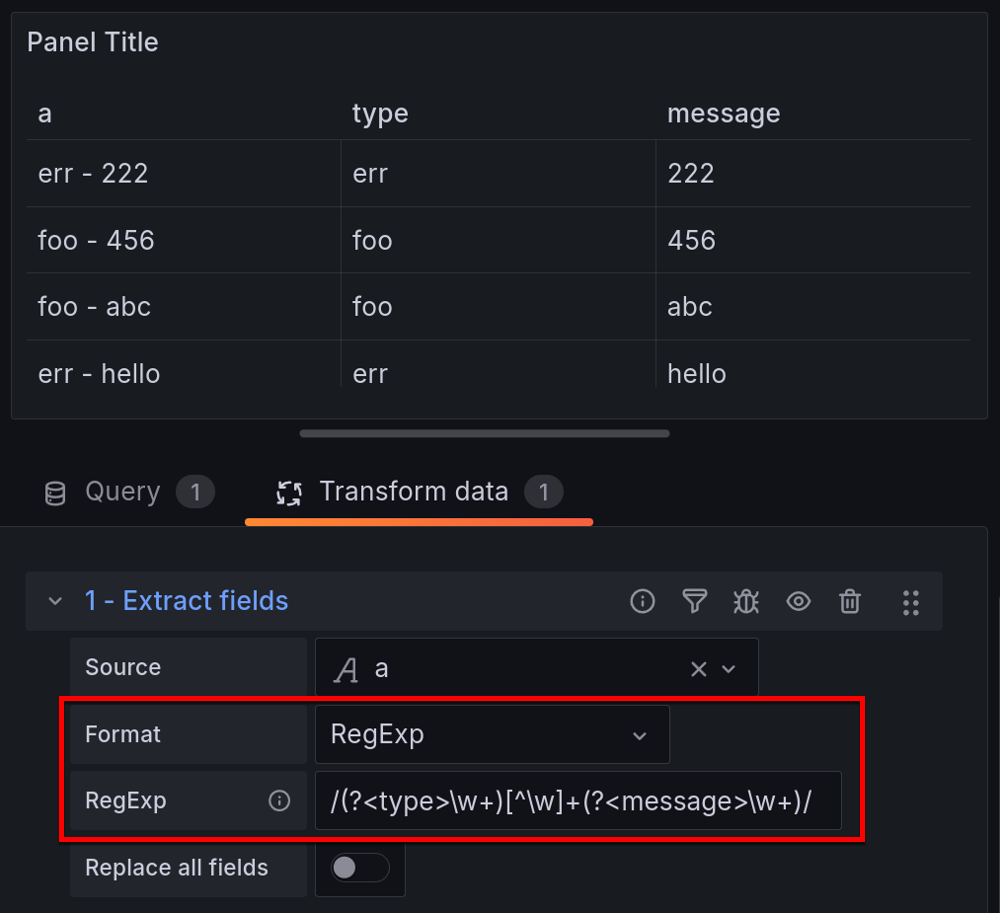
We’ve updated the Extract fields transformation with an additional RegExp format option you can use to perform more advanced parsing of the selected field, such as extracting parts of strings or splitting content into multiple fields using named capturing groups like /(?<NewField>.*)/.
Grafana CloudGenerally AvailableOpen sourceEnterpriseGenerally Available
Dashboards and visualizations
Introducing a redesigned sharing experience in Dashboards! The redesigned sharing model is leaner, easier to navigate, and more focused on what you want to do.
Grafana CloudGenerally AvailableEnterpriseGenerally Available
Dashboards and visualizations
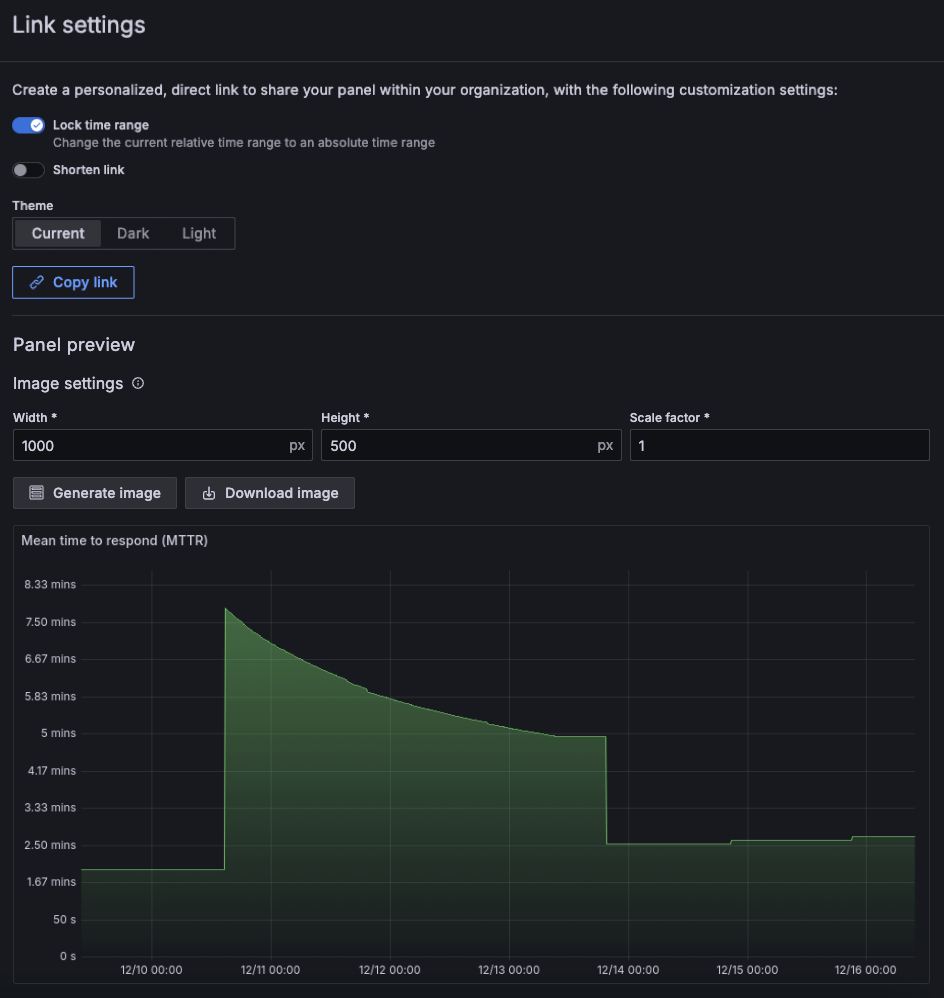
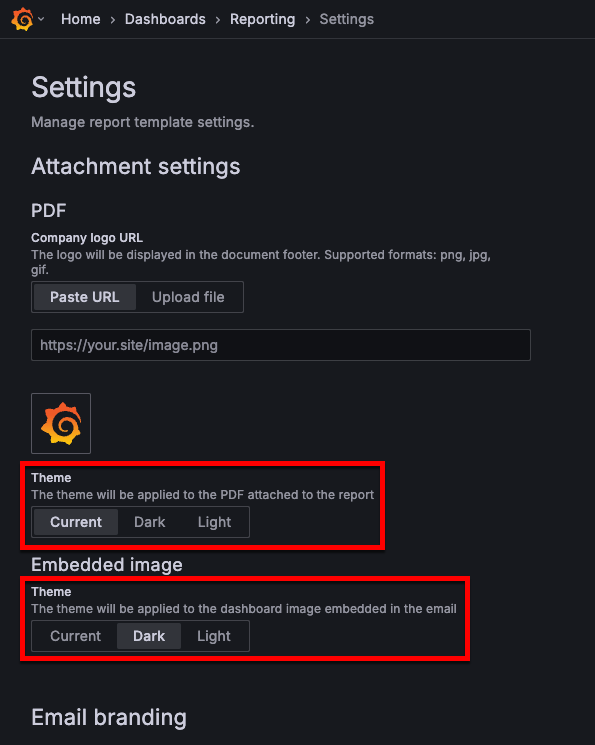
Choose the light or dark theme for PDF attachments and embedded dashboard images in Reports. The selected theme options are applied to PDFs and embedded images for all reports within your organization.
Grafana CloudGenerally AvailableEnterpriseGenerally Available
Dashboards and visualizations
In May 2024, we announced a new way of generating PDFs that introduced a major performance improvement for the PDF export feature. It also fixed all caveats related to rendering a report with panels or rows set to repeat by a variable, like rendering repeating panels inside collapsed rows.
Grafana CloudAvailable in public previewOpen sourceEnterpriseAvailable in public preview
Data sources
The Elasticsearch data source plugin now offers support for Elasticsearch’s Cross-cluster Search feature.
If you’re a big Elasticsearch user, you might have multiple clusters set up for geographical separation, different teams or departments, compliance, or scaling reasons. Previously, you needed to set up a separate data source in Grafana for each cluster. Now with cross-cluster search, you can query data across all these clusters from a single Grafana data source. This makes it simpler and more convenient to query all of your Elasticsearch logs. You can learn more about this feature in the Elasticsearch docs.
With PDC, you can establish a private, secured connection between a Grafana Cloud instance, or stack, and data sources secured within a private network. Take advantage of the convenience and power of Grafana Cloud - even if your cluster is hosted in a Virtual Private Cloud (VPC) or another private network.
Find the full list of supported data source plugins here.
Grafana CloudGenerally AvailableOpen sourceEnterpriseExperimental
Data sources
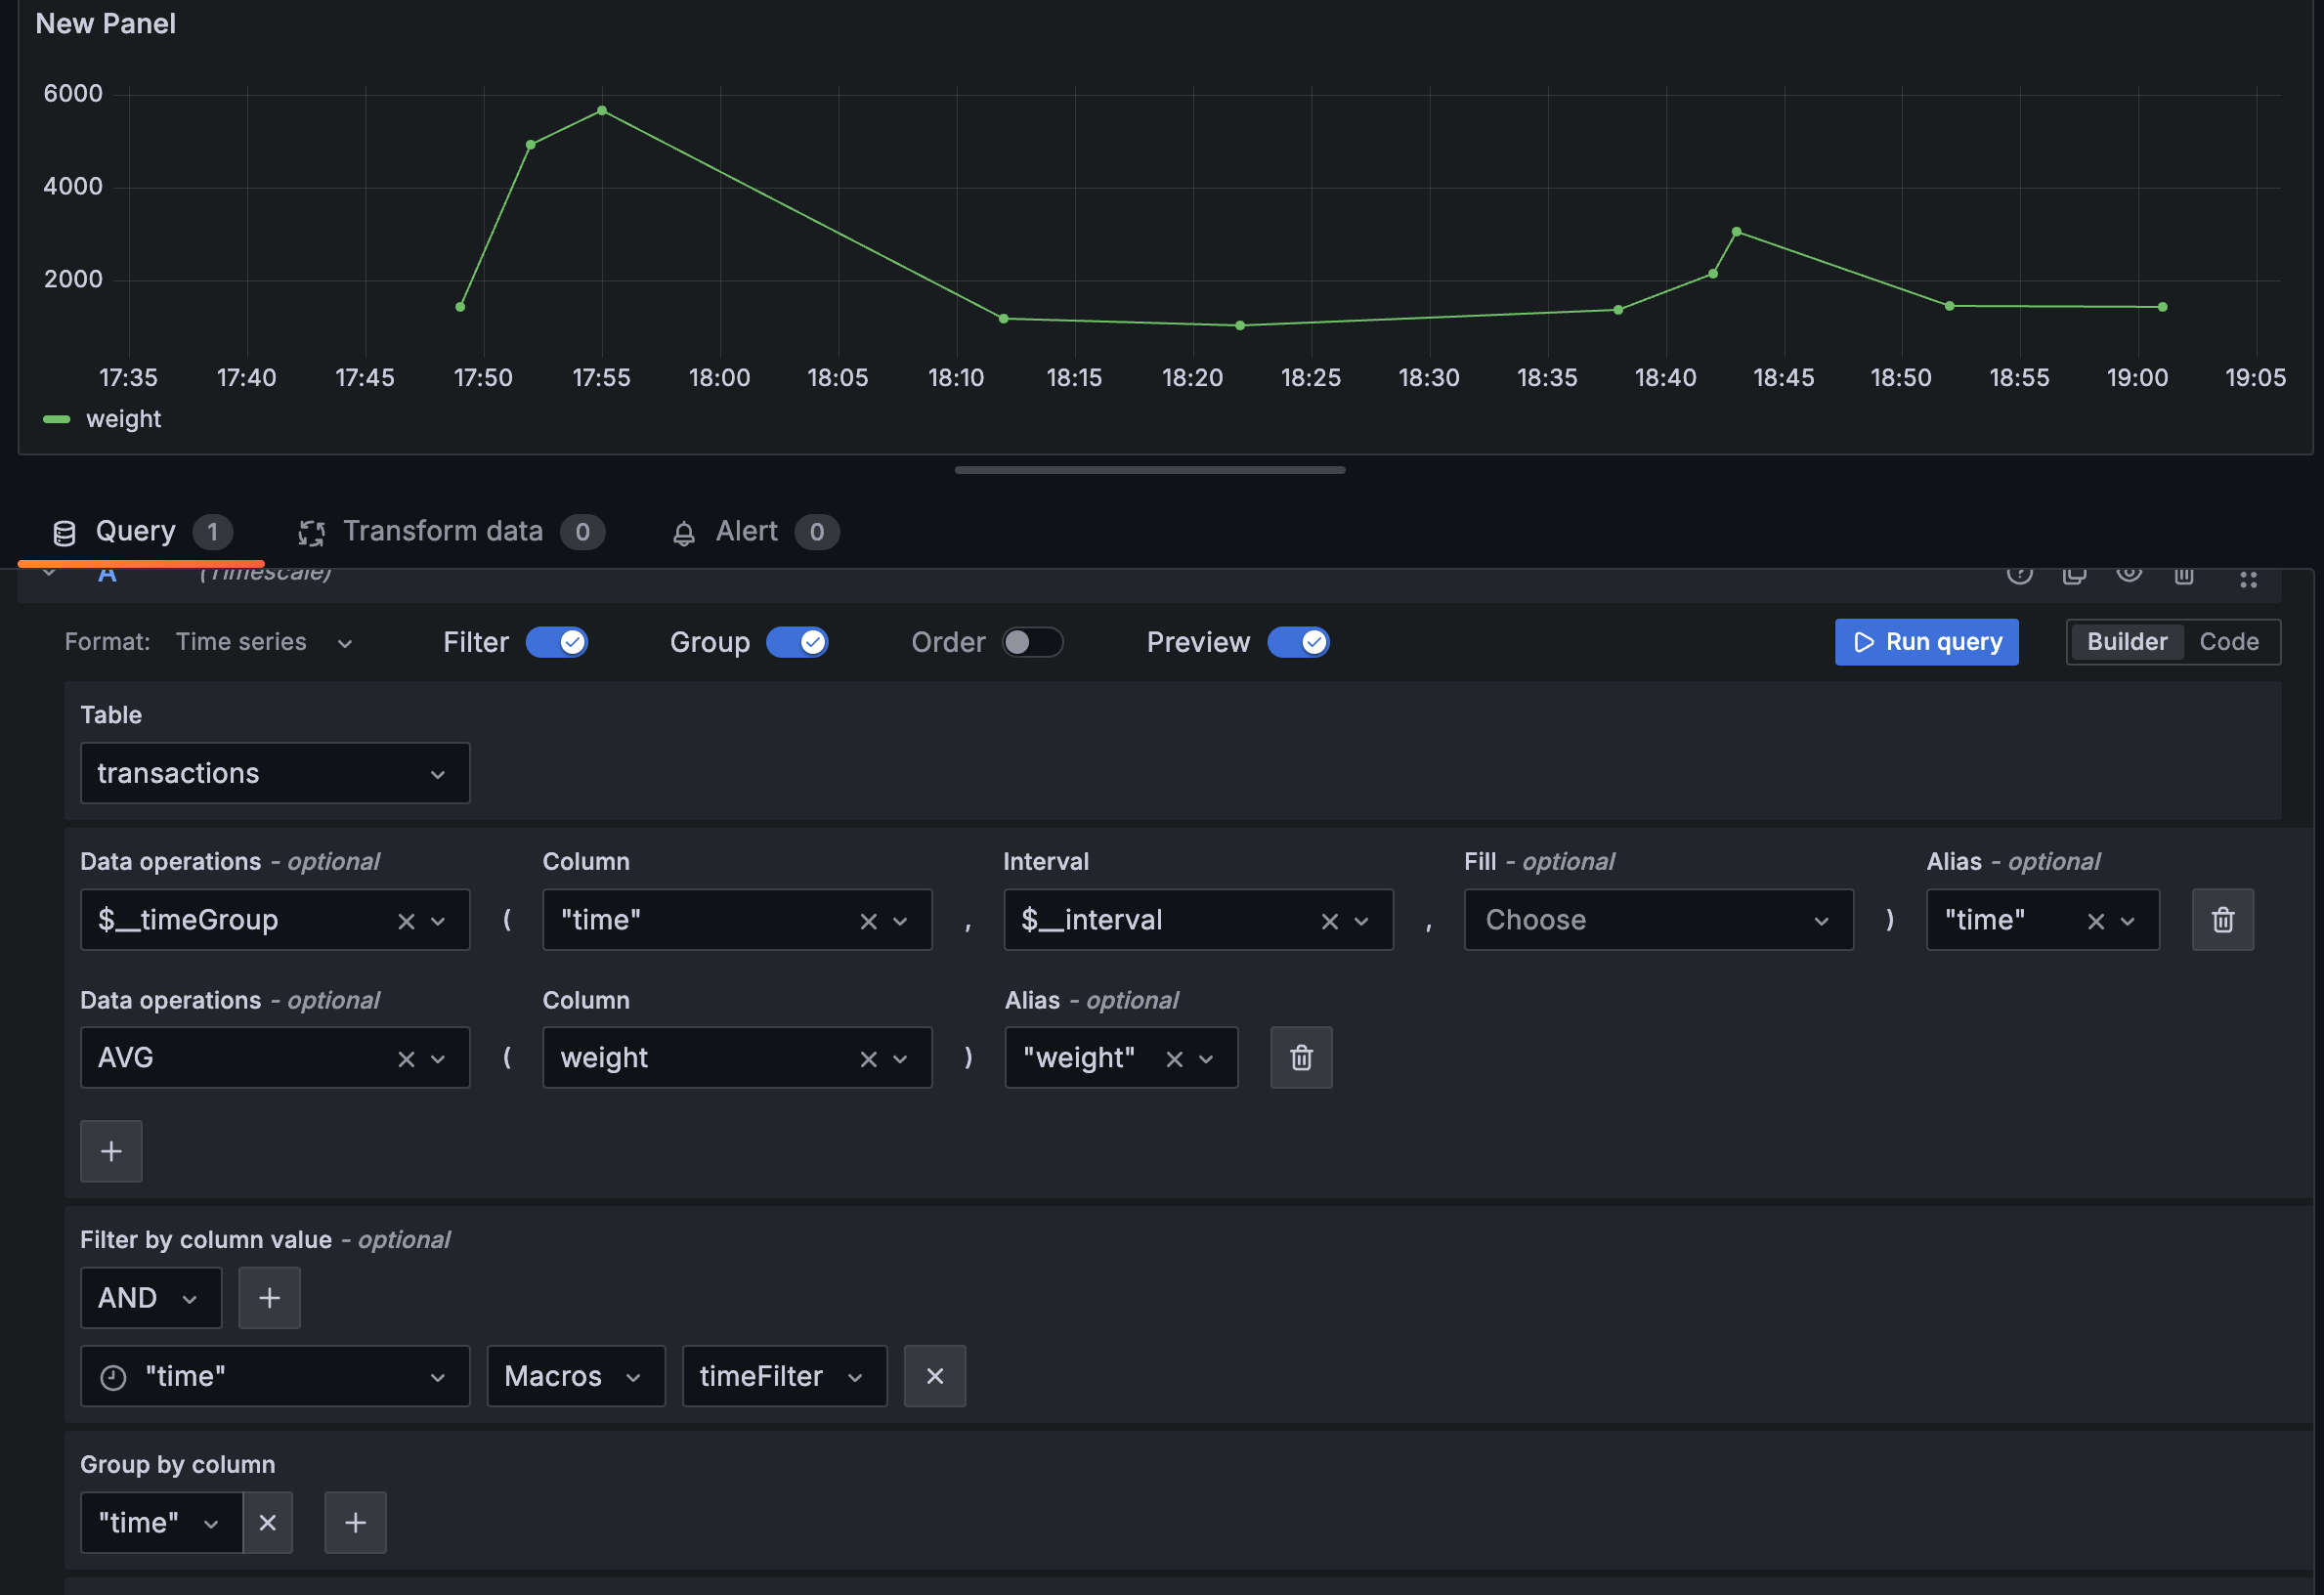
It is now possible to create time series queries from the query builder in the following data sources. MySQL, PostgreSQL, MS SQL. Use the Data operations drop-down to select a macro like $__timeGroup or $__timeGroupAlias.
Grafana CloudAvailable in public previewOpen sourceEnterpriseAvailable in public preview
Authentication and authorization
We’ve improved how Grafana manages external sessions for OAuth and SAML, enhancing compatibility with identity providers that support session management.
Grafana can now reliably manage SAML external sessions (Identity Provider sessions) by using the SessionIndex attribute in the SAML assertion and the NameID attribute in the logout request. Previously, Grafana relied on the Login attribute as the NameID and did not include the SessionIndex in the logout request, which could result in users being logged out of all their applications/IdP sessions when logging out of Grafana.
Grafana CloudAvailable in private previewOpen sourceEnterpriseAvailable in private preview
PluginsSecurity
The Plugin Frontend Sandbox is a security feature that isolates plugin frontend code from the main Grafana application. When enabled, plugins run in a separate JavaScript context, which provides several security benefits:
Grafana CloudGenerally AvailableOpen sourceEnterpriseGenerally Available
We’ve renamed the Public dashboards feature, Shared dashboards. This renaming is part of our overall redesign of dashboard sharing and aims to better align externally shared dashboards with other dashboard sharing options.