What’s new in Grafana v9.3
Welcome to Grafana 9.3! Read on to learn about our navigation overhaul, support for four new languages, new panels and transformations, several often-requested auth improvements, usability improvements to Alerting, and more. For even more detail about all the changes in this release, refer to the changelog.
New navigation
Available in beta in all editions of Grafana
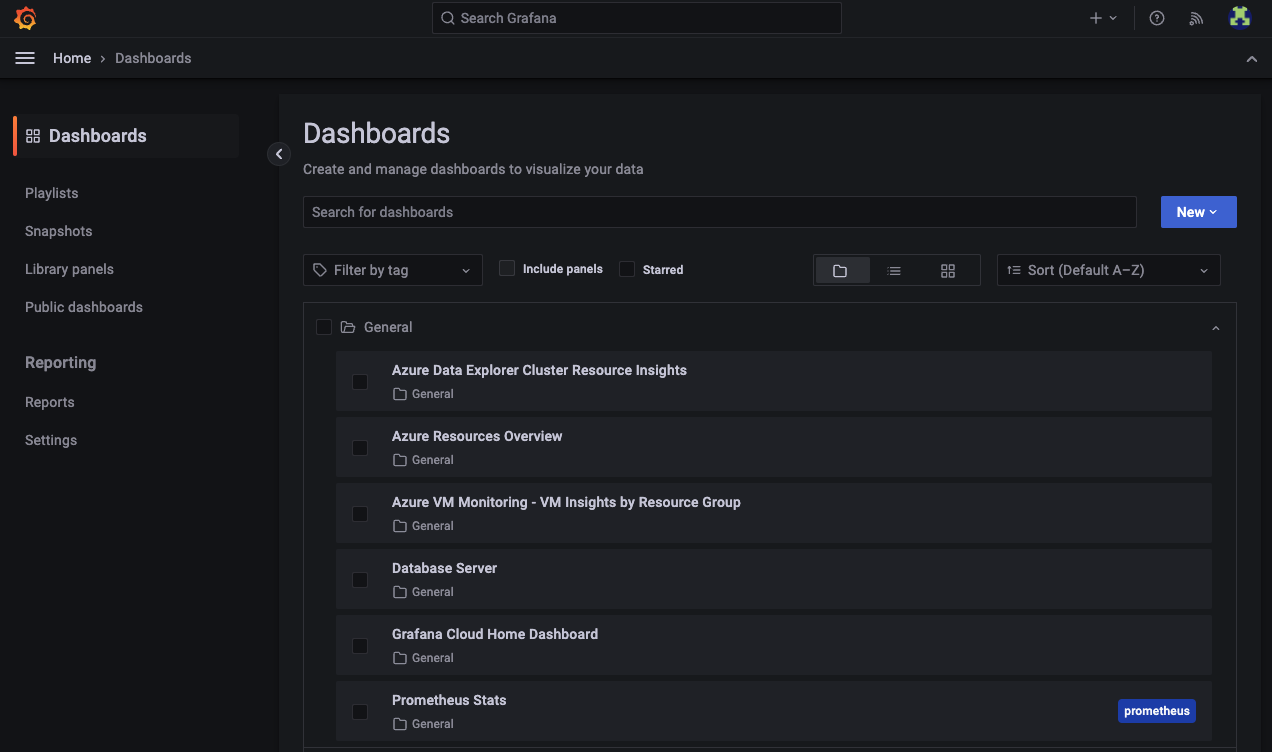
Use Grafana’s redesigned navigation to get full visibility into the health of your systems, by quickly jumping between features as part of your incident response workflow.
As Grafana has grown from a data visualization tool to an observability solution, we’ve added many new features along the way. This has resulted in pages that are visually inconsistent or hard to find. These updates to navigation give Grafana a new look and feel and make page layouts and navigation patterns more consistent.
We’ve revamped the navigation menu and grouped related tools together, making it easier to find what you need. Pages in Grafana now leverage new layouts that include breadcrumbs and a sidebar, allowing you to quickly jump between pages. We’ve also introduced a header that appears on all pages in Grafana, making dashboard search accessible from any page.
To try out Grafana’s new navigation, enable the topnav feature toggle. If you are a Cloud Advanced customer, open a ticket with our support team and we will enable it for you.
Note: The Grafana and Grafana Cloud documentation has not yet been updated to reflect changes to the navigation - these changes will roll out when the new navigation becomes generally available.
View dashboards in Spanish, French, German, and Simplified Chinese
Generally available in all editions of Grafana
We have added four new languages to Grafana: Spanish, French, German, and Simplified Chinese.
With millions of users across the globe, Grafana has a global footprint. In order to make it accessible to a wider audience, we have taken the first steps in localizing key workflows. You can now set Grafana’s language for the navigation, viewing dashboards, and some settings. This will cover the main activities a Viewer performs within Grafana.
Read more about configuring the default language for your organization and updating your profile in our documentation.
Geomap panel
Generally available in all editions of Grafana
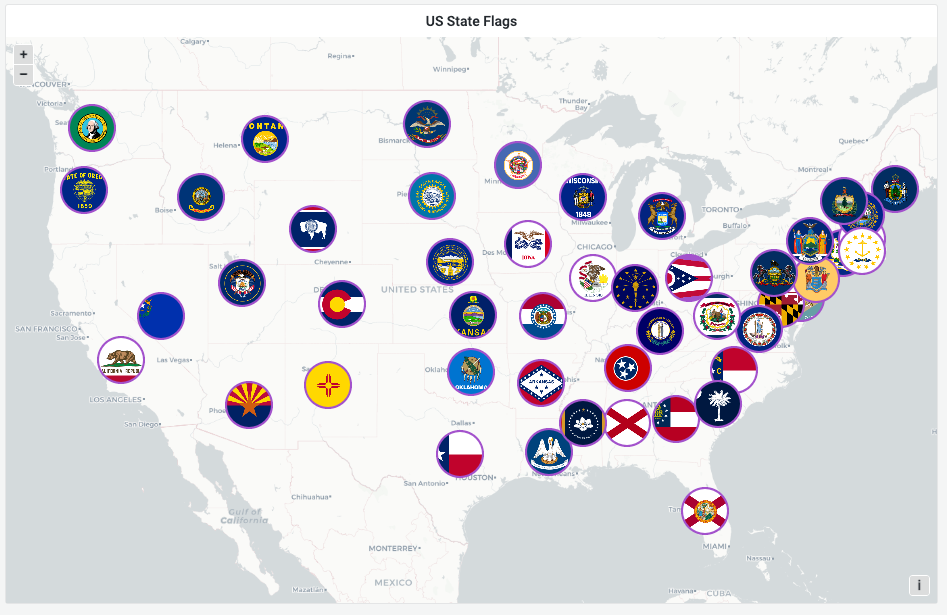
We have added a new alpha layer type in Geomap called photo layer. This layer enables you to render a photo at each data point. To learn more about the photo layer and the geomap panel, refer to Photos layer.
Canvas panel
Available in beta in all editions of Grafana
Canvas is a new panel that combines the power of Grafana with the flexibility of custom elements. Canvas visualizations are extensible form-built panels that allow you to explicitly place elements within static and dynamic layouts. This empowers you to design custom visualizations and overlay data in ways that aren’t possible with standard Grafana panels, all within Grafana’s UI. If you’ve used popular UI and web design tools, then designing Canvas panels will feel very familiar.
In Grafana v9.3, we have added icon value mapping support to the Canvas panel. This enables you to dynamically set which icon to display based on your data. To learn more about the Canvas panel, refer to Canvas.
Public dashboards improvements
We’ve made the following improvements to public dashboards.
Manage all of your public dashboards in one place
Available in experimental in Grafana Open Source, Enterprise, and Cloud Advanced
You can use Public Dashboards to make a given dashboard available to anyone on the internet without needing to sign in. In Grafana v9.3, we have introduced a new screen where you can manage all of your public dashboards. From here, you can view a list of all of the public dashboards in your Grafana instance, navigate to the underlying dashboard, see if it is enabled, link out to the public version of the dashboard, or update the public dashboard’s configuration. You can see a public dashboard’s configuration if you have view access to the dashboard itself, and you can edit its configuration if you have the Admin or Server Admin role or the “Public Dashboard writer” role if you are using RBAC in Grafana Enterprise or Cloud Advanced.
To check out this new screen and configure your public dashboards, navigate to Dashboards > Public Dashboards.
Choose to display annotations in public dashboards
Available in experimental in Grafana Open Source, Enterprise, and Cloud Advanced
Annotations are now supported in public dashboards, with the exception of query annotations. They are turned off by default, but can be turned on in your public dashboard settings.
Note that because Public Dashboards is an experimental feature, you need to enable it in Grafana using the publicDashboards feature toggle, or open a support ticket requesting public dashboards if you are a Cloud Advanced customer.
To learn more about public dashboards, refer to Public dashboards.
New transformation: Partition by values
Available in experimental in all editions of Grafana
This new transformation can help eliminate the need for multiple queries to the same datasource with different WHERE clauses when graphing multiple series.
Consider a metrics SQL table with the following data:
Prior to v9.3, if you wanted to plot a red trendline for US and a blue one for EU in the same TimeSeries panel, you would likely have to split this into two queries:
   SELECT Time, Value FROM metrics WHERE Time > ‘2022-10-20’ AND Region=’US’
   SELECT Time, Value FROM metrics WHERE Time > ‘2022-10-20’ AND Region=’EU’
This approach also requires you to know ahead of time which regions exist in the metrics table.
With the partition by values transformer, you can issue a single query and split the results by unique (enum) values from one or more columns (fields) of your choosing. In this case, Region.
SELECT Time, Region, Value FROM metrics WHERE Time > ‘2022-10-20’Reporting: Zoom in and out to fit your data better into a PDF
Generally available in Grafana Enterprise, Cloud Pro, and Cloud Advanced.
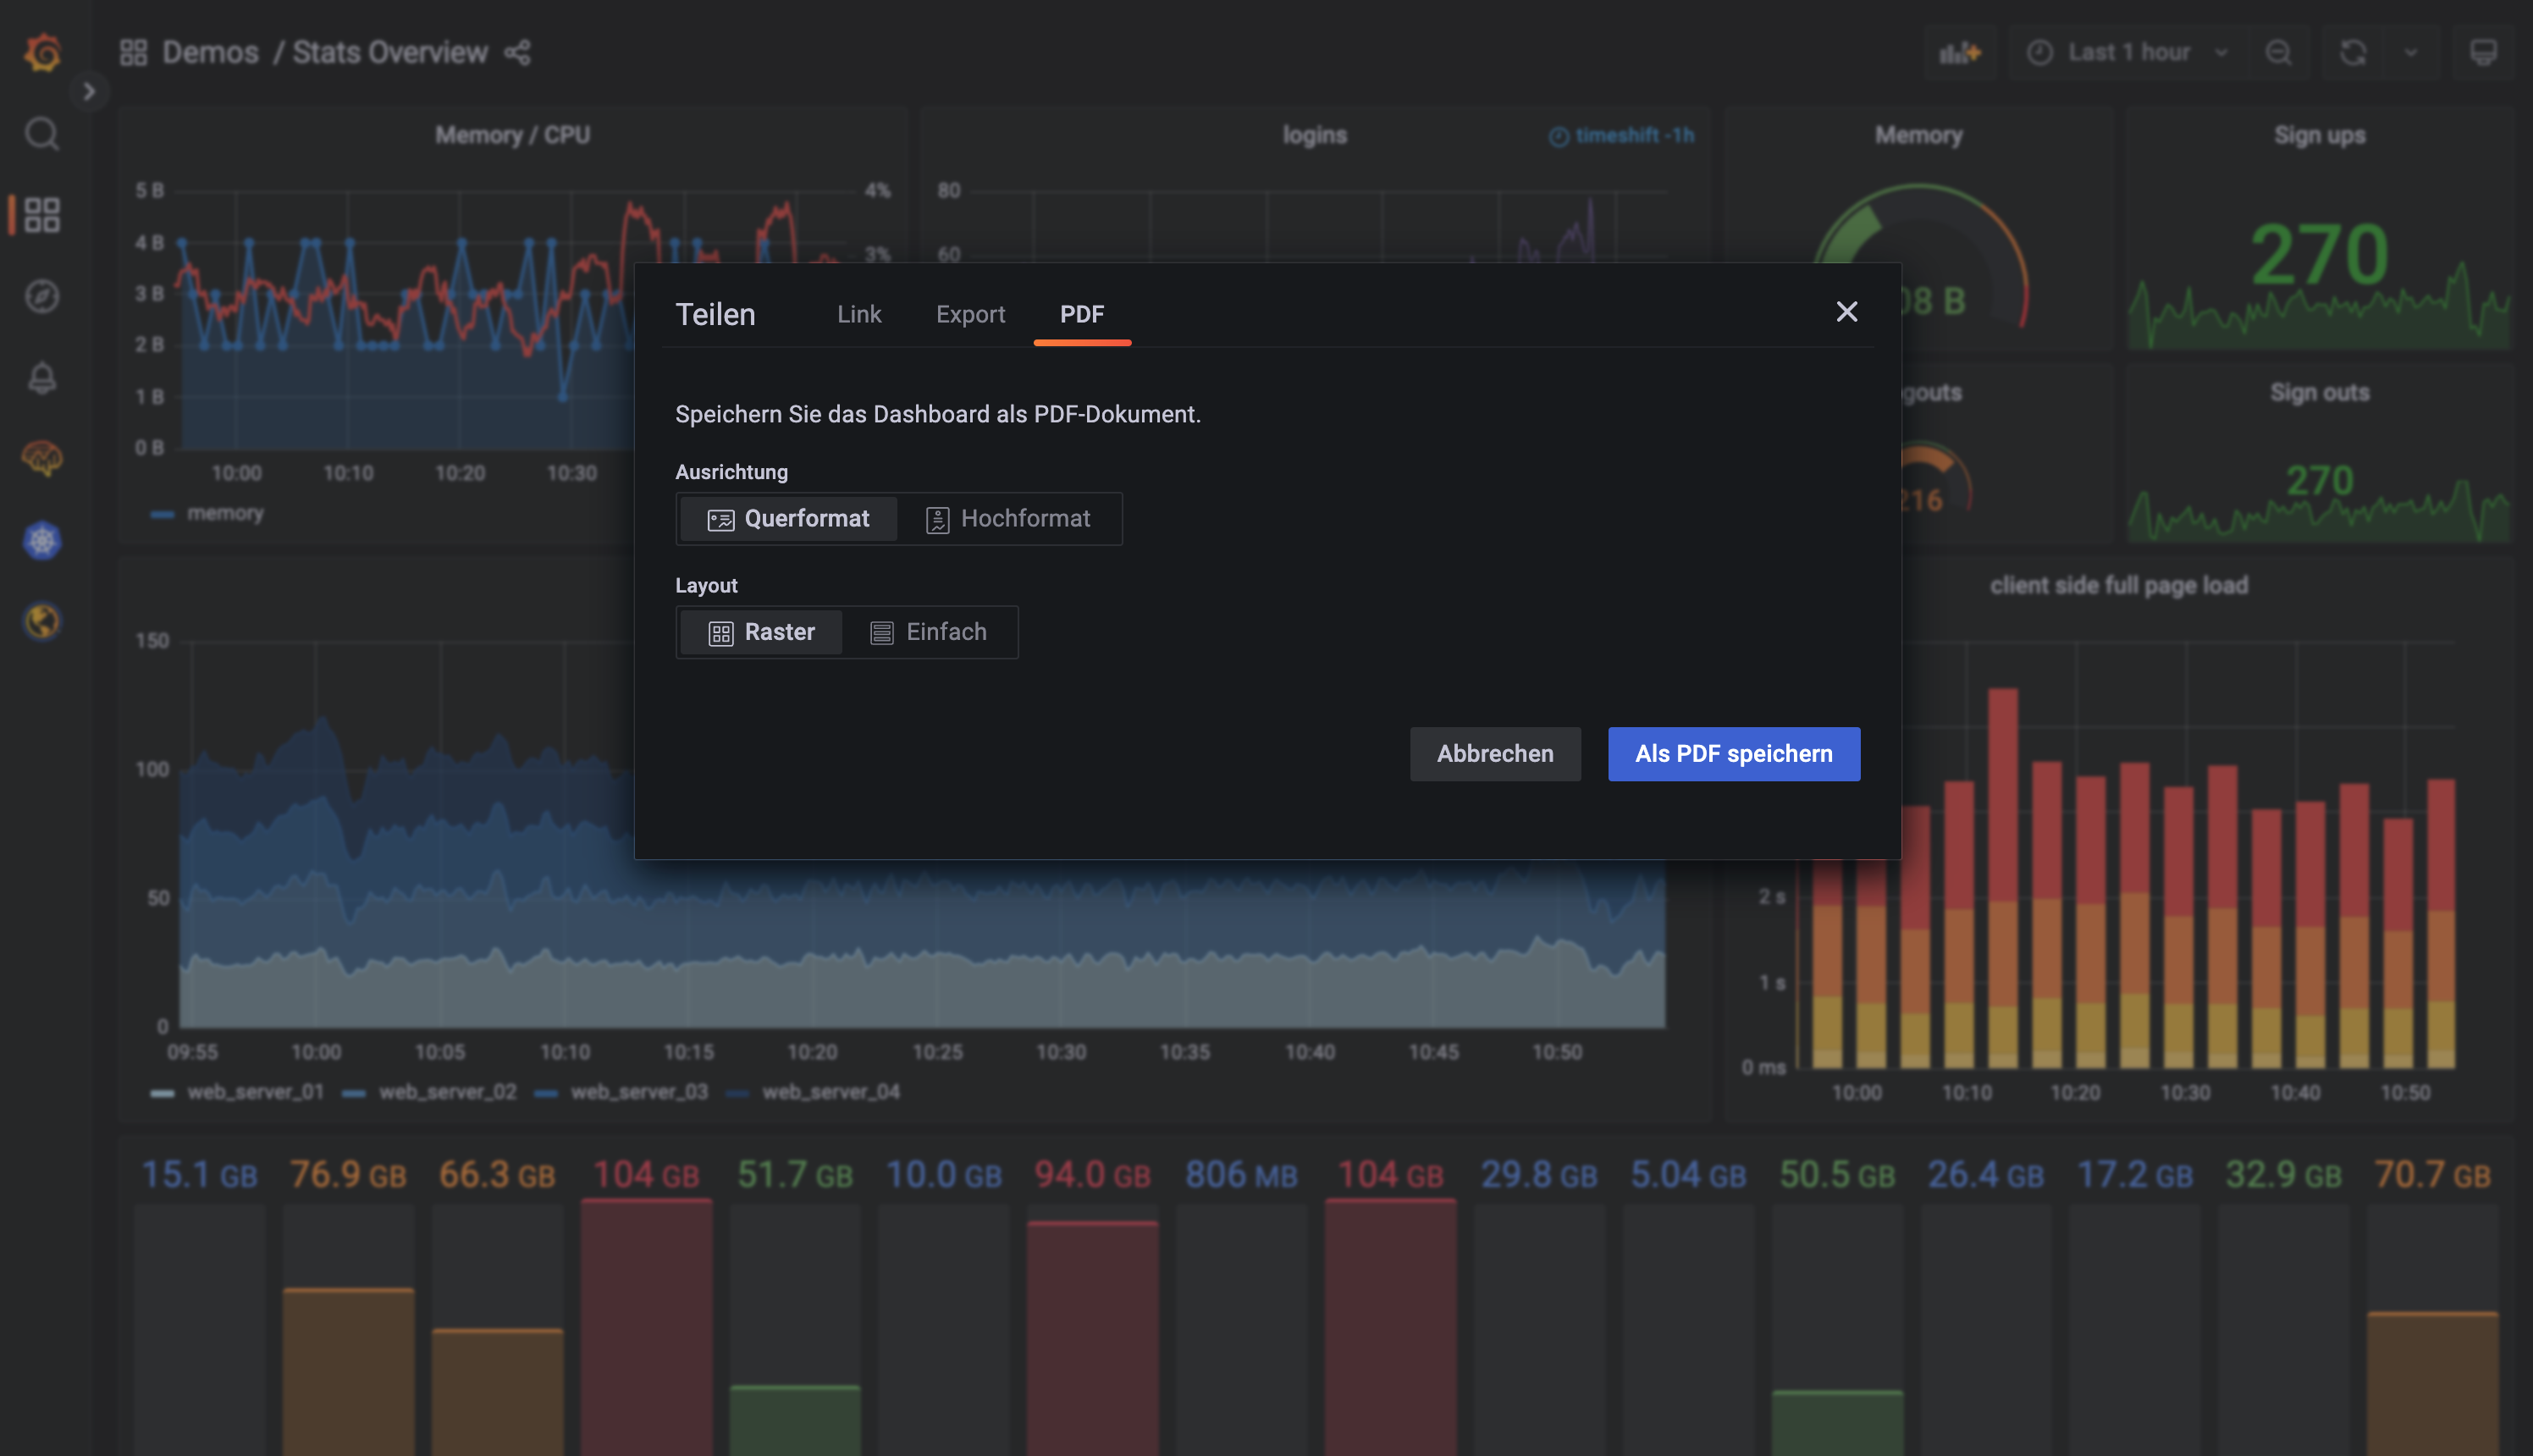
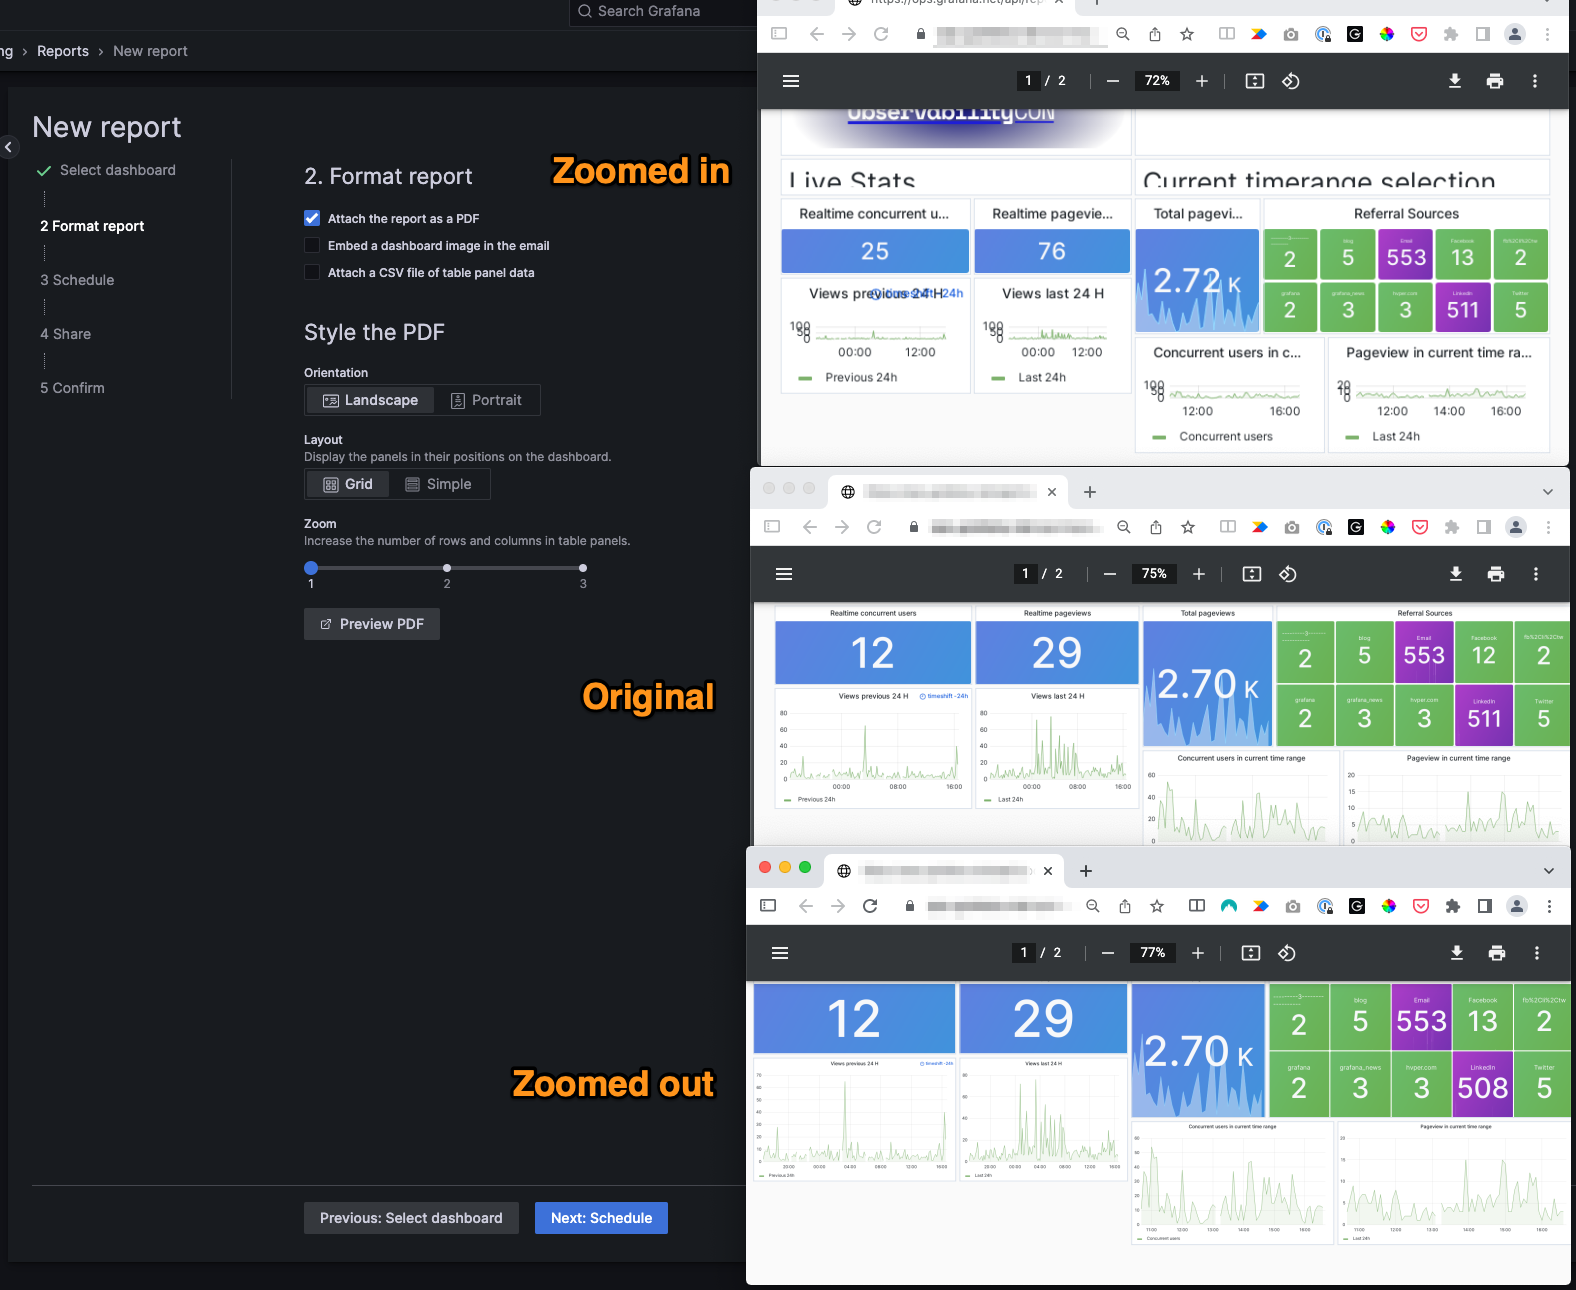
Because dashboards appear on a screen and reports are PDFs, it can be challenging to render data just the way you want to. Sometimes the report doesn’t show enough columns in a table, or the titles appear too small. Now you can adjust the scale of your report to zoom in and make each text field and panel larger or zoom out to show more data.
The zoom feature is located in the Format Report section of your reporting configuration. To learn more about reporting, refer to Create and manage reports.
Users and access
We’ve made the following improvements to users and access.
OAuth: token handling improvements
Generally available in all editions of Grafana
As part of our efforts to improve the security of Grafana, we are introducing a long-awaited feature that enhances Grafana’s OAuth 2.0 compatibility. When a user logs in using an OAuth provider, Grafana verifies on each request that the user’s access token has not expired. Grafana uses the refresh token provided (if any exists) when an access token expires to obtain a new access token.
Because this feature introduces a breaking change, it is behind the accessTokenExpirationCheck feature toggle and is disabled by default. Enabling this functionality without configuring refresh tokens for the specific OAuth provider will sign users out after their access token has expired, and they would need to sign in again every time.
Complete documentation on how to configure obtaining a refresh token can be found on the authentication configuration page, in the instructions for your Oauth identity provider.
Resolve user conflicts in Grafana’s CLI
In the older versions of Grafana, usernames were case-sensitive. This created conflicts, where a user might sign in using two different methods (like SAML and OAuth) and have two accounts created, like elastigirl@incredibles.com and ElastiGirl@incredibles.com. Users in this situation might think they have lost their preferences and permissions. If this has occurred in your Grafana instance, you can use a new Grafana CLI command to resolve user identity conflicts between users within Grafana.
Note: If you use Grafana Cloud or you run Grafana with MySQL as your database, you will not experience any user identity conflicts and you do not need to use this tool.
# lists all the conflicting users
$ grafana-cli user-manager conflicts list

# creates a conflict patch file to edit
$ grafana-cli user-manager conflicts generate-file

# reads edited conflict patch file for validation
$ grafana-cli user-manager conflicts validate-file <filepath>

# ingests the conflict users file. Can be executed once per file and will change the state of the database.
$ grafana-cli user-manager conflicts ingest-file <filepath>
LDAP: Role mapping improvements
Generally available in all editions of Grafana
If you use an LDAP directory to authenticate to Grafana but prefer to assign organizations and roles in the Grafana UI or via API, you can now skip user organization role synchronization with your LDAP directory.
Use the skip_org_role_sync LDAP authentication configuration option
when configuring LDAP authentication to prevent the synchronization between your LDAP groups and organization roles
and make user roles editable manually.
Azure AD OAuth2: New option to always fetch groups from the Graph API
Generally available in all editions of Grafana
If you use Azure AD OAuth2 authentication and use SecurityEnabled groups that you don’t want Azure to embed in the
authentication token, you can configure Grafana to use Microsoft’s Graph API instead.
Use the force_use_graph_api configuration option
when configuring Azure AD authentication to force Grafana to fetch groups using Graph API.
RBAC: List token’s permissions
Generally available in Grafana Enterprise and Cloud Advanced
We added a new endpoint to help users diagnose permissions-related issues with user and token authorization. This endpoint allows users to get the full list of RBAC permissions associated with their token.
For more details, refer to Debug the permissions of a service account token.
RBAC with Terraform: Extended support for provisioning permissions
Generally available in Grafana Enterprise and Cloud Advanced
All Grafana users can now use the latest release of Terraform’s Grafana provider (version 1.31.1+) to provision user and team access to service accounts.
This allows full management of service accounts through Terraform - from creating a service account and allowing users to access it to assigning roles to the service account and generating service account tokens.
Grafana Enterprise and Cloud Pro and Advanced users can now provision access to data sources for Grafana’s Viewer, Editor, and Admin basic roles, as well as assign Edit permission.
We have also added documentation on provisioning RBAC roles and role assignments to guide our Grafana Enterprise and Cloud Pro and Advanced users through this process.
Finally, we have fixed several access control related bugs to ensure a smoother provisioning experience.
Alerting
All of these new alerting features are generally available in all editions of Grafana.
Support for Webex Teams
You can now use Cisco Webex Teams as a contact point, to send alerts to a Webex Teams space.
Edit alert rules created using the provisioning API
Edit API-provisioned alert rules from the Grafana UI. To make a provisioned alert editable, add the x-disable-provenance header to the following requests when creating or editing your alert rules in the API:
POST /api/v1/provisioning/alert-rules
PUT /api/v1/provisioning/alert-rules/{UID}
Support values in notification templates
Add alert values to notification templates, so that you can create a single template that prints the annotations, labels, and values for your alerts in a format of your choice.
View notification errors
When an alert fails to fire, see when something is wrong with your contact point(s) and the reason for the error. The Receivers API contains information on the error, including a time stamp, duration of the attempt, and the error. You can also view the errors for each contact point in the UI.

Redesign of the expressions pipeline
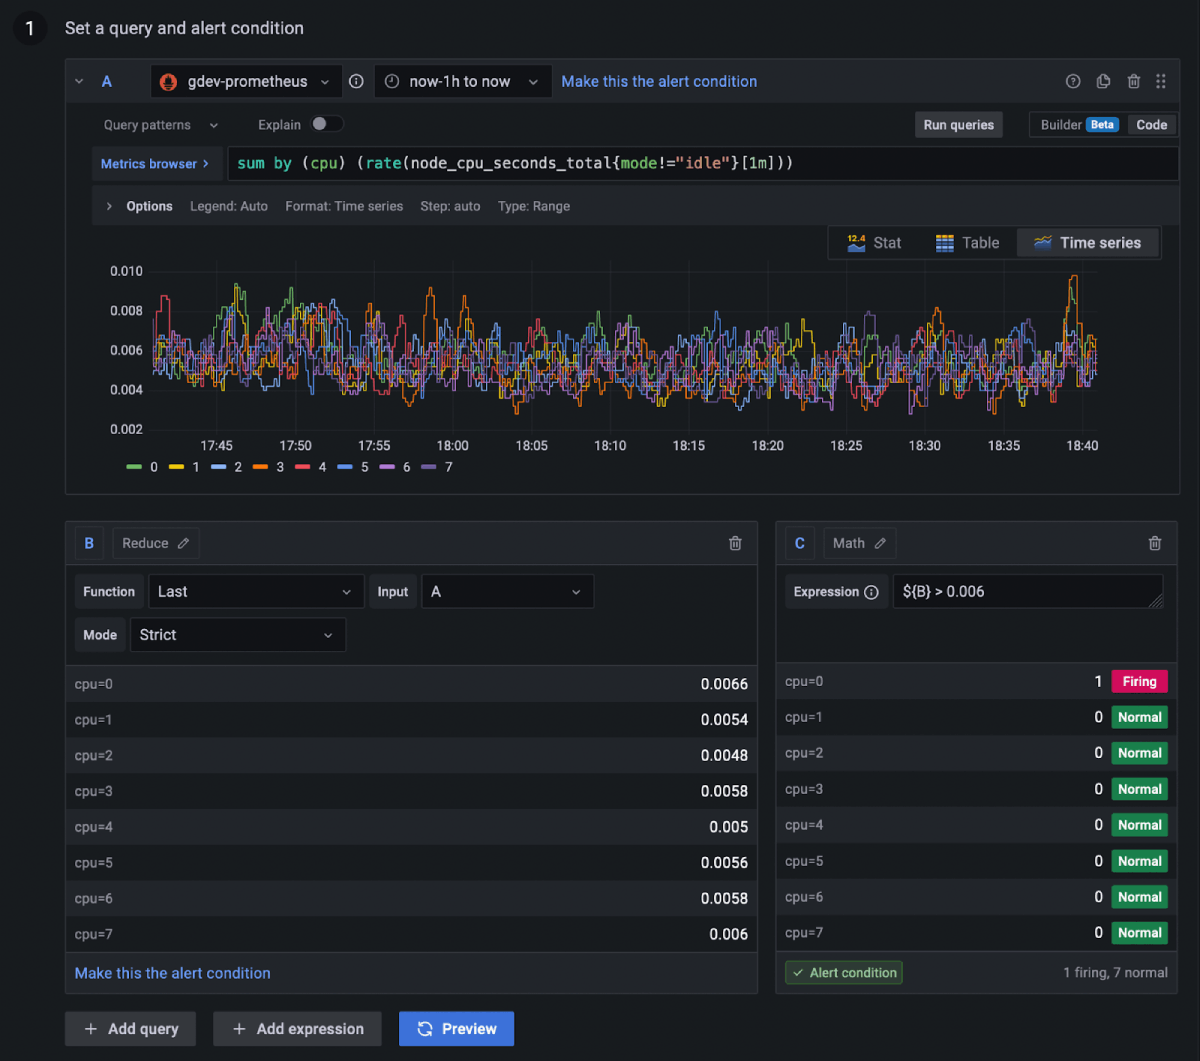
We’ve redesigned the expressions pipeline editor to combine the expressions editor and the preview into a single view.
