
What’s new in Grafana v8.0
This topic includes the release notes for Grafana v8.0. For all details, read the full CHANGELOG.md.
Grafana OSS features
These features are included in the Grafana open source edition.
Grafana v8.0 alerts
The new alerts in Grafana 8.0 are an opt-in feature that centralizes alerting information for Grafana managed alerts and alerts from Prometheus-compatible data sources in one UI and API. You can create and edit alerting rules for Grafana managed alerts, Mimir alerts, and Loki alerts as well as see alerting information from prometheus-compatible data sources in a single, searchable view. For more information, on how to create and edit alerts and notifications, refer to Grafana Alerting.
As part of the new alert changes, we have introduced a new data source, Alertmanager, which includes built-in support for Prometheus Alertmanager. It is presently in alpha and it not accessible unless alpha plugins are enabled in Grafana settings. For more information, refer to Alertmanager data source.
Note: Out of the box, Grafana still supports old Grafana alerts. They are legacy alerts at this time, and will be deprecated in a future release.
To learn more about the differences between new alerts and the legacy alerts, refer to What’s New with Grafana 8 Alerts.
Library panels
Library panels allow users to build panels that can be used in multiple dashboards. Any updates made to that shared panel will then automatically be applied to all the dashboards that have that panel. For instructions on how to create, add, unlink and manage library panels, refer to Library panels.
Real-time streaming
Data sources can now send real-time updates to dashboards over a websocket connection. This can be used with the MQTT data source.
In addition to data source integration, events can be sent to dashboards by posting metrics to the new live endpoint: /api/live/push endpoint.
These metrics will be broadcast to all dashboards connected to that stream endpoint.
For more information about real-time streaming, refer to Grafana Live documentation.
Prometheus metrics browser
The Prometheus metrics browser allows you to quickly find metrics and select relevant labels to build basic queries. If supported by your Prometheus instance, each metric will show its HELP and TYPE as a tooltip. For more information, refer to Metrics browser documentation.
Bar chart visualization (beta)
The Bar chart panel is a new visualization that supports categorical data. It only supports one data frame and it needs to have at least one string field that will be used as the category for an X or Y axis and one or more numerical fields.

To use it with time series you first have to add a Reduce transform.
For more information, refer to Bar chart visualization.
State timeline visualization (beta)
The State timeline visualization shows discrete state changes over time. Each field or series is rendered as a unique horizontal band. This panel works well with string or boolean states, but it can also be used with time series data. When used with time series data, the thresholds are used to turn the numerical values into discrete state regions.
This panel also takes advantage of the new value mapping features that allow you to color string and boolean values.
Example with string values:
With time series data and thresholds:
For more information, refer to State timeline visualization.
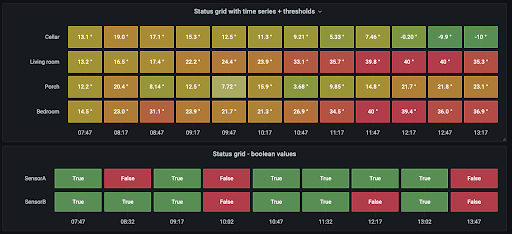
Status history visualization (beta)
A sister panel to the state timeline is the new Status history panel visualization. It can display periodic states in a grid view. It supports both numerical, string, or boolean states. You can assign colors using value mappings, thresholds, or gradient color. For more information, refer to Status history. schemes.
Histogram visualization (beta)
This hidden feature of the old Graph panel is now a standalone visualization. It combines a histogram transformation and bar chart visualization into a single, integrated, easy-to-use panel. There is also a new standalone histogram transformation that can be paired with any visualization.

For more information, refer to Histogram
Time series visualization updates
The Time series is out of beta! We are removing the Beta tag and graduating the Time series visualization to a stable state.
- Time series is now the default visualization option, replacing the Graph (old).
- The Time series panel now supports stacking. For more information, refer to Graph stacked time series.
- You can now add alerts in the Time series panel, just like the old Graph panel.
- Updated connect null values options.
- We added support for a shared crosshair and a tooltip that’s now smarter when it comes to data display in the tooltip.
- Various performance improvements.
Time series panel topics have been updated as a result of these changes.
Node graph visualization updates
You can now expand the node graph for the displayed trace when using the Trace to logs feature. Depending on the data source, this can show spans of the trace as nodes in the graph, or as some additional context like service map based on the current trace.
We also added a grid view and the ability to explore hidden nodes.
Tracing in Explore and Node graph were updated as a result of these changes.
Pie chart visualization updates
The Pie chart is out of beta! We are removing the beta tag and graduating the Pie chart visualization to a stable state.
Panel editor updates
Lots of panel editor improvements, heavily informed by user research and community feedback.
- All options are now shown in a single pane.
- You can now search panel options.
- The Value mappings feature has been completely redesigned. For more information, refer to Configure value mappings.
- New Table view option is always available.
The Panels section has been updated to reflect these changes.
Look and feel update
Grafana 8 comes with a refreshed look and feel, including themes changed to be more accessible. The improved Grafana UI brings a number of adjustments and tweaks that make the application even more fun to use. Enjoy the new home dashboard design!
Under the hood, the new theme architecture enables us to bring more sophisticated themes control in the future.
Download logs
When you inspect a panel, you can now download log results as a text (.txt) file.
Download log results was added as a result of this feature.
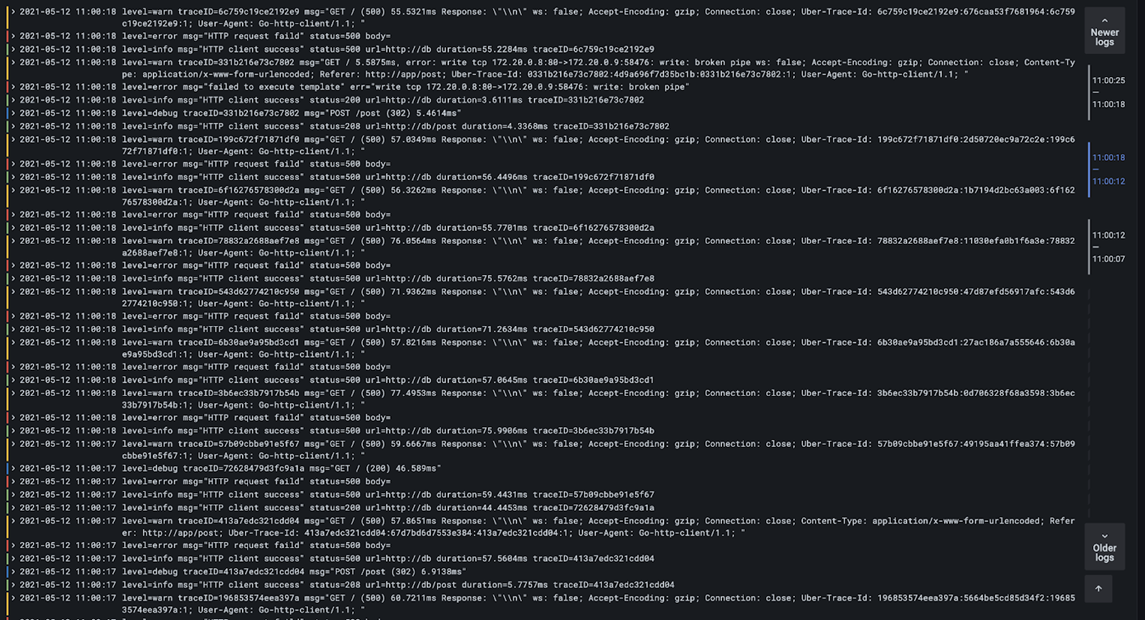
Inspector in Explore
The new Explore inspector helps you understand and troubleshoot your queries. You can inspect the raw data, export that data to a comma-separated values (CSV) file, export log results in text format, and view query requests.
Inspector in Explore was added as a result of this feature.
Explore log improvements
Log navigation in Explore has been significantly improved. We added pagination to logs, so you can click through older or newer logs as needed.
Logs in Explore was updated as a result of these changes.
Plugin catalog
You can now use the Plugin catalog app to easily manage your plugins from within Grafana. Install, update, and uninstall plugins without requiring a server restart.
Plugin catalog was added as a result of this feature.
Performance improvements
Grafana 8.0 includes many performance enhancements.
Initial startup and load performance
We reduced the Grafana initial download size massively, approximately 40%. This means that on slower or mobile connections, the initial login page or home dashboard will load much faster.
All panels that have migrated from Flot to uPlot will also render two to three times faster because the library is much more efficient. Right now, this includes the Time series, Stat, Timeline, Histogram, and Barchart panel visualizations.
Operational and runtime performance
These improvements affect any subsequent data updates or interactions, including:
- Streaming performance
- General speed of interaction, such as zooming, tooltips, synchronized cursors, and panel updates while editing
Data source updates
The following data source updates are included with this Grafana release.
Azure Monitor data source
Azure Resource Graph is now supported in the Azure Monitor data source. This is a service in Azure that is designed to extend Azure Resource Management by providing efficient and performant exploration of your Azure resources.
The Azure Monitor data source now supports Managed Identity for users hosting Grafana in Azure to simplify and secure configuring Azure Monitor in Grafana.
Also, in addition to querying Log Analytics Workspaces, you can now query the logs for any individual supported resource, or for all resources in a subscription or resource group.
Note: In Grafana 7.5 we started the deprecation for separate Application Insights queries, in favor of querying Application Insights resources through Metrics and Logs. In Grafana 8.0 new Application Insights and Insights Analytics queries cannot be made, and existing queries have been made read-only. For more details, refer to the Deprecating Application Insights.
Azure Monitor data source was updated as a result of these changes.
Elasticsearch data source
Elasticsearch data source and Provisioning were updated as a result of these changes.
Use semver strings to identify Elasticsearch version
We changed how the configured Elasticsearch version is handled. You can now specify via provisioning the full semver string version of your instance (such as “7.12.1”) instead of the old version format based on numbers. There’s no manual intervention needed, the old options will be correctly recognized.
Generic support for template variables
You can now use a different interpolation method to use template variables in a more extensive way. You can now use template variables in every query editor field that allows free input.
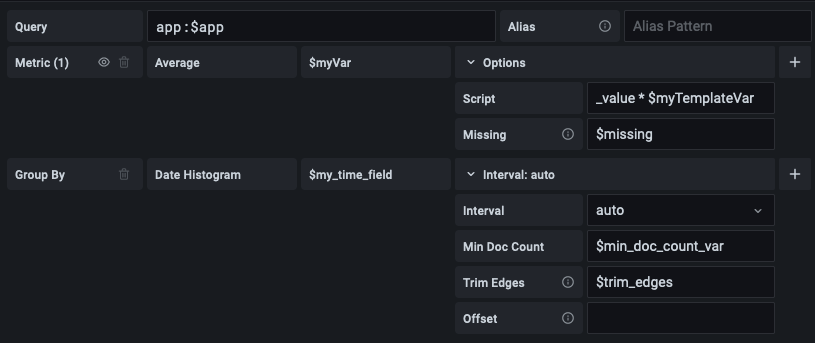
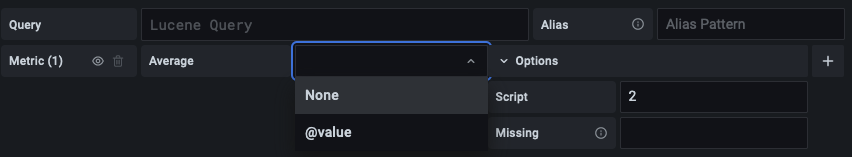
Allow omitting field for metrics that support inline scripts
Metric aggregations can be specified without a field if a script is provided. You can now deselect fields for metrics aggregation when they support scripting.
Previously this was only possible when adding a new metric without selecting a field, because once selected, the field could not have been removed.
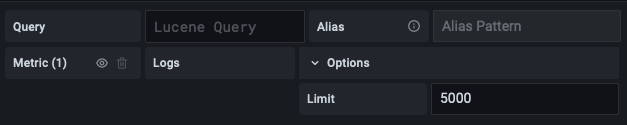
Allow setting a custom limit for log queries
You can now set a custom line limit for logs queries instead of accepting the previously hard-coded 500. We also simplified the query editor to only show relevant fields when issuing logs queries.
Guess field type from first non-empty value
Response values were always interpreted as strings in Elasticsearch responses, which caused issues with some visualization types that applied logic based on numeric values. We now apply some heuristics to detect value types from the first non-empty value in each response.
Google Cloud Monitoring data source
In a prior release, Cloud Monitoring added preprocessing support in their query editor. This capability has been added to the Cloud Monitoring data source in Grafana.
Whenever a metric is selected in the query editor, a suitable preprocessing option is automatically selected for you. To avoid breaking changes, preprocessing is not enabled by default on existing queries. If you want to use preprocessing for existing queries, you have to manually select one in the query editor.
Google Cloud Monitoring data source was updated as a result of this change.
Graphite data source
Graphite data source was updated as a result of these changes.
Variable metric names expand
Values for dashboard variables can be now populated using the Graphite expand API. Expand API is used when the metric query is wrapped in expand() function.
This way, values can contain not only the last matching node from the metric query, but also the full path of the metric. It can also be narrowed down to a specific node with a regular expression.
Map Graphite queries to Loki
Graphite queries are now automatically transformed to Loki queries according to user-defined rules when the data source changes in Explore.
Jaeger data source
You can now use more parameters to find traces.
Jaeger data source was updated as a result of this change.
Authentication updates
This Grafana release includes the following authentication updates.
JWT
JWT is a new authentication option in Grafana.
Added JWT authentication support
You can now configure Grafana to accept a JWT token provided in the HTTP header.
JWT authentication was added and Configuration was updated as a result of this feature.
OAuth
Generic OAuth authentication has been updated as a result of these changes.
Added OAuth support for empty scopes
You can now configure generic OAuth with empty scopes. This allows OAuth Identity Providers that don’t use or support scopes to work with Grafana authentication.
Added OAuth support for strict parsing of role_attribute_path
You can now configure generic OAuth with strict parsing of the role_attribute_path. By default, if the role_attribute_path property does not return a role, then the user is assigned the Viewer role. You can disable the role assignment by setting role_attribute_strict = true. It denies user access if no role or an invalid role is returned.
Singlestat panel deprecated
Support for Singlestat panel has been discontinued. When you upgrade to version 8.0, all existing Singlestat panels automatically becomes Stat panels. Stat panel is available as plugin.
Grafana license update
Grafana has updated its license from Apache 2.0 to the GNU Affero General Public License (AGPL). Please see the related blog post, Q&A and license for more details.
Enterprise features
These features are included in the Grafana Enterprise edition.
Role-based access control
You can now add or remove detailed permissions from Viewer, Editor, and Admin org roles, to grant users just the right amount of access within Grafana. Available permissions include the ability to view and manage Users, Reports, and the Access Control API itself. Grafana will support more and more permissions over the coming months.
Role-based access control docs were added as a result of this feature.
Data source query caching
Grafana caches the results of backend data source queries so that multiple users viewing the same dashboard or panel do not make multiple submissions of the same query to the data source (like Splunk or Snowflake) itself.
This results in faster average load times for dashboards and fewer duplicate queries overall to data sources, which reduces cost and the risk of throttling, reaching API limits, or overloading your data sources.
You can enable caching per data source, and time-to-live (TTL) can be configured globally and per data source. Query caching can be set up with Redis, Memcached, or a simple in-memory cache.
For more information, refer to the Data source query caching docs.
Reporting updates
When creating a report, you can now choose to export Table panels as .csv files attached to your report email. This makes it easier for recipients to view and work with that data.
You can also link back to the dashboard directly from the email, for users who want to see the data live in Grafana. This release also includes some improvements to the Reports list view.
For more information, refer to Reporting docs.
License restrictions clarification in the docs
The Grafana Enterprise documentation has been updated to describe more specifically how licensed roles are counted, how they can be updated, and where you can see details about dashboard and folder permissions that affect users’ licensed roles.
For more information, refer to License restrictions docs.
Breaking changes
The following breaking changes are included in this release.
Variables
- Removed the Value groups/tags feature from variables. Any tags will be removed.
- Removed the
neverrefresh option for query variables. Existing variables will be migrated and any stored options will be removed.
Documentation was updated to reflect these changes.
Elasticsearch: Use application/x-ndjson content type for multi-search requests
For multi-search requests, we now use the correct application/x-ndjson content type instead of the incorrect application/json. Although this should be transparent to most of the users, if you are running Elasticsearch behind a proxy, then be sure that your proxy correctly handles requests with this content type.
Prometheus: Update default HTTP method to POST for existing data sources
The default HTTP method for Prometheus data source is now POST, previously it was GET. The POST APIs are there since January 2018 (Prometheus 2.1.0) and they have fewer limitations than the GET APIs. Users with Prometheus instance with version < 2.1.0 that use the default HTTP method should update their HTTP method to GET.


