
Geomap
Geomaps allow you to view and customize the world map using geospatial data. It’s the ideal visualization if you have data that includes location information and you want to see it displayed in a map.
You can configure and overlay map layers, like heatmaps and networks, and blend included basemaps or your own custom maps. This helps you to easily focus on the important location-based characteristics of the data.
When a geomap is in focus, in addition to typical mouse controls, you can pan around using the arrow keys or zoom in and out using the plus (+) and minus (-) keys or icons.
Geomaps are also useful when you have location data that’s changing in real time and you want to visualize where an element is moving, using auto-refresh.
You can use a geomap visualization if you need to:
- Track your fleet of vehicles and associated metrics
- Show the locations and statuses of data centers or other connected assets in a network
- Display geographic trends in a heatmap
- Visualize the relationship of your locations’ HVAC consumption or solar production with the sun’s location
Note
We’d love your feedback on the geomap visualization. Please check out the open Github issues and submit a new feature request as needed.
Configure a geomap visualization
The following video provides beginner steps for creating geomap visualizations. You’ll learn the data requirements and caveats, special customizations, preconfigured displays and much more:
With Grafana Play, you can explore and see how it works, learning from practical examples to accelerate your development. This feature can be seen on Geomap Examples.
Supported data formats
To create a geomap visualization, you need datasets containing fields with location information.
The supported location formats are:
- Latitude and longitude
- Geohash
- Lookup codes: country, US states, or airports
To learn more, refer to Location mode.
Geomaps also support additional fields with various data types to define things like labels, numbers, heat sizes, and colors.
Example - Latitude and longitude
If you plan to use latitude and longitude coordinates, the dataset must include at least two fields (or columns): one called latitude (you can also uselat), and one called longitude (also lon or lng). When you use this naming convention, the visualization automatically detects the fields and displays the elements. The order of the fields doesn’t matter as long as there is one latitude and one longitude.
If your latitude and longitude fields are named differently, you can specify them, as indicated in the Location mode section.
Example - Geohash
If your location data is in geohash format, the visualization requires at least one field (or column) containing location data.
If the field is named geohash, the visualization automatically detects the location and displays the elements. The order of the fields doesn’t matter and the data set can have multiple other numeric, text, and time fields.
If your field containing geohash location data is not named as above, you can configure the visualization to use geohash and specify which field to use, as explained in the Location mode section.
Example - Lookup codes
The geomap visualization can identify locations based on country, airport, or US state codes.
For this configuration, the dataset must contain at least one field (or column) containing the location code.
If the field is named lookup, the visualization automatically detects it and displays points based on country codes.
The other location types— airport codes or US state codes—aren’t automatically detected.
If you want to use other codes or give the field a custom name, you can follow the steps in the Location mode section.
Configuration options
Panel options
In the Panel options section of the panel editor pane, set basic options like panel title and description, as well as panel links. To learn more, refer to Configure panel options.
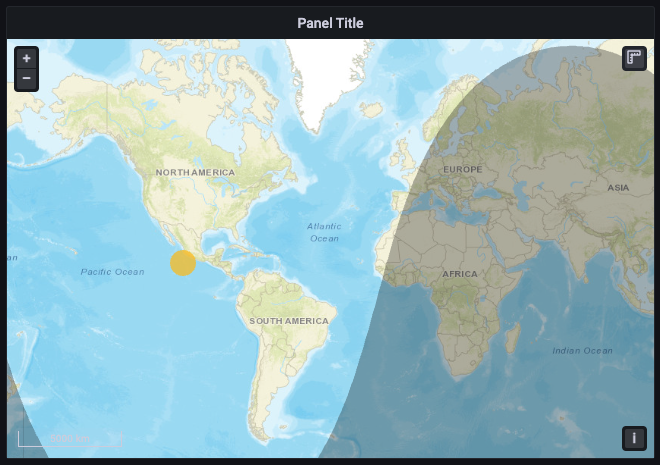
Map view options
The map view controls the initial view of the map when the dashboard loads.
Initial View
The initial view configures how the geomap renders when the panel is first loaded.
- View - Sets the center for the map when the panel first loads. Refer to the table following this list for view selections.
- Zoom - Sets the initial zoom level.
- Use current map settings - Use the settings of the current map to set the center.
Default Views are also available including:
Share view
The Share view option allows you to link the movement and zoom actions of multiple map visualizations within the same dashboard. The map visualizations that have this option enabled act in tandem when one of them is moved or zoomed, leaving the other ones independent.
Note
You might need to reload the dashboard for this feature to work.
No map repeating
The No map repeating option prevents the base map tiles from repeating horizontally when you pan across the world. This constrains the view to a single instance of the world map and avoids visual confusion when displaying global datasets. Enabling this option requires the map to reinitialize.
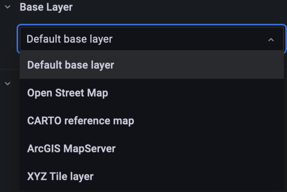
Map layers options
Geomaps support showing multiple layers. Each layer determines how you visualize geospatial data on top of the base map.
There are three options that you need to set for all maps:
Other options are dependent on your map layer type and are described within the layer type section.
The layer controls allow you to create layers, change their name, reorder and delete layers.
- Add layer creates an additional, configurable data layer for the geomap. When you add a layer, you are prompted to select a layer type. You can change the layer type at any point during panel configuration. See the Layer Types section above for details on each layer type.
- Edit layer name (pencil icon) renames the layer.
- Trash Bin deletes the layer.
- Reorder (six dots/grab handle) allows you to change the layer order. Data on higher layers will appear above data on lower layers. The visualization will update the layer order as you drag and drop to help simplify choosing a layer order.
You can add multiple layers of data to a single geomap in order to create rich, detailed visualizations.
Layer type
There are eight map layer types to choose from in a geomap.
- Markers renders a marker at each data point.
- Heatmap visualizes a heatmap of the data.
- GeoJSON renders static data from a GeoJSON file.
- Night / Day renders a night / day region.
- Route render data points as a route.
- Photos renders a photo at each data point.
- Network visualizes a network graph from the data.
- Open Street Map adds a map from a collaborative free geographic world database.
- CARTO basemap adds a layer from CARTO Raster basemaps.
- ArcGIS MapServer adds a layer from an ESRI ArcGIS MapServer.
- XYZ Tile layer adds a map from a generic tile layer.
- MapLibre Style layer adds a map from a MapLibre/Mapbox style URL.
There are also two experimental (or alpha) layer types.
- Icon at last point (alpha) renders an icon at the last data point.
- Dynamic GeoJSON (alpha) styles a GeoJSON file based on query results.
To enable experimental layers. Set enable_alpha to true in your configuration file:
[panels]
enable_alpha = true
To enable the experimental layers using Docker, run the following command:
docker run -p 3000:3000 -e "GF_PANELS_ENABLE_ALPHA=true" grafana/grafana:<VERSION>Data
Geomaps need a source of geographical data gathered from a data source query which can return multiple datasets. By default Grafana picks the first dataset, but this drop-down allows you to pick other datasets if the query returns more than one.
Location mode
There are four options to map the data returned by the selected query:
- Auto automatically searches for location data. Use this option when your query is based on one of the following names for data fields.
- geohash: “geohash”
- latitude: “latitude”, “lat”
- longitude: “longitude”, “lng”, “lon”
- lookup: “lookup”
- Coords specifies that your query holds coordinate data. You will get prompted to select numeric data fields for latitude and longitude from your database query.
- Geohash specifies that your query holds geohash data. You will be prompted to select a string data field for the geohash from your database query.
- Lookup specifies that your query holds location name data that needs to be mapped to a value. You will be prompted to select the lookup field from your database query and a gazetteer. The gazetteer is the directory that is used to map your queried data to a geographical point.
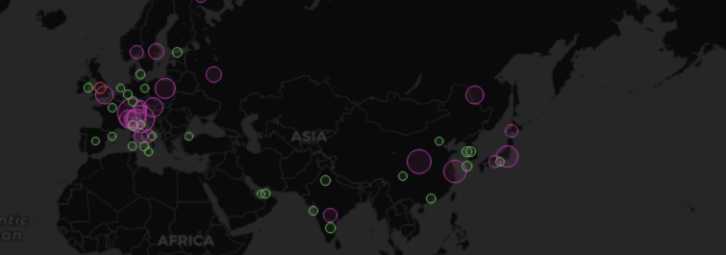
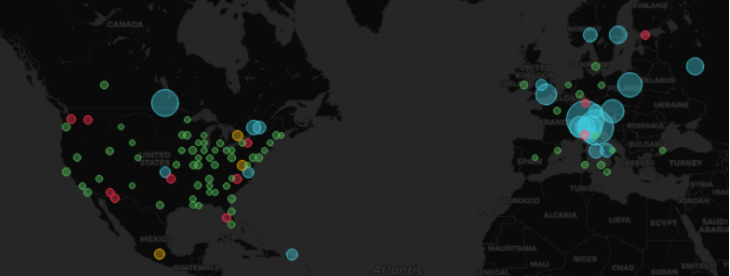
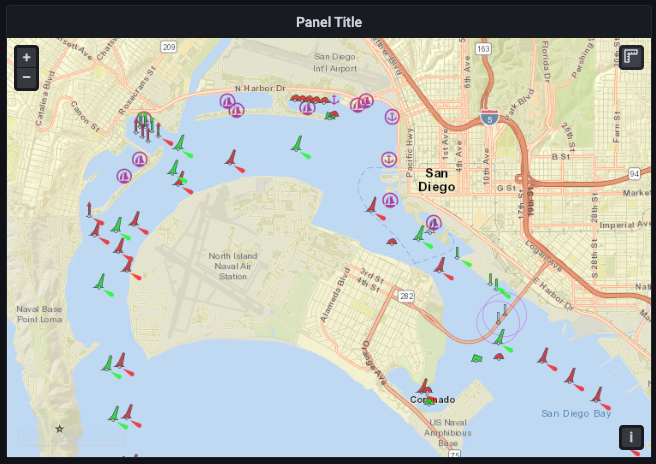
Markers layer
The markers layer allows you to display data points as different marker shapes such as circles, squares, triangles, stars, and more.
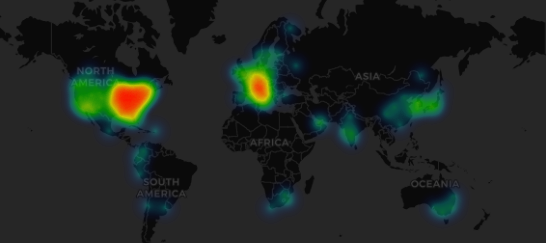
Heatmap layer
The heatmap layer clusters various data points to visualize locations with different densities. To add a heatmap layer:
Click on the drop-down menu under Data Layer and choose Heatmap.
Similar to Markers, you are prompted with various options to determine which data points to visualize and how you want to visualize them.
GeoJSON layer
The GeoJSON layer allows you to select and load a static GeoJSON file from the filesystem.
Styles can be set within the “properties” object of the GeoJSON with support for the following geometries:
Polygon, MultiPolygon
- “fill” - The color of the interior of the polygon(s)
- “fill-opacity” - The opacity of the interior of the polygon(s)
- “stroke-width” - The width of the line component of the polygon(s)
Point, MultiPoint
- “marker-color” - The color of the point(s)
- “marker-size” - The size of the point(s)
LineString, MultiLineString
- “stroke” - The color of the line(s)
- “stroke-width” - The width of the line(s)
Night / Day layer
The Night / Day layer displays night and day regions based on the current time range.
Extensions for OpenLayers - DayNight
Route layer
The Route layer renders data points as a route.
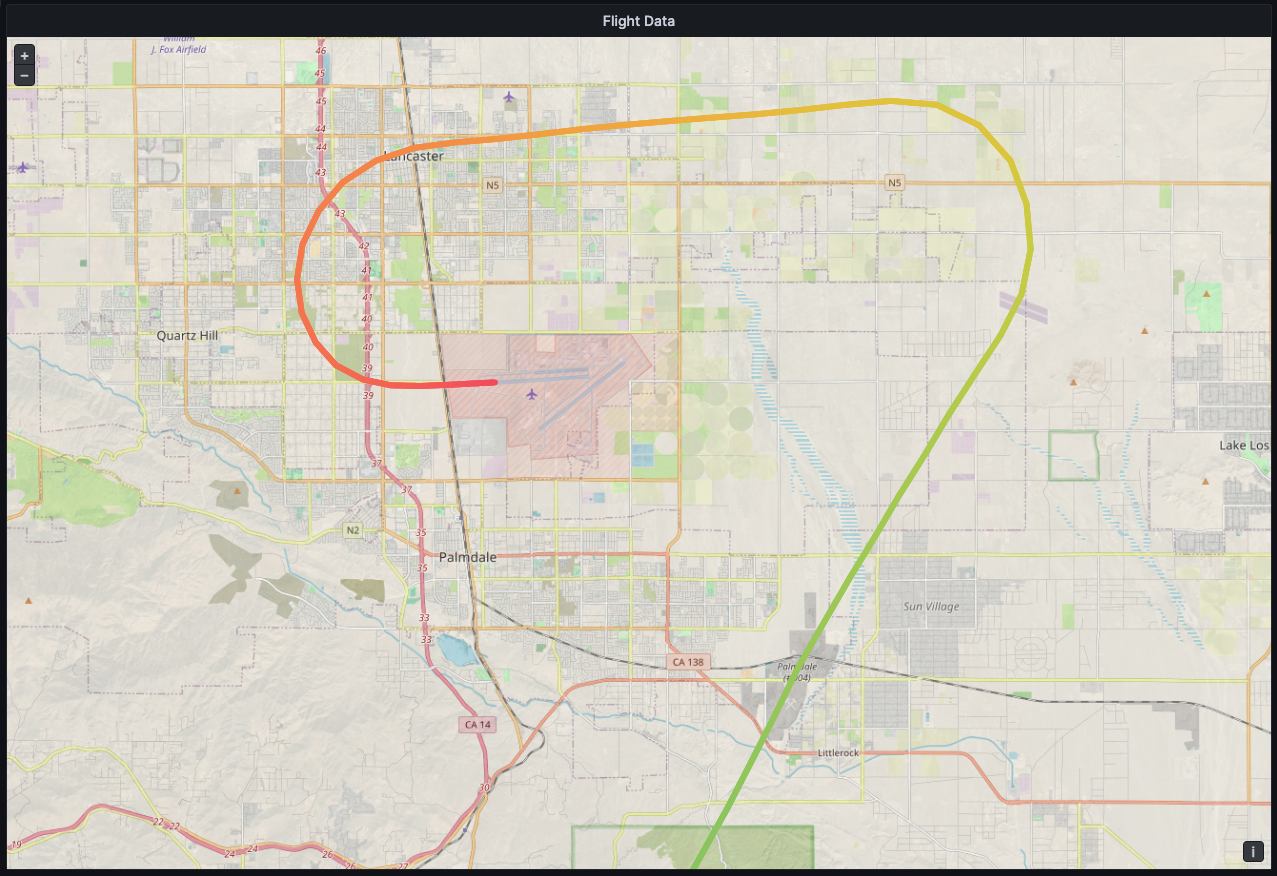
The layer can also render a route with arrows.
Extensions for OpenLayers - Flow Line Style
Photos layer
The Photos layer renders a photo at each data point.
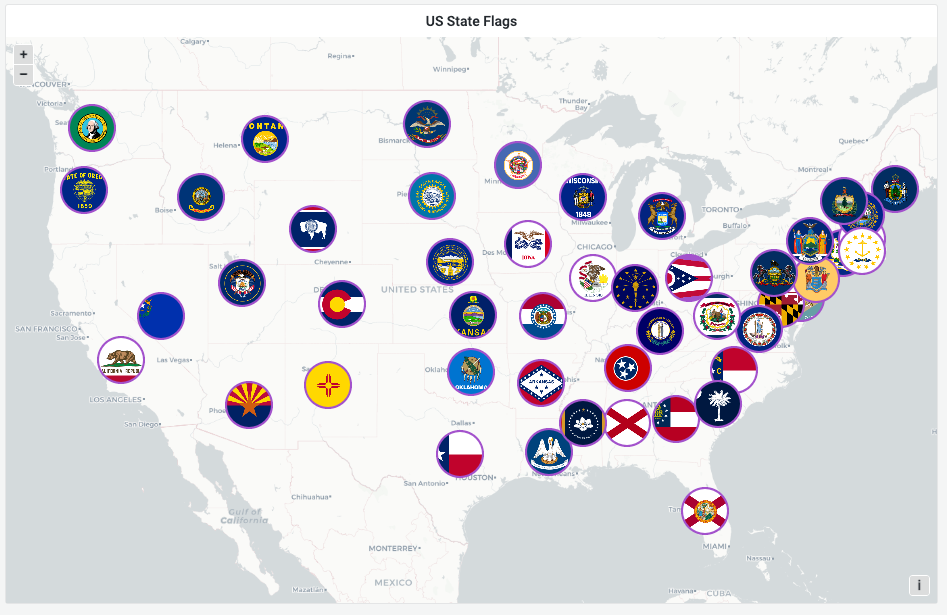
Extensions for OpenLayers - Image Photo Style
Network layer
The Network layer renders a network graph. This layer supports the same data format supported by the node graph visualization with the addition of geospatial data included in the nodes data. The geospatial data is used to locate and render the nodes on the map.
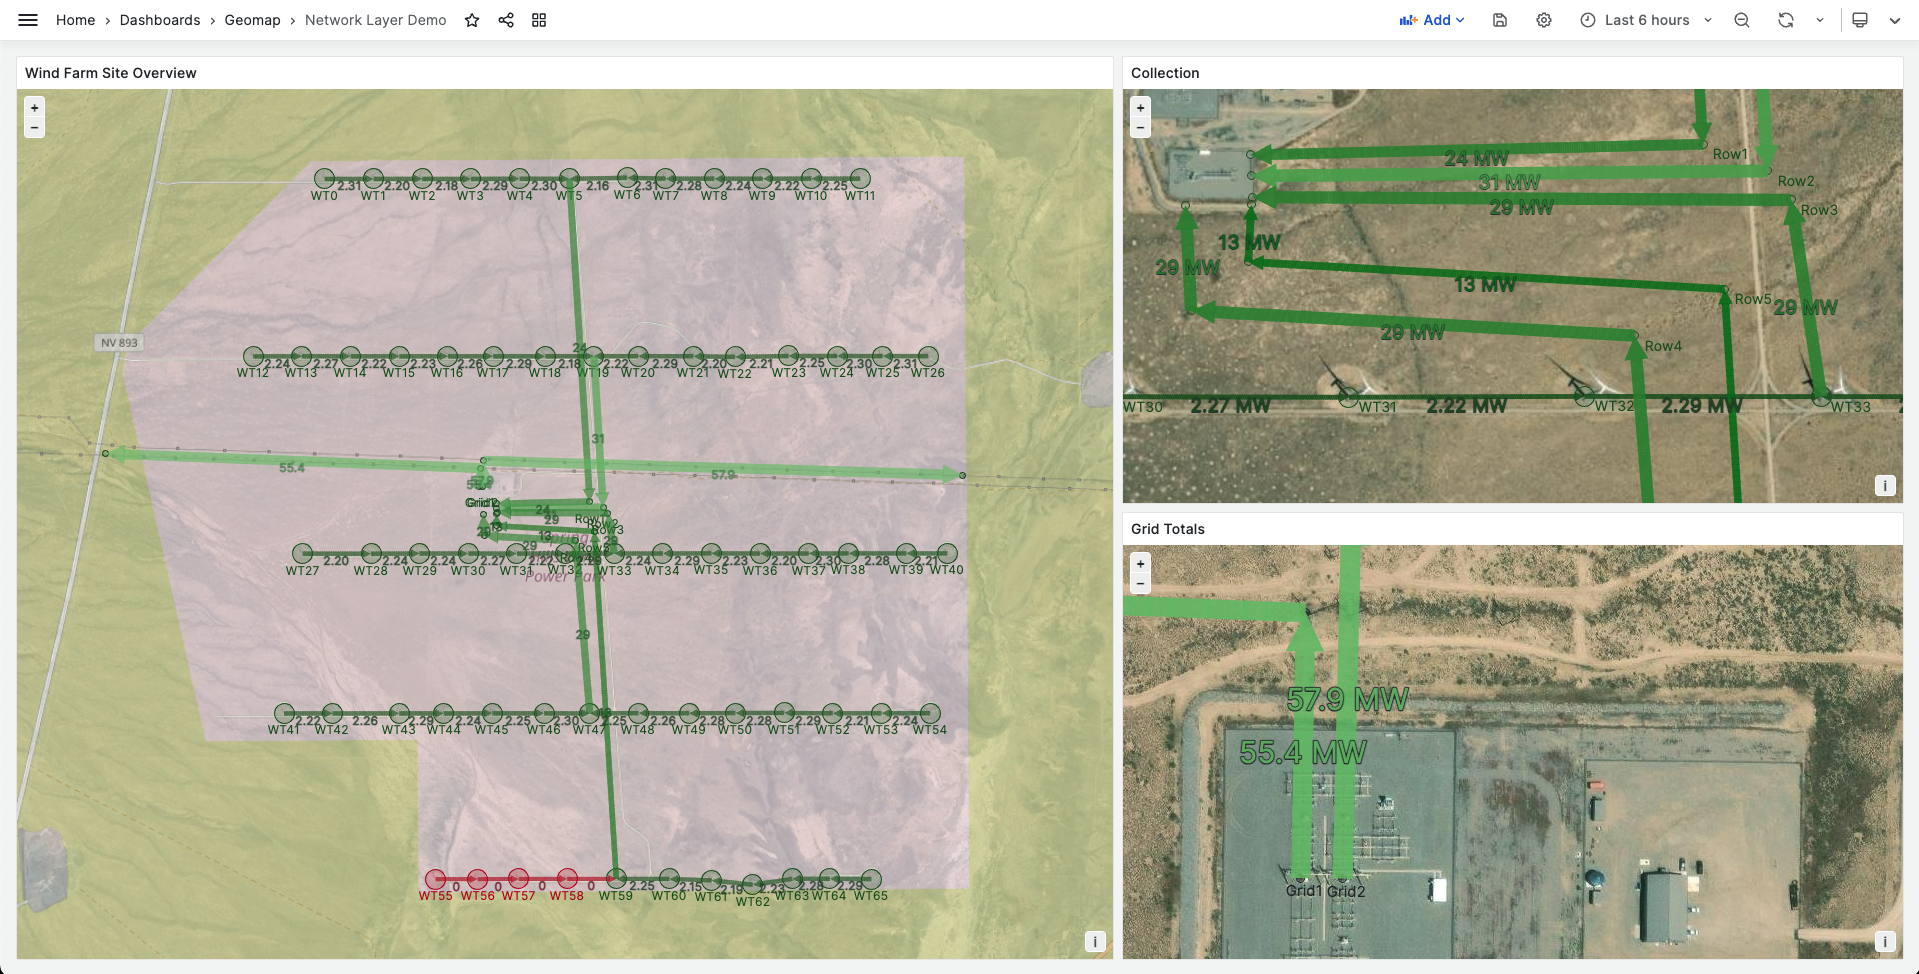
You can convert node graph data to a network layer:
Node styles options
Edge styles options
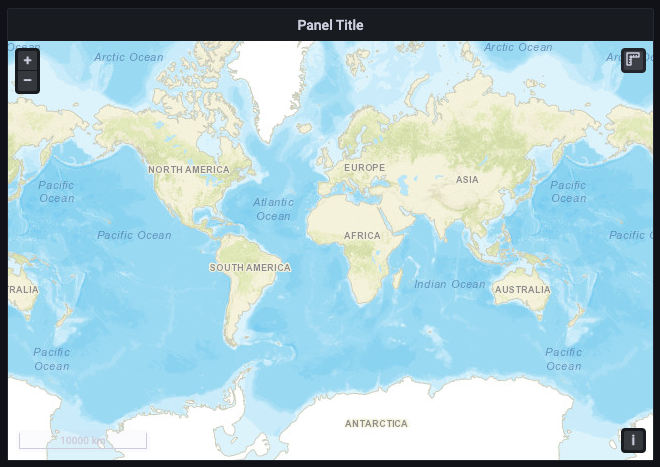
Open Street Map layer
A map from a collaborative free geographic world database.
- Opacity from 0 (transparent) to 1 (opaque)
- Display tooltip - allows you to toggle tooltips for the layer.
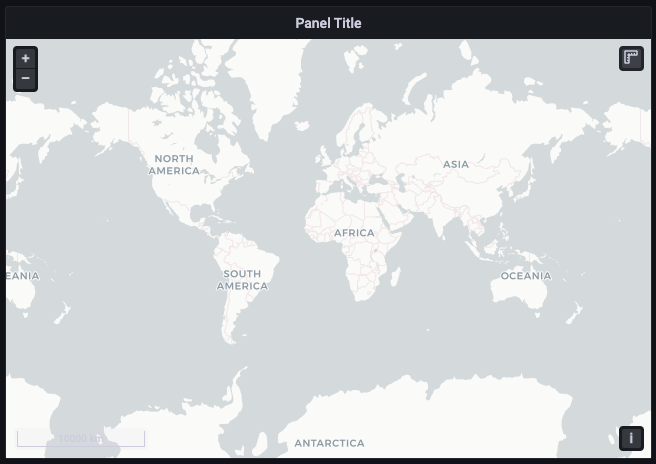
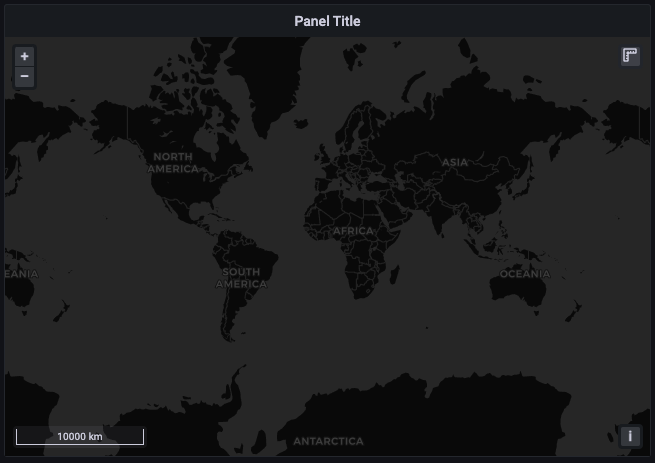
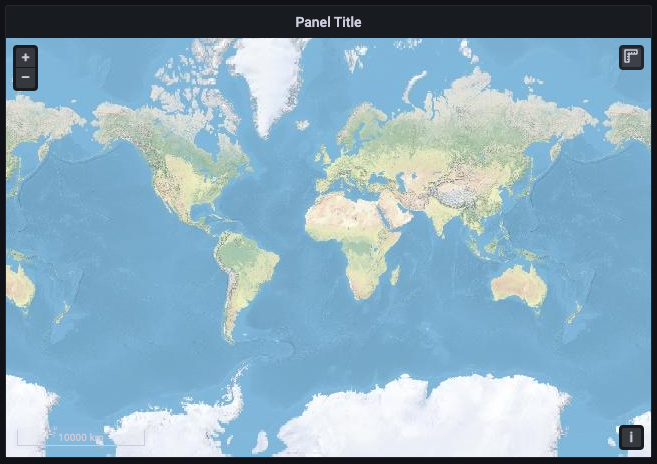
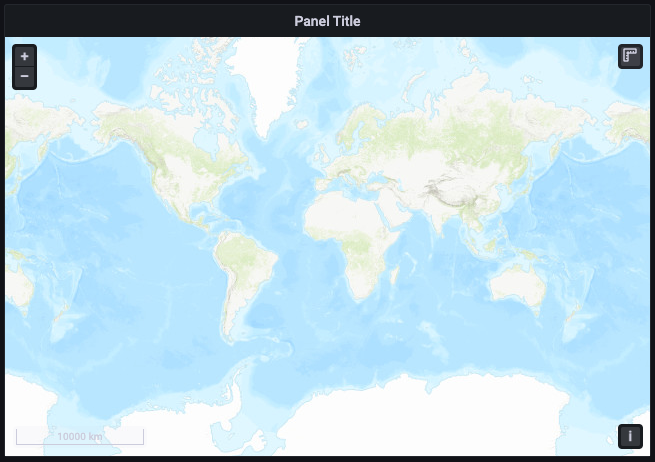
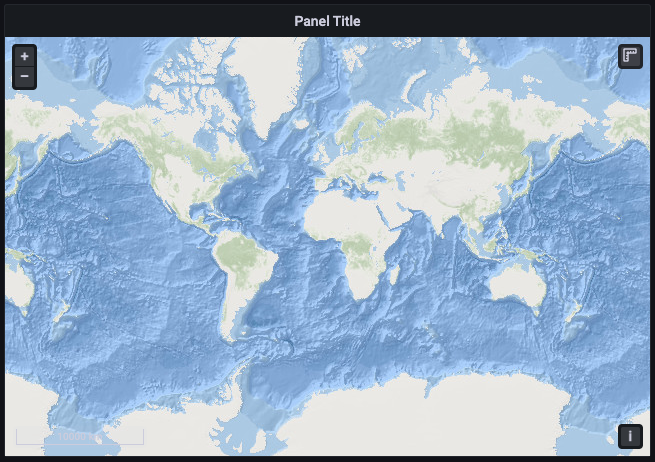
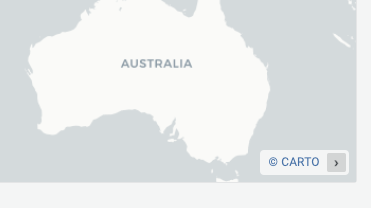
CARTO basemap layer
A CARTO layer is from CARTO Raster basemaps.
- Theme
- Auto
- Light
![Geomap panel CARTO light example]()
- Dark
![Geomap panel CARTO dark example]()
- Show labels shows the Country details on top of the map.
- Opacity from 0 (transparent) to 1 (opaque)
- Display tooltip - allows you to toggle tooltips for the layer.
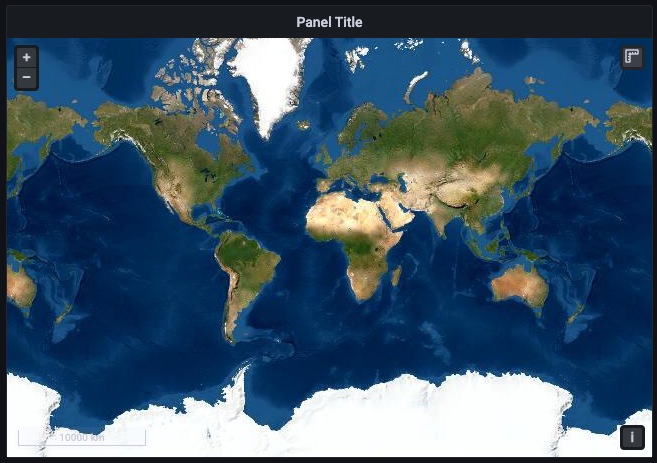
ArcGIS MapServer layer
An ArcGIS layer is a layer from an ESRI ArcGIS MapServer.
- Server Instance to select the map type.
- World Street Map
![Geomap panel ArcGIS World Street Map]()
- World Imagery
![Geomap panel ArcGIS World Imagery]()
- World Physical
![Geomap panel ArcGIS World Physical]()
- Topographic
![Geomap panel ArcGIS Topographic]()
- USA Topographic
![Geomap panel ArcGIS USA Topographic]()
- World Ocean
![Geomap panel ArcGIS World Ocean]()
- Custom MapServer (see XYZ for formatting)
- URL template
- Attribution
- World Street Map
- Opacity from 0 (transparent) to 1 (opaque)
- Display tooltip - allows you to toggle tooltips for the layer.

More Information
XYZ Tile layer
The XYZ Tile layer is a map from a generic tile layer.
- URL template - Set a valid tile server url, with {z}/{x}/{y} for example: https://tile.openstreetmap.org/{z}/{x}/{y}.png
- Attribution sets the reference string for the layer if displayed in map controls
- Opacity from 0 (transparent) to 1 (opaque)
More information
MapLibre Style layer
The MapLibre Style Layer is a map defined using a MapLibre/Mapbox style.json URL. The style contains the URL to the tiles, layer definitions, and more. Typically, they’re based on vector tiles as opposed to raster tiles.
- URL template - Set a valid style URL. For example:
https://demotiles.maplibre.org/style.json - Access Token - An API token for mapbox maps. Only works for
mapbox://URLs. Refer to mapbox access tokens documentation for more information. In other cases, you might have to include the token in the URL. For example:https://example.com/map/style.json?key=XXX.
Basemap layer options
A basemap layer provides the visual foundation for a mapping application. It typically contains data with global coverage. Several base layer options are available each with specific configuration options to style the base map.
Basemap layer types can also be added as layers. You can specify an opacity.
There are five basemap layer types to choose from in a geomap.
- Open Street Map adds a map from a collaborative free geographic world database.
- CARTO basemap adds a layer from CARTO Raster basemaps.
- ArcGIS MapServer adds a layer from an ESRI ArcGIS MapServer.
- XYZ Tile layer adds a map from a generic tile layer.
- MapLibre Style layer adds a map from a MapLibre/Mapbox style URL.
The default basemap layer uses the CARTO map. You can define custom default base layers in the .ini configuration file.
Configure the default base layer with provisioning
You can configure the default base map using config files with Grafana’s provisioning system. For more information on all the settings, refer to the provisioning docs page.
Use the JSON configuration option default_baselayer_config to define the default base map. There are currently five base map options to choose from: carto, esri-xyz, osm-standard, xyz, maplibre. Here are some provisioning examples for each base map option.
- carto loads the CartoDB tile server. You can choose from
auto,dark, andlighttheme for the base map and can be set as shown below. TheshowLabelstag determines whether or not Grafana shows the Country details on top of the map. Here is an example:
geomap_default_baselayer = `{
  "type": "carto",
  "config": {
    "theme": "auto",
    "showLabels": true
  }
}`- esri-xyz loads the ESRI tile server. There are already multiple server instances implemented to show the various map styles:
world-imagery,world-physical,topo,usa-topo, andocean. Thecustomserver option allows you to configure your own ArcGIS map server. Here are some examples:
geomap_default_baselayer = `{
  "type": "esri-xyz",
  "config": {
    "server": "world-imagery"
  }
}`geomap_default_baselayer = `{
"type": "esri-xyz",
"config": {
"server": "custom",
"url": "[tile server url]",
"attribution": "[tile server attribution]"
}
}`- osm-standard loads the OpenStreetMap tile server. There are no additional configurations needed and the
configfields can be left blank. Here is an example:
default_baselayer_config = `{
  "type": "osm-standard",
  "config": {}
}`- xyz loads a custom tile server defined by the user. Set a valid tile server
url, with {z}/{x}/{y} for this option in order to properly load a default base map. Here is an example:
default_baselayer_config = `{
  "type": "xyz",
  "config": {
    "attribution": "Open street map",
    "url": "https://tile.openstreetmap.org/{z}/{x}/{y}.png"
  }
}`- maplibre loads a custom tile server defined by the user. Set a valid style
urlfor this option to properly load a default base map. Here’s an example:
default_baselayer_config = `{
  "type": "maplibre",
  "config": {
    "url": "https://demotiles.maplibre.org/style.json"
  }
}`
enable_custom_baselayers allows you to enable or disable custom open source base maps that are already implemented. The default is true.
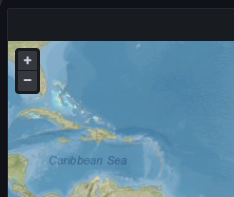
Map controls options
The map controls section contains various options for map information and tool overlays.
Show zoom control
Displays zoom controls in the upper left corner. This control can be useful when using systems that don’t have a mouse.
Mouse wheel zoom
Enables the mouse wheel to be used for zooming in or out.
Show attribution
Displays attribution for basemap layers.
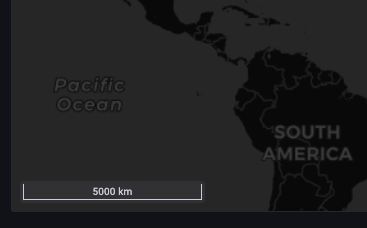
Show scale
Displays scale information in the bottom left corner in meters (m) or kilometers (km).
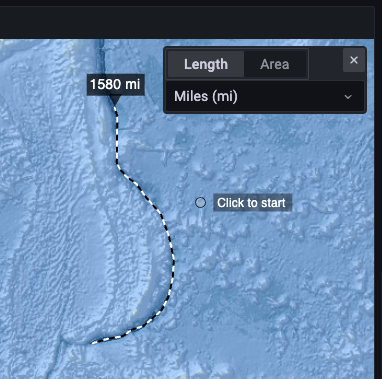
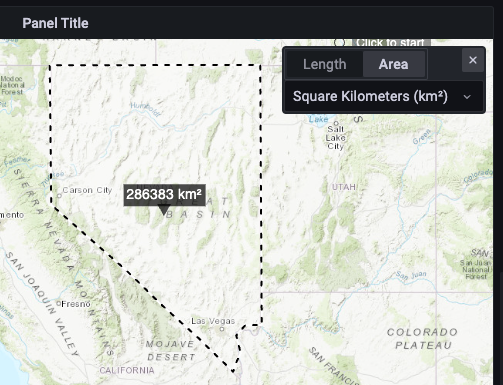
Show measure tools
Displays measure tools in the upper right corner. Measurements appear only when this control is open.
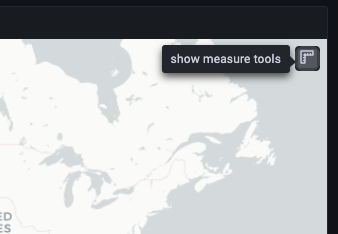
- Click to start measuring
- Continue clicking to continue measurement
- Double-click to end measurement
When you change measurement type or units, the previous measurement is removed from the map. If the control is closed and then re-opened, the most recent measurement is displayed. A measurement can be modified by clicking and dragging on it.
Length
Get the spherical length of a geometry. This length is the sum of the great circle distances between coordinates. For multi-part geometries, the length is the sum of the length of each part. Geometries are assumed to be in ‘EPSG:3857’.
- Metric (m/km)
- Feet (ft)
- Miles (mi)
- Nautical miles (nmi)
Area
Get the spherical area of a geometry. This area is calculated assuming that polygon edges are segments of great circles on a sphere. Geometries are assumed to be in ‘EPSG:3857’.
- Square Meters (m²)
- Square Kilometers (km²)
- Square Feet (ft²)
- Square Miles (mi²)
- Acres (acre)
- Hectare (ha)
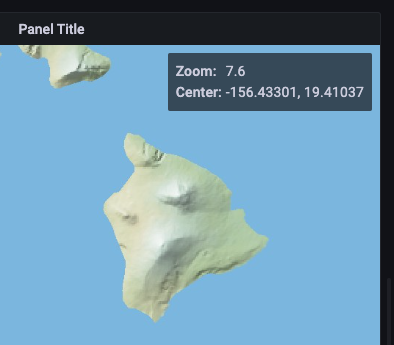
Show debug
Displays debug information in the upper right corner. This can be useful for debugging or validating a data source.
- Zoom displays current zoom level of the map.
- Center displays the current longitude, latitude of the map center.
Tooltip
Tooltips are supported for the Markers, Heatmap, Photos layers. For these layer types, choose from the following tooltip options:
- None displays tooltips only when a data point is clicked.
- Details displays tooltips when a mouse pointer hovers over a data point.
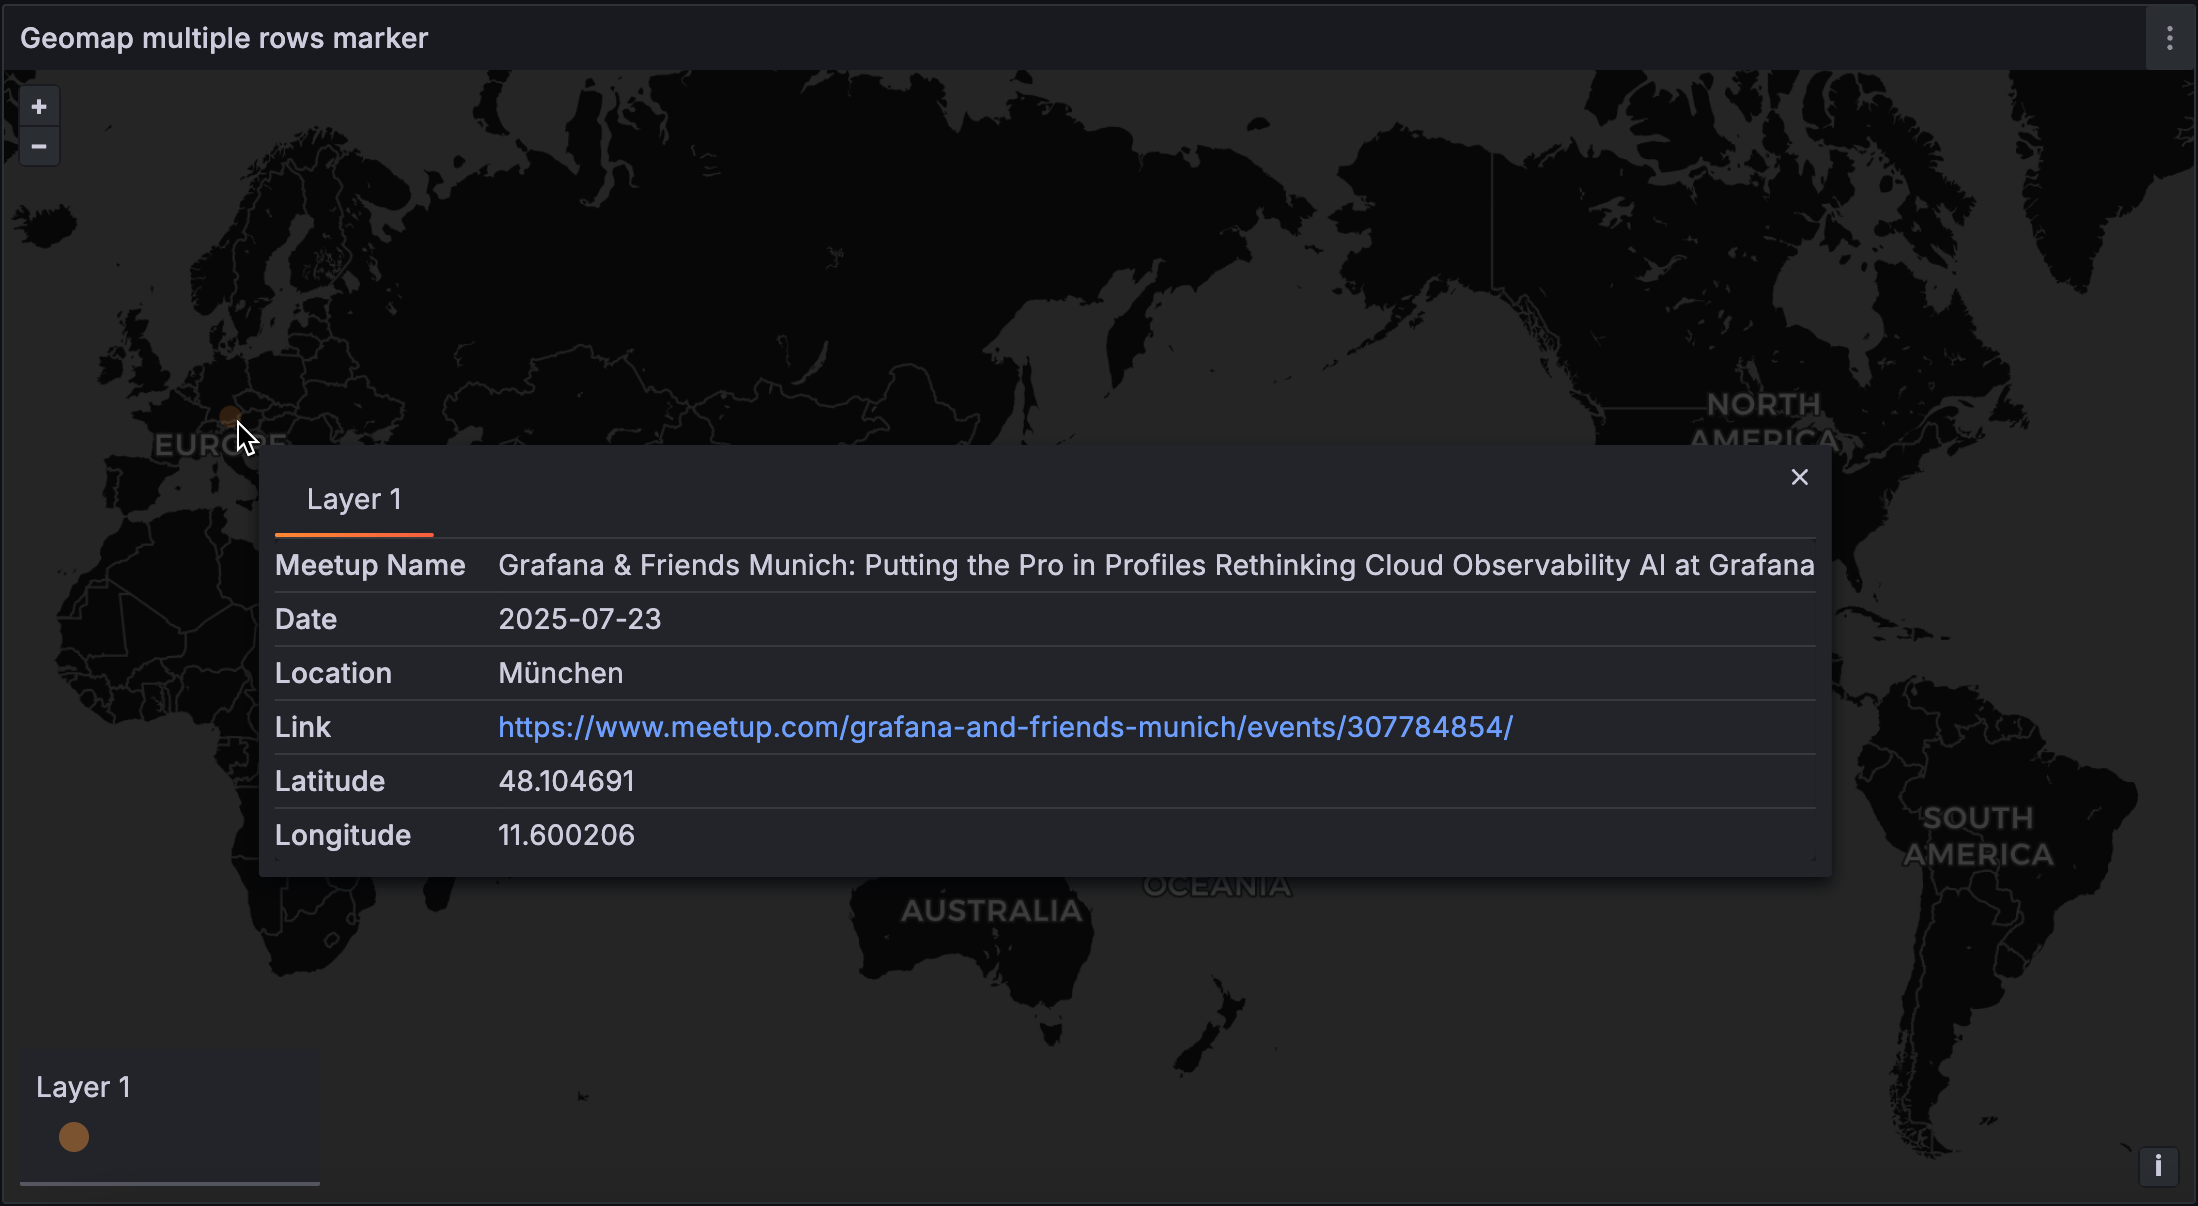
When a data point on the geomap represents one row—that is, only a single row of response data is relevant to that point—the tooltip displays a grid with the row’s names and values:
When a data point represents more than one row—that is, different rows but with the same geographical information—then each row appears as a single entry:
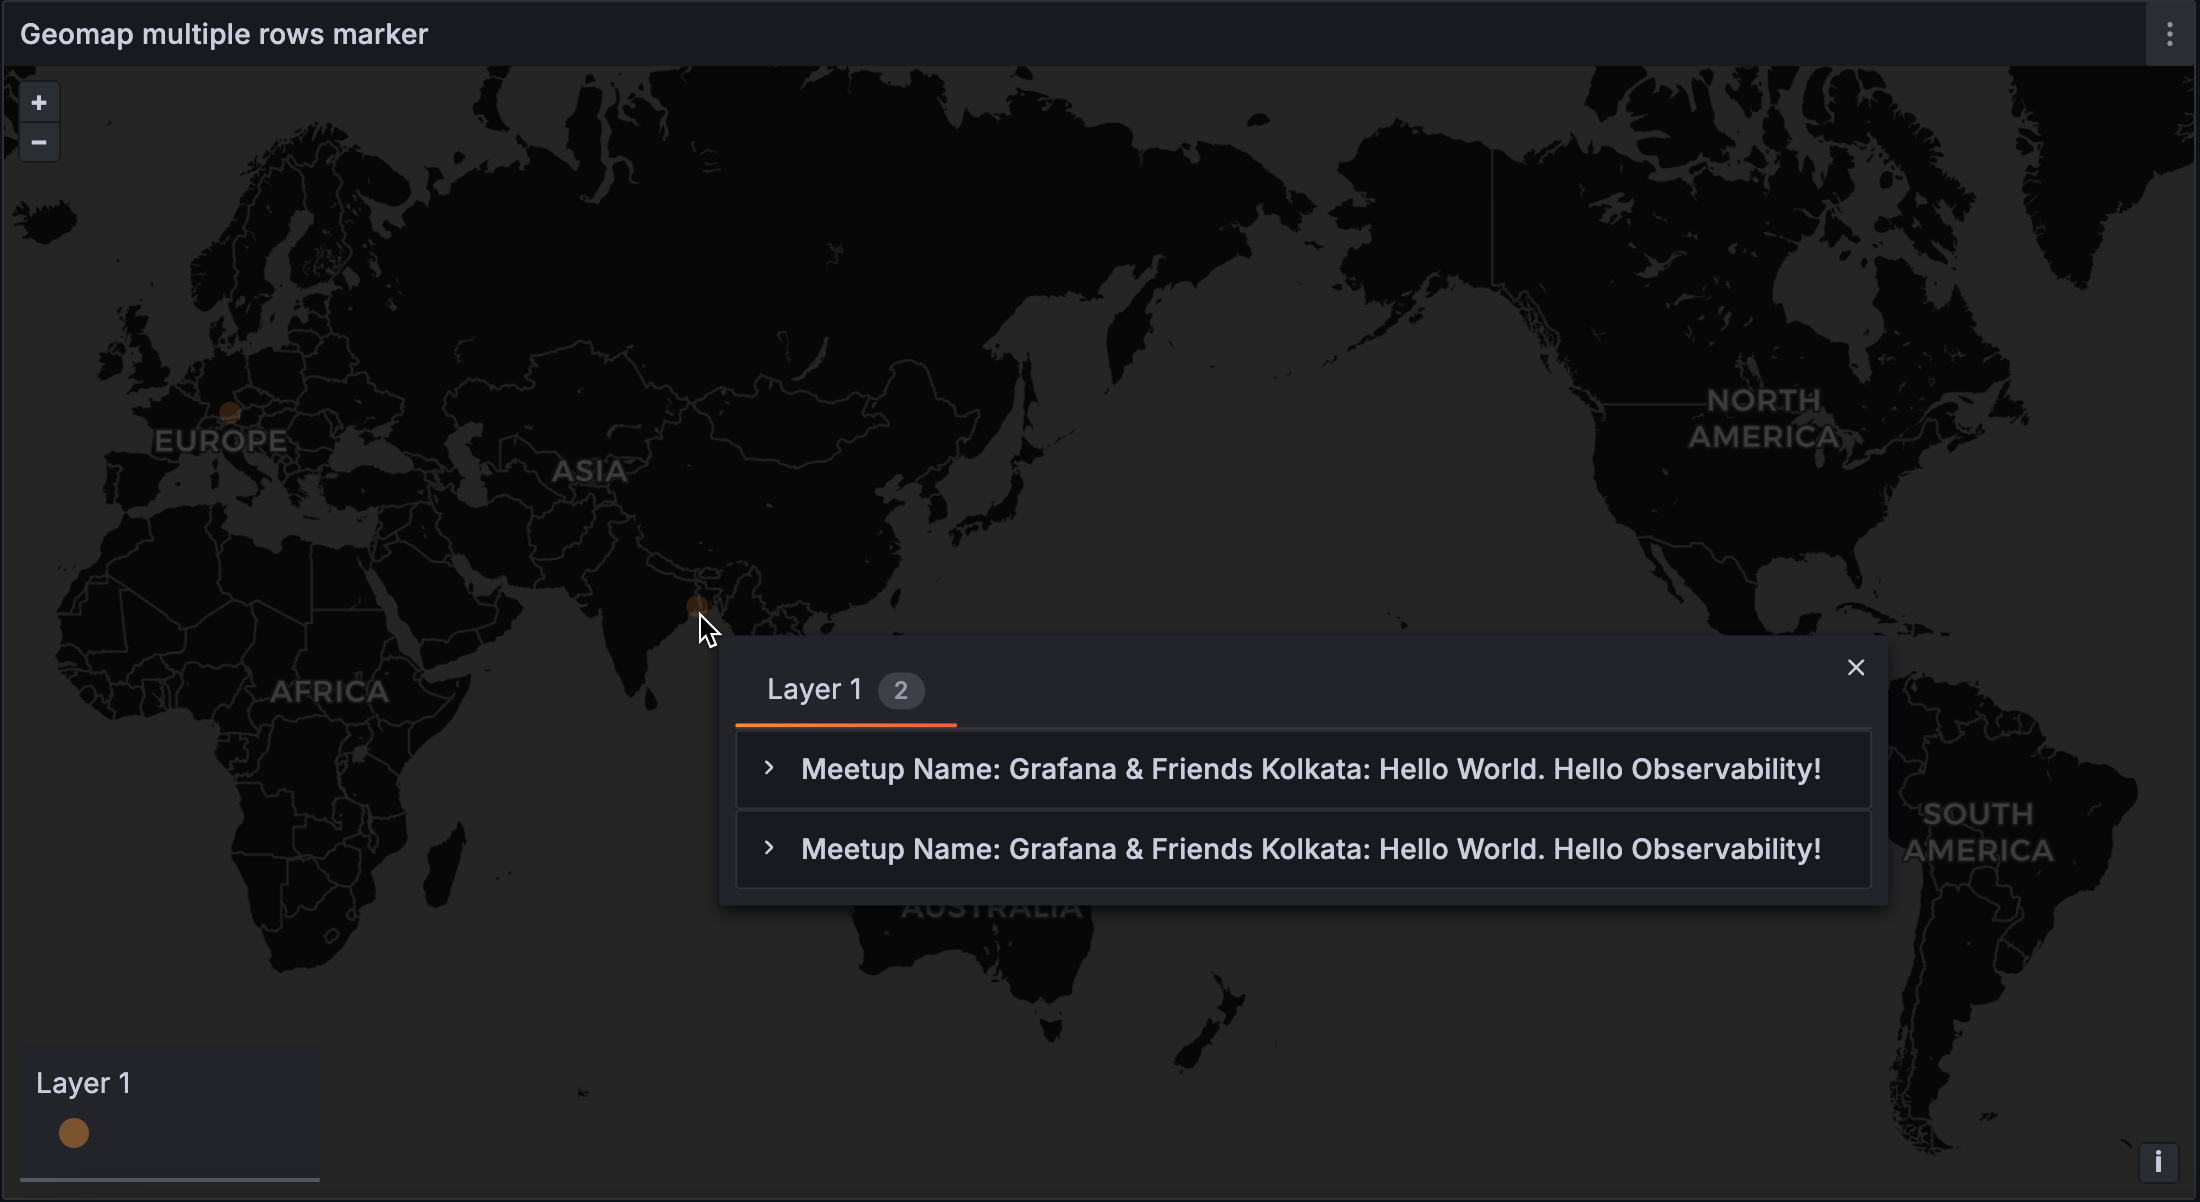
The text displayed in each tooltip row is associated with the first field value in each data row. Click it to expand and display the full details of the data row.
Note
The data appearing in each detail row is determined by the underlying query and transformations applied to the query’s results, and can’t be directly controlled using tooltip options.
Standard options
Standard options in the panel editor pane let you change how field data is displayed in your visualizations. When you set a standard option, the change is applied to all fields or series. For more granular control over the display of fields, refer to Configure overrides.
To learn more, refer to Configure standard options.
Data links and actions
Data links allow you to link to other panels, dashboards, and external resources while maintaining the context of the source panel. You can create links that include the series name or even the value under the cursor.
Note
Actions are not supported for this visualization.
For each data link, set the following options:
- Title
- URL
- Open in new tab
To learn more, refer to Configure data links and actions.
Value mappings
Value mapping is a technique you can use to change how data appears in a visualization.
For each value mapping, set the following options:
- Condition - Choose what’s mapped to the display text and (optionally) color:
- Value - Specific values
- Range - Numerical ranges
- Regex - Regular expressions
- Special - Special values like
Null,NaN(not a number), or boolean values liketrueandfalse
- Display text
- Color (Optional)
- Icon (Canvas only)
To learn more, refer to Configure value mappings.
Thresholds
A threshold is a value or limit you set for a metric that’s reflected visually when it’s met or exceeded. Thresholds are one way you can conditionally style and color your visualizations based on query results.
For each threshold, set the following options:
To learn more, refer to Configure thresholds.
Field overrides
Overrides allow you to customize visualization settings for specific fields or series. When you add an override rule, it targets a particular set of fields and lets you define multiple options for how that field is displayed.
Choose from the following override options:
To learn more, refer to Configure field overrides.


