Get started with Traces Drilldown
You can use traces to identify errors in your apps and services and then to optimize and streamline them.
When working with traces, start with the big picture. Investigate using primary signals, RED metrics, filters, and structural or trace list tabs to explore your data. To learn more, refer to Concepts.
Note
Expand your observability journey and learn about the Drilldown apps suite.
Before you begin
To use Grafana Traces Drilldown with Grafana Cloud, you need:
- A Grafana Cloud account
- A Grafana stack in Grafana Cloud with a configured Tempo data source
To use Traces Drilldown with self-managed Grafana, you need:
- Your own Grafana v11.2 or later instance with a configured Tempo data source
- Installed Traces Drilldown plugin
For more details, refer to Access Traces Drilldown.
Explore your tracing data
Most investigations follow these steps:
- Select the primary signal.
- Choose the metric you want to use: rates, errors, or duration.
- Define filters to refine the view of your data.
- Use the structural or trace list to drill down into the issue.
With Grafana Play, you can explore and see how it works, learning from practical examples to accelerate your development. This feature can be seen on the Grafana Play site.
Example: Investigate source of errors
As an example, you want to uncover the source of errors in your spans. For this, you need to compare the errors in the traces to locate the problem trace. Here’s how this works.
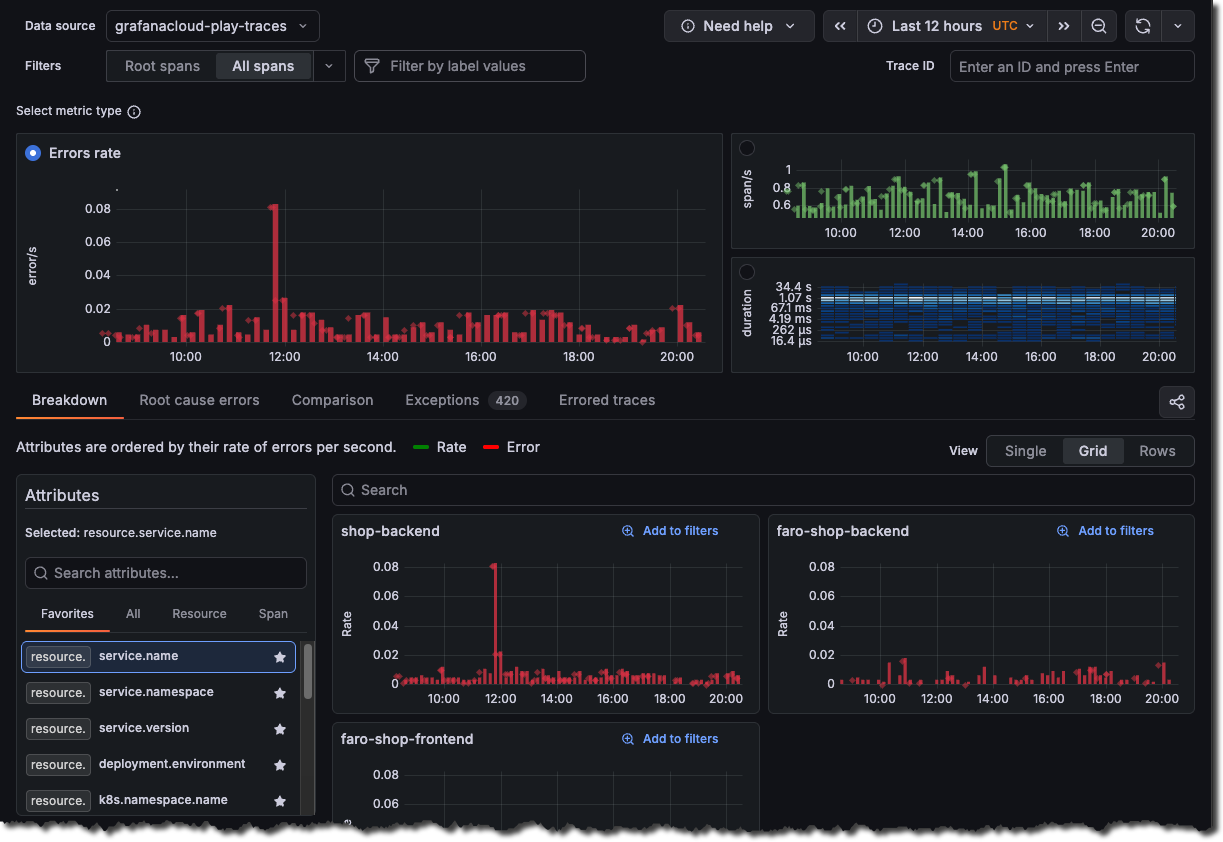
Choose the level of data and a metric
To identify the trouble spot, you want to use raw tracing data instead of just the root span, which is the first span of every trace. Select All spans in the Filters, then choose the Errors metric.
Correlate attributes
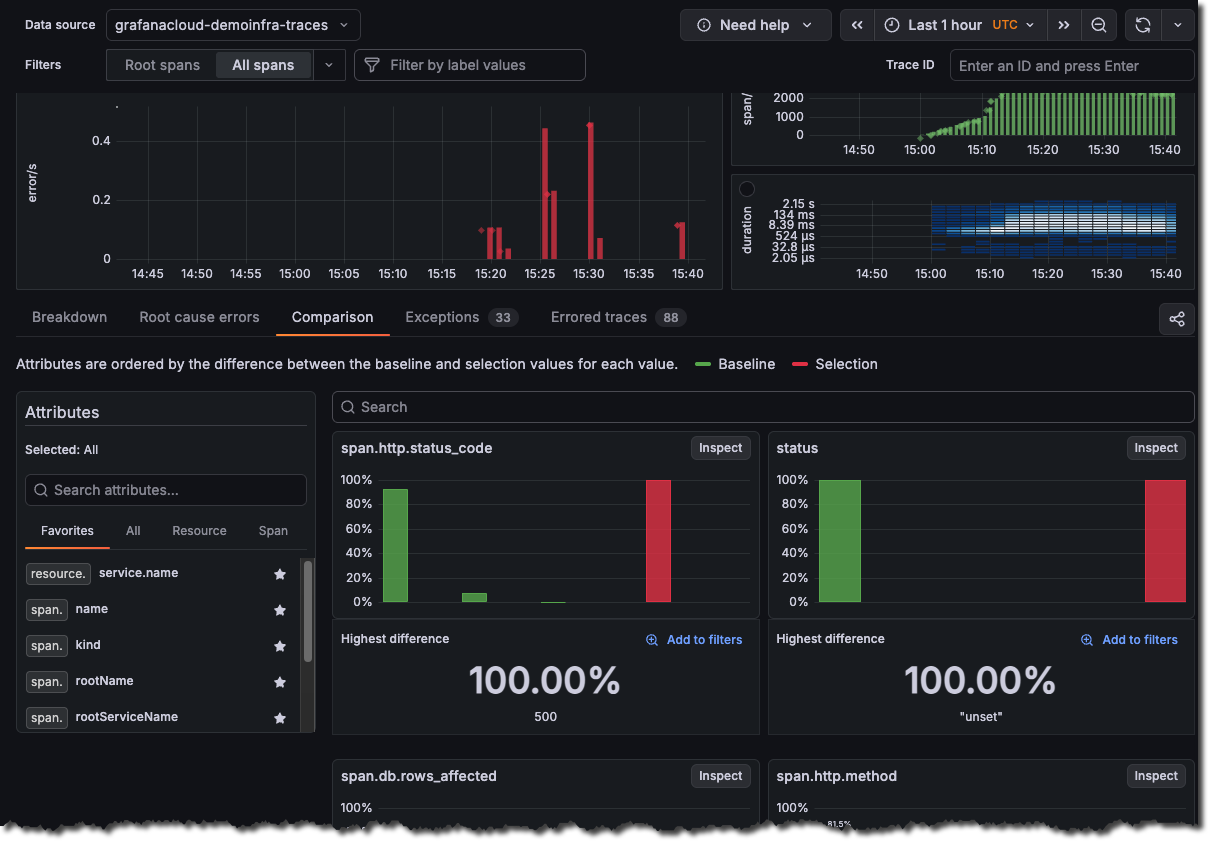
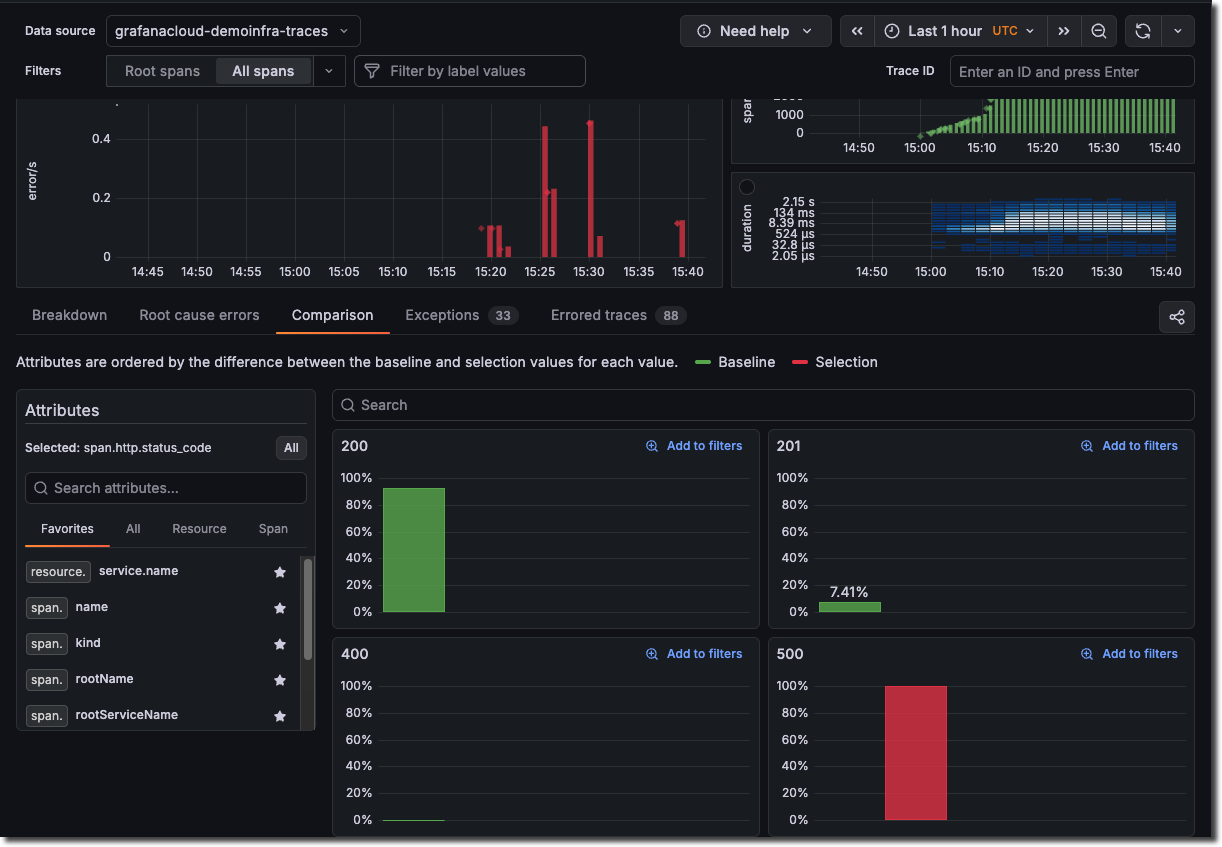
Use the Comparison tab to correlate attributes values with errors. The results are ordered by the difference in those attributes by the highest ones first. This helps you see what’s causing the errors immediately. The Comparison tab analyzes the difference between two sets of traces:
- Green bars (Baseline): Normal/healthy trace behavior
- Red bars (Selection): Current selection with status = error filter
The view compares your selection (red) to the baseline (green) and ranks attributes by the largest difference.
This indicates a significant spike in HTTP 500 (Internal Server Error) responses during your selected time range.
The visualization highlights that:
- 500 errors aren’t normal for this system, they don’t appear in the baseline comparison
- There were 500 traces containing HTTP 500 status codes during the error period
- This represents a 100% deviation from normal behavior
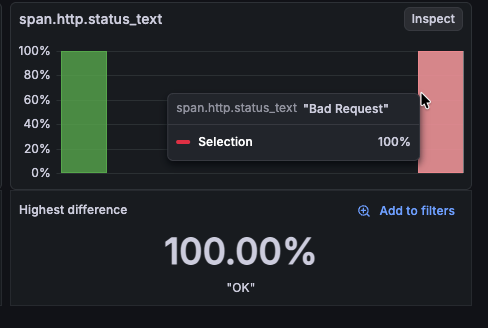
Click Add to filters to narrow the investigation to these values, or choose Inspect to explore the full distribution.
Hovering over any of the bars shows a tooltip with information about the value and the percentage of the total.
Inspect the problem
Select Inspect on a card to drill into the distribution for that attribute.
In this example, selecting Inspect on span.http.status_code shows the distribution by value. Using this view shows the following:
- Normal state: All requests completed successfully (
200/201) - Error state: Significant portion return
500errors - Root cause: something caused the internal server errors during the selected time frame
Use Add to filters on the 500 card to keep only error spans and continue the investigation.
Use Root cause errors
Select Root cause errors for an aggregated view of all of the traces that have errors in them.
This screen provides critical insights into where and how the HTTP 500 error occurred in your distributed system.
Using this view, you can see that the Frontend > Recommendations services have problems. Specifically, that the /api/pizza endpoint chain is failing.
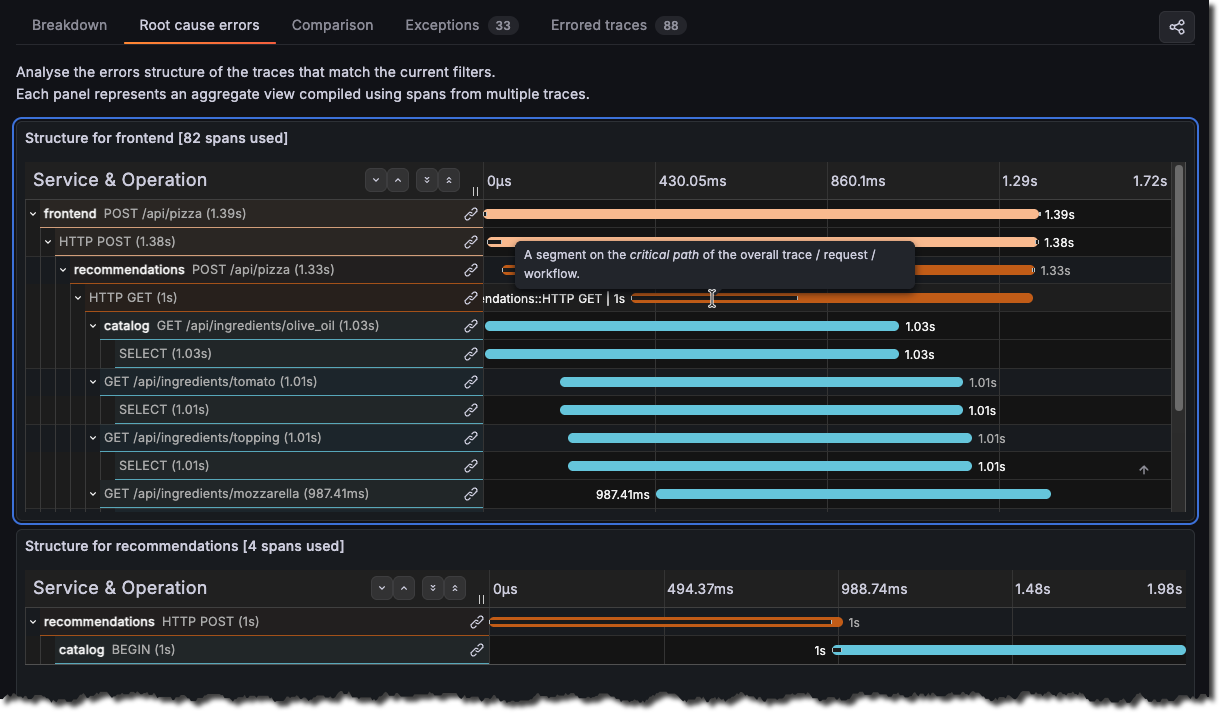
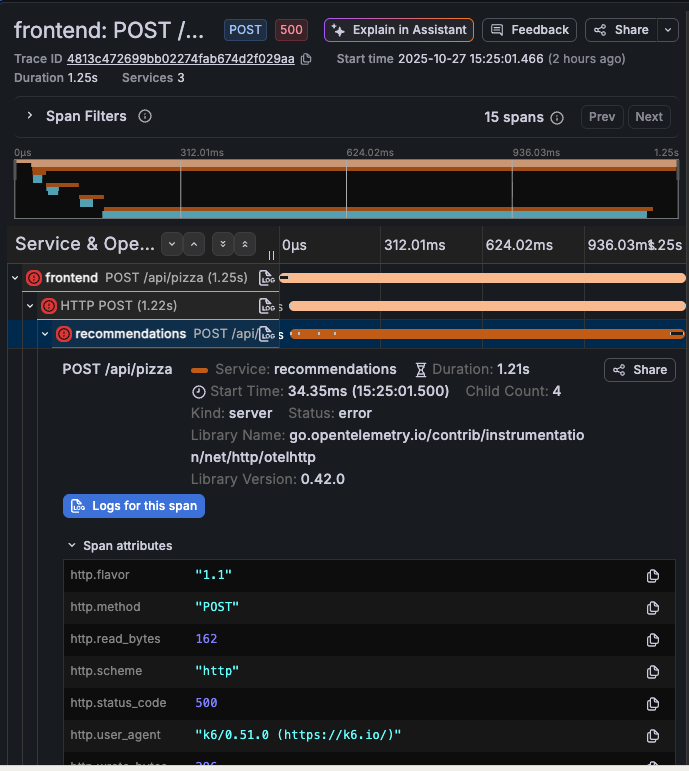
To view additional details, click the link icon and select View linked span to open the trace drawer.
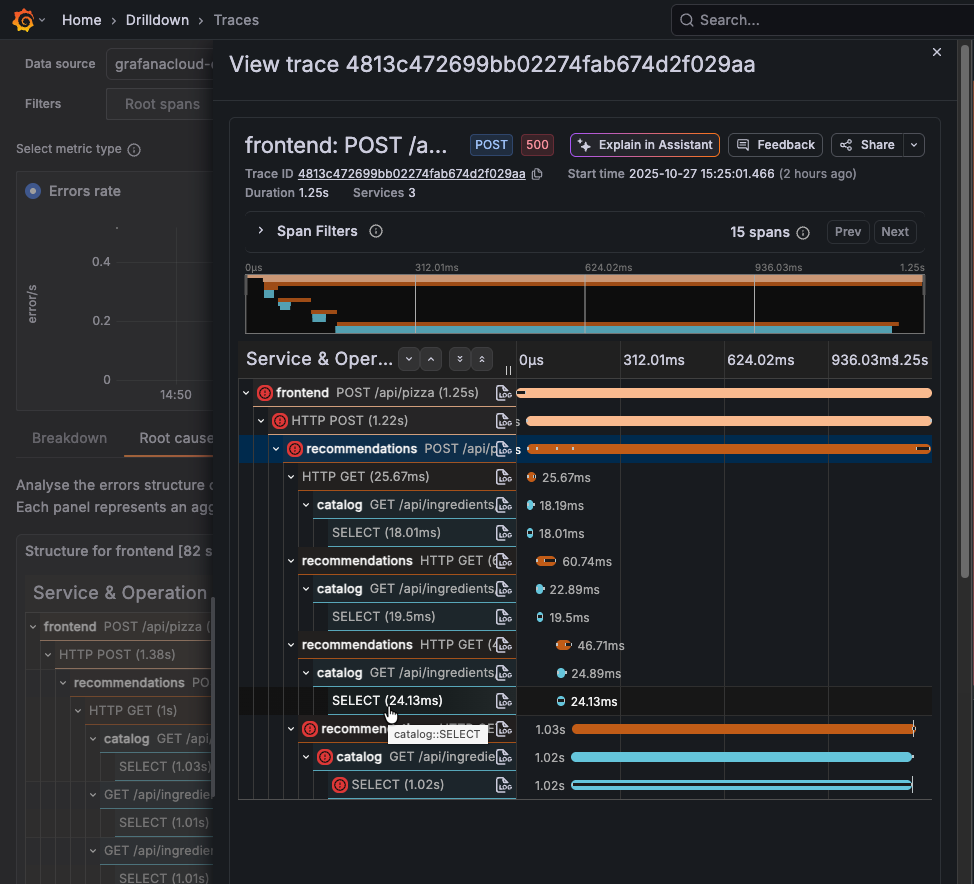
Errors spans have a red icon next to them. Select the down arrow next to the errored span to see details.