Assess dashboard usage
Note: Looking for prebuilt Grafana dashboards? Check out our full library of dashboards and more →
Usage insights enables you to have a better understanding of how your Grafana instance is used.
Note
Available in Grafana Enterprise and Grafana Cloud. Grafana Cloud insights logs include additional fields with their own dashboards. Read more in the Grafana Cloud documentation.
The usage insights feature collects a number of aggregated data and stores them in the database:
- Dashboard views (aggregated and per user)
- Data source errors
- Data source queries
The aggregated data provides you access to several features:
- Dashboard and data source insights
- Presence indicator
- Sort dashboards by using insights data
- Visualize usage insight data in a dashboard
This feature also generates detailed logs that can be exported to Loki. Refer to Export logs of usage insights.
Dashboard and data source insights
For every dashboard and data source, you can access usage information.
Dashboard insights
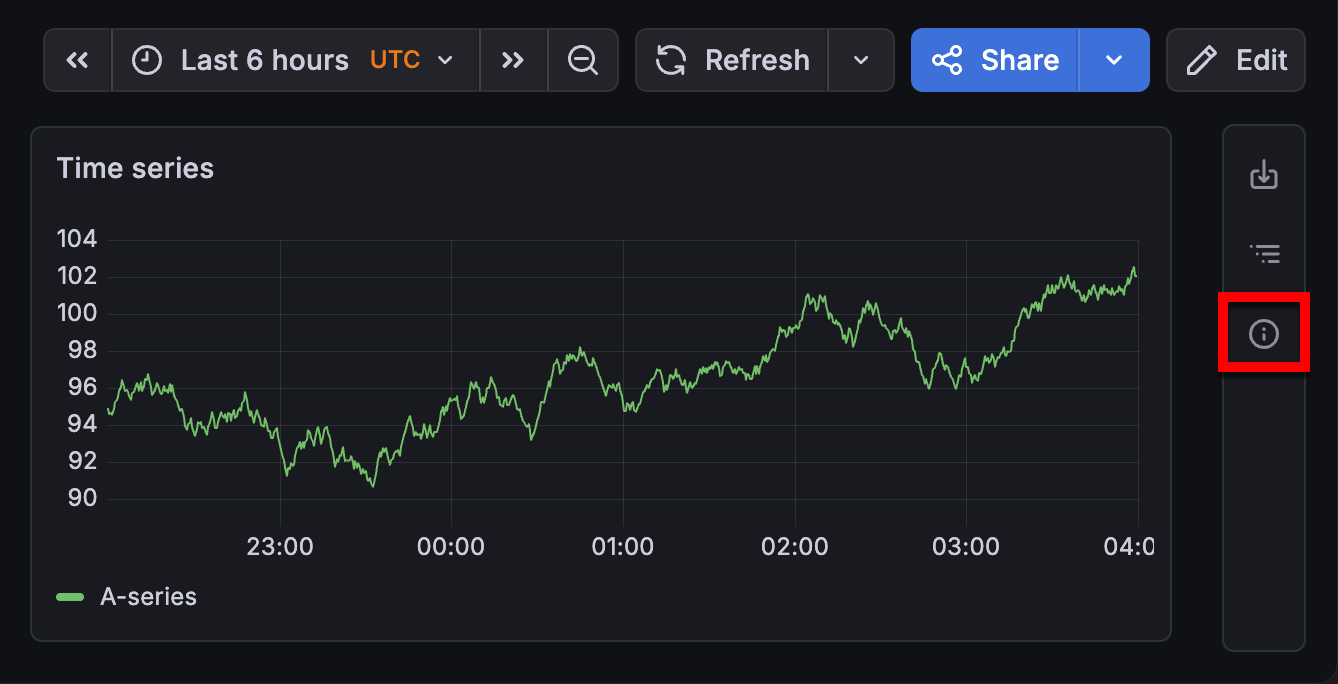
To see dashboard usage information, click the dashboard insights icon in the toolbar.
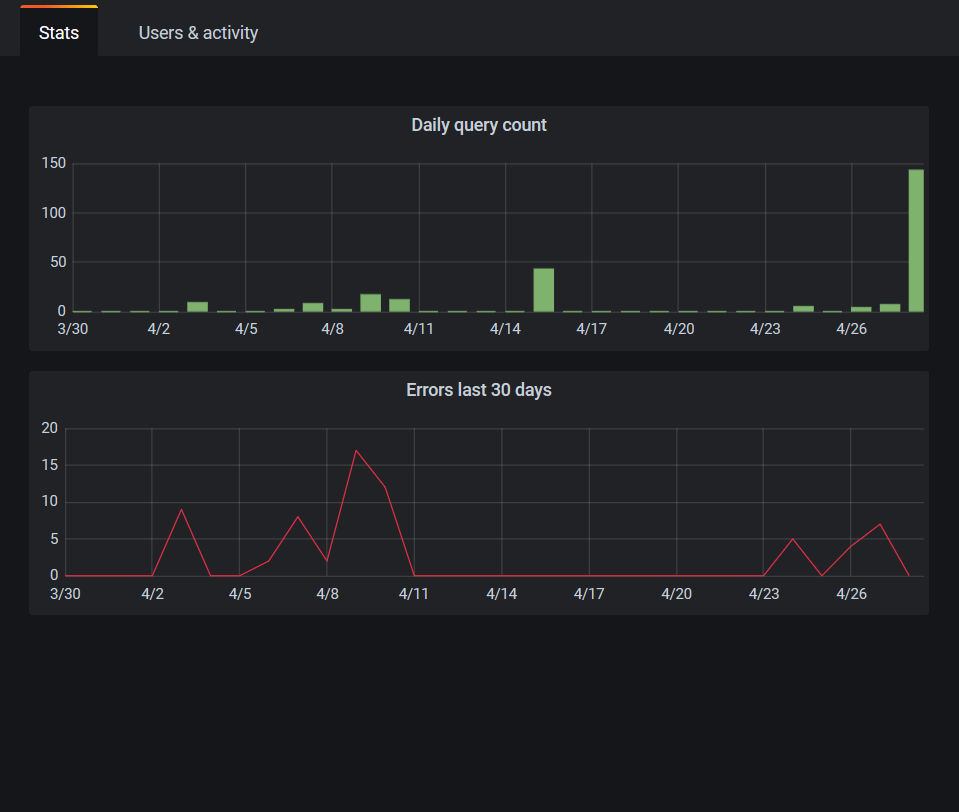
Dashboard insights show the following information:
- Stats: The number of daily queries and errors for the past 30 days.
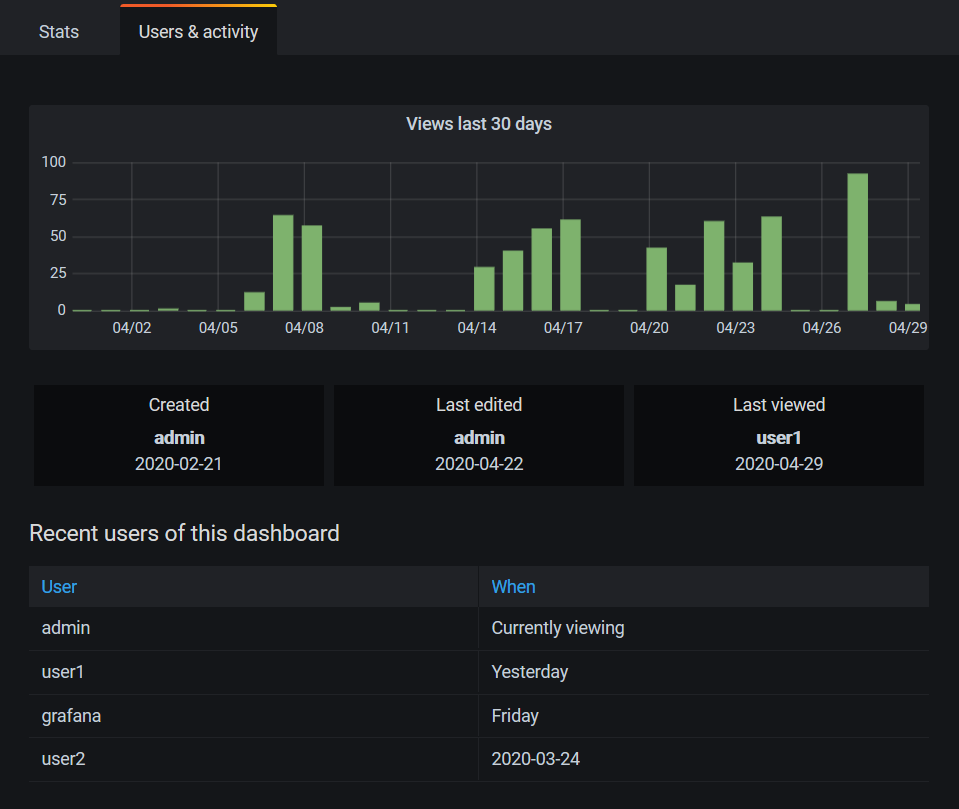
- Users & activity: The daily view count for the last 30 days; last activities on the dashboard and recent users (with a limit of 20).
If dashboard sharing is enabled, you’ll also see a Shared dashboards tab in your analytics.
Data source insights
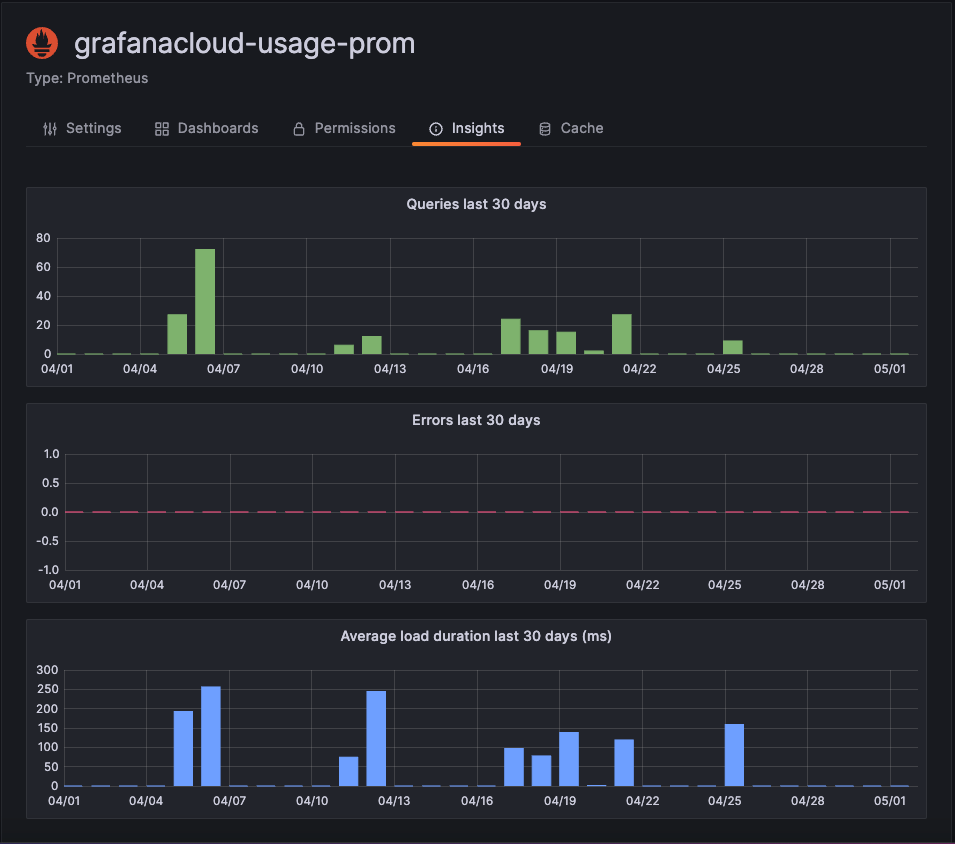
Data source insights provides information about how a data source has been used in the past 30 days, such as:
- Queries per day
- Errors per day
- Query load time per day (averaged in ms)
To find data source insights:
- Click Connections in the main navigation.
- Under Your connections, click Data sources.
- Click a data source.
- Click the Insights tab.
Presence indicator
When you are signed in and looking at a dashboard, you can know who is looking at the same dashboard as you are via a presence indicator, which displays avatars of users who have recently interacted with the dashboard. The default time frame is 10 minutes. To see the user’s name, hover over the user’s avatar. The avatars come from Gravatar based on the user’s email.
When there are more active users on a dashboard than can fit within the presence indicator, click the +X icon. Doing so opens dashboard insights, which contains more details about recent user activity.

To change recent to something other than the past 10 minutes, edit the configuration file:
[analytics.views]

# Set age for recent active users to 10 minutes
recent_users_age = 10m
To disable the presence indicator, edit the configuration file as follows:
[analytics.views]


# Disables the presence indicator
recent_users_age = 0
The dashboard won’t show any avatars and thus no recent user activity.
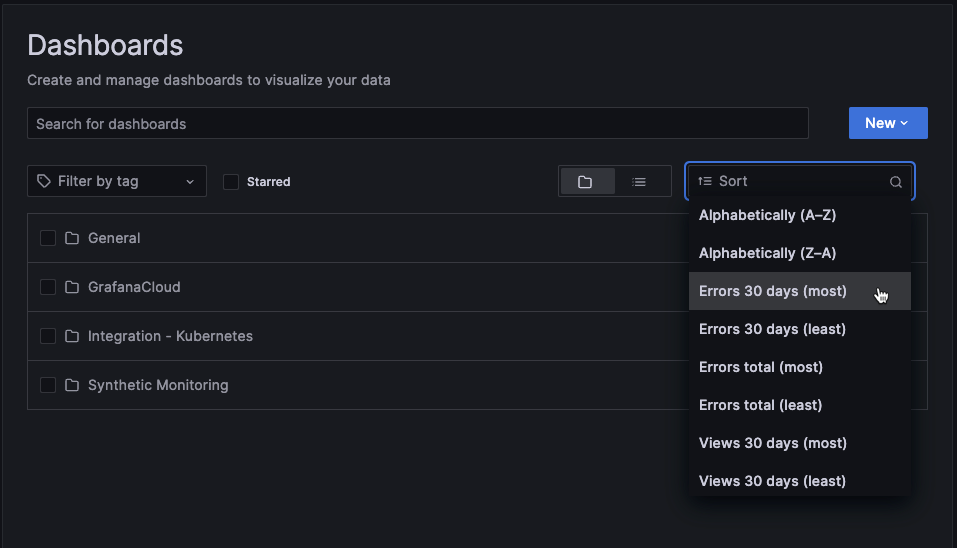
Sort dashboards by using insights data
In the search view, you can use insights data to help you find most-used, broken, and unused dashboards.
You can sort the dashboards by:
- Errors total
- Errors 30 days (most and least)
- Views total
- Views 30 days (most and least)
Visualize usage insights data
If you set up your installation to export logs of usage insights, there are two dashboards to help you take advantage of this data.
- Usage Insights overview provides a top-level perspective of user activity.
- Data source details dashboard provides a view of data source activity and health.
You can click the previous links to download the respective dashboard JSON, then import into your Grafana installation.


