
Provision Grafana
Grafana has an active provisioning system that uses configuration files. You can define data sources and dashboards using files that can be version controlled, making GitOps more natural.
Configuration file
Refer to Configuration for more information on what you can configure in grafana.ini.
Configuration file locations
Grafana reads its default configuration from <WORKING DIRECTORY>/conf/defaults.ini.
Grafana reads custom configuration from <WORKING DIRECTORY>/conf/custom.ini. You can override the custom configuration path with the --config option.
Note
The Deb and RPM packages install the configuration file at
/etc/grafana/grafana.ini. The Grafana init.d script sets the--configoption to that path.
Use environment variables
You can use environment variable lookups in all provisioning configuration. The syntax for an environment variable is $ENV_VAR_NAME or ${ENV_VAR_NAME}.
The following applies:
- Only use environment variables for configuration values. Do not use it for keys or bigger parts of the configuration file structure.
- Use environment variables in dashboard provisioning configuration, but not in the dashboard definition files themselves.
The following example looks up the data source URL port, user, and password using environment variables:
datasources:
  - name: Graphite
    url: http://localhost:$PORT
    user: $USER
    secureJsonData:
      password: $PASSWORD
Use of the special character $
Grafana’s provisioning system considers any set of characters after an $ a variable name.
During the replacement process, Grafana:
- Replaces the variables that use the syntax
${ENV_VAR_NAME}. - Next, it replaces the variables that use the syntax
$ENV_VAR_NAME.
If your data contains the character $, for example Pa$sw0rd, and you’re using an environment variable, use the $ENV_VAR_NAME syntax to avoid double expansion. If you use the ${ENV_VAR_NAME} syntax, the value will be first replaced as Pa$sw0rd and then again as Pa since $sw0rd will be considered another variable.
If you want to use the literal value Pa$sw0rd, you need to escape the character $ using a double $$: Pa$$sw0rd.
The following example shows how variables are replaced, assuming PASSWORD=Pa$sw0rd:
datasources:
  - name: Graphite
    secureJsonData:
      password1: $PASSWORD # Resolved as Pa$sw0rd
      password2: ${PASSWORD} # Resolved as Pa
      password3: 'Pa$$sw0rd' # Resolved as Pa$sw0rd
      password4: 'Pa$sw0rd' # Resolved as Pa
Configuration management tools
The Grafana community maintains libraries for many popular configuration management tools.
Data sources
You can manage data sources in Grafana by adding YAML configuration files in the provisioning/datasources directory.
Each configuration file contains a list of data sources, under the datasources key, to add or update during startup.
If the data source already exists, Grafana reconfigures it to match the provisioned configuration file.
You can also list data sources to automatically delete, using the key deleteDatasources.
Grafana deletes the data sources listed in deleteDatasources before adding or updating those in the datasources list.
You can configure Grafana to automatically delete provisioned data sources when they’re removed from the provisioning file.
To do so, add prune: true to the root of your data source provisioning file.
With this configuration, Grafana also removes the provisioned data sources if you remove the provisioning file entirely.
Run multiple Grafana instances
If you run multiple instances of Grafana, add a version number to each data source in the configuration and increase it when you update the configuration.
Grafana only updates data sources with the same or lower version number than the one set in the configuration file.
This prevents old configurations from overwriting newer ones if you have different versions of the datasource.yaml file that don’t define version numbers, and then restart instances at the same time.
Example data source configuration file
This example provisions a Graphite data source:
# Configuration file version
apiVersion: 1

# List of data sources to delete from the database.
deleteDatasources:
  - name: Graphite
    orgId: 1

# Mark provisioned data sources for deletion if they are no longer in a provisioning file.
# It takes no effect if data sources are already listed in the deleteDatasources section.
prune: true

# List of data sources to insert/update depending on what's
# available in the database.
datasources:
  # <string, required> Sets the name you use to refer to
  # the data source in panels and queries.
  - name: Graphite
    # <string, required> Sets the data source type.
    type: graphite
    # <string, required> Sets the access mode, either
    # proxy or direct (Server or Browser in the UI).
    # Some data sources are incompatible with any setting
    # but proxy (Server).
    access: proxy
    # <int> Sets the organization id. Defaults to orgId 1.
    orgId: 1
    # <string> Sets a custom UID to reference this
    # data source in other parts of the configuration.
    # If not specified, Grafana generates one.
    uid: my_unique_uid
    # <string> Sets the data source's URL, including the
    # port.
    url: http://localhost:8080
    # <string> Sets the database user, if necessary.
    user:
    # <string> Sets the database name, if necessary.
    database:
    # <bool> Enables basic authorization.
    basicAuth:
    # <string> Sets the basic authorization username.
    basicAuthUser:
    # <bool> Enables credential headers.
    withCredentials:
    # <bool> Toggles whether the data source is pre-selected
    # for new panels. You can set only one default
    # data source per organization.
    isDefault:
    # <map> Fields to convert to JSON and store in jsonData.
    jsonData:
      # <string> Defines the Graphite service's version.
      graphiteVersion: '1.1'
      # <bool> Enables TLS authentication using a client
      # certificate configured in secureJsonData.
      tlsAuth: true
      # <bool> Enables TLS authentication using a CA
      # certificate.
      tlsAuthWithCACert: true
    # <map> Fields to encrypt before storing in jsonData.
    secureJsonData:
      # <string> Defines the CA cert, client cert, and
      # client key for encrypted authentication.
      tlsCACert: '...'
      tlsClientCert: '...'
      tlsClientKey: '...'
      # <string> Sets the database password, if necessary.
      password:
      # <string> Sets the basic authorization password.
      basicAuthPassword:
    # <int> Sets the version. Used to compare versions when
    # updating. Ignored when creating a new data source.
    version: 1
    # <bool> Allows users to edit data sources from the
    # Grafana UI.
    editable: false
For provisioning examples of specific data sources, refer to that data source’s documentation.
JSON data
Not all data sources have the same configuration settings, only the most common ones are fields in the data source provisioning file.
To provision the rest of a data source’s settings, include them as JSON in the jsonData field.
Common settings in the built-in core data sources include:
Note
Data sources tagged with HTTP* communicate using the HTTP protocol, which includes all core data source plugins except MySQL, PostgreSQL, and MSSQL.
For examples of specific data sources’ JSON data, refer to that data source’s documentation.
Secure JSON data
Secure JSON data is a map of settings encrypted with a secret key. The encryption hides the JSON data from the users of Grafana. You should use secure JSON data to store TLS certificates and passwords for data source HTTP requests. All of these settings are optional.
Note
The HTTP* tag denotes data sources that communicate using the HTTP protocol, including all core data source plugins except MySQL, PostgreSQL, and MSSQL.
Custom HTTP headers for data sources
You can add HTTP headers to all requests sent to data sources managed by Grafana provisioning
Configure the header name in the jsonData field and the header value in secureJsonData.
The following example sets the HeaderName header to have the value HeaderValue and the Authorization header to have the value Bearer XXXXXXXXX:
apiVersion: 1

datasources:
  - name: Graphite
    jsonData:
      httpHeaderName1: 'HeaderName'
      httpHeaderName2: 'Authorization'
    secureJsonData:
      httpHeaderValue1: 'HeaderValue'
      httpHeaderValue2: 'Bearer XXXXXXXXX'
Plugins
You can manage plugin applications in Grafana by adding one or more YAML configuration files in the provisioning/plugins directory.
Each configuration file contains a list of apps that Grafana configures during start up.
Grafana configures each app to use the configuration in the file.
Note
This feature enables you to provision plugin configurations, not the plugins themselves. You must have already installed the plugin to use plugin configuration provisioning.
Example plugin configuration file
apiVersion: 1

apps:
  # <string> the type of app, plugin identifier. Required
  - type: raintank-worldping-app
    # <int> Org ID. Default to 1, unless org_name is specified
    org_id: 1
    # <string> Org name. Overrides org_id unless org_id not specified
    org_name: Main Org.
    # <bool> disable the app. Default to false.
    disabled: false
    # <map> fields that will be converted to json and stored in jsonData. Custom per app.
    jsonData:
      # key/value pairs of string to object
      key: value
    # <map> fields that will be converted to json, encrypted and stored in secureJsonData. Custom per app.
    secureJsonData:
      # key/value pairs of string to string
      key: value
Dashboards
You can manage dashboards in Grafana by adding one or more YAML configuration files in the provisioning/dashboards directory.
Each configuration file contains a list of providers that Grafana uses to load dashboards from the local filesystem.
Example dashboard configuration file
apiVersion: 1

providers:
  # <string> an unique provider name. Required
  - name: 'a unique provider name'
    # <int> Org id. Default to 1
    orgId: 1
    # <string> name of the dashboard folder.
    folder: ''
    # <string> folder UID. will be automatically generated if not specified
    folderUid: ''
    # <string> provider type. Default to 'file'
    type: file
    # <bool> disable dashboard deletion
    disableDeletion: false
    # <int> how often Grafana will scan for changed dashboards
    updateIntervalSeconds: 10
    # <bool> allow updating provisioned dashboards from the UI
    allowUiUpdates: false
    options:
      # <string, required> path to dashboard files on disk. Required when using the 'file' type
      path: /var/lib/grafana/dashboards
      # <bool> use folder names from filesystem to create folders in Grafana
      foldersFromFilesStructure: true
When Grafana starts, it updates or creates all dashboards found in the configured path.
It later polls that path every updateIntervalSeconds for updates to the dashboard files and updates its database.
Note
Grafana installs dashboards at the root level if you don’t set the
folderfield.
Make changes to a provisioned dashboard
You can make changes to a provisioned dashboard in the Grafana UI but its not possible to automatically save the changes back to the provisioning source.
If allowUiUpdates is set to true and you make changes to a provisioned dashboard, when you save the dashboard, Grafana persists the changes to its database.
Caution
If you save a provisioned dashboard in the UI and then later update the provisioning source, Grafana always overwrites the database dashboard with the one from the provisioning file. Grafana ignores the
versionproperty in the JSON file, even if it’s lower than the dashboard in the database.
Caution
If you save a provisioned dashboard in the UI and remove the provisioning source, Grafana deletes the dashboard in the database unless you have set the option
disableDeletiontotrue.
If you set allowUiUpdates to false, you can’t save changes to a provisioned dashboard.
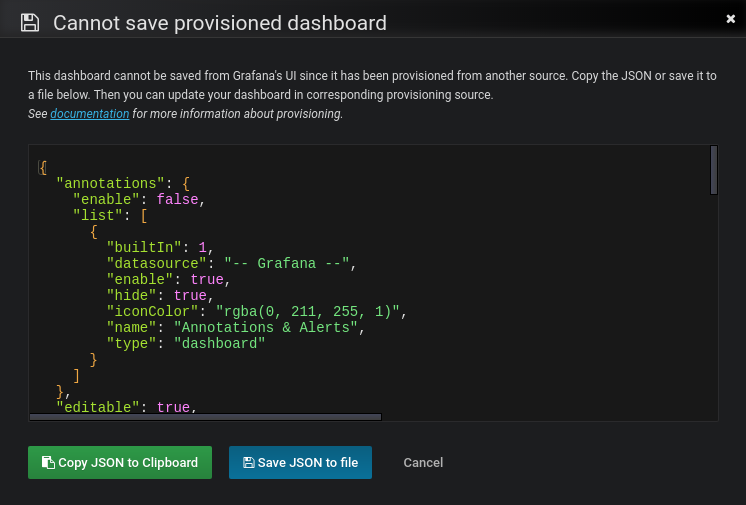
When you try to save changes to a provisioned dashboard, Grafana brings up a Cannot save provisioned dashboard dialog box.
Grafana offers options to export the JSON definition of a dashboard.
Use either Copy JSON to Clipboard or Save JSON to file to sync your dashboard changes back to the provisioning source.
Grafana removes the id field from the dashboard JSON to help the provisioning workflow.
The following screenshot illustrates this behavior.
Reusable dashboard URLs
If the dashboard in the JSON file contains an UID, Grafana updates that the dashboard with that UID in the database. This lets you migrate dashboards between Grafana instances and keep consistent dashboard URLs. When Grafana starts, it creates or updates all dashboards available in the configured folders.
Caution
You can overwrite existing dashboards with provisioning.
Be careful not to reuse the same
titlemultiple times within a folder oruidwithin the same Grafana instance to avoid inconsistent behavior.
Provision folders structure from filesystem to Grafana
If you already store your dashboards using folders in a Git repository or on a filesystem, and want to have the same folder names in the Grafana menu, use foldersFromFilesStructure option.
For example, to replicate the following dashboards structure from the filesystem to Grafana:
/etc/dashboards
├── /server
│   ├── /common_dashboard.json
│   └── /network_dashboard.json
└── /application
    ├── /requests_dashboard.json
    └── /resources_dashboard.json
use the following provisioning configuration file:
apiVersion: 1

providers:
  - name: dashboards
    type: file
    updateIntervalSeconds: 30
    options:
      path: /etc/dashboards
      foldersFromFilesStructure: true
Grafana creates the server and application folders in the UI.
To use foldersFromFilesStructure, you must unset the folder and folderUid options.
To provision dashboards to the root level, store them in the root of your path.
Note
This feature doesn’t let you create nested folder structures, where you have folders within folders.
Alerting
For information on provisioning Grafana Alerting, refer to Provision Grafana Alerting resources.
Supported settings
The following sections detail the supported settings and secure settings for each alert notification type.
In the provisioning YAML use settings for settings and secure_settings for secure settings.
Grafana encrypts secure settings in the database.
Alert notification pushover
Alert notification discord
Alert notification slack
Alert notification victorops
Alert notification kafka
Alert notification LINE
Alert notification MQTT
TLS configuration
Alert notification pagerduty
Alert notification sensu
Alert notification sensugo
Alert notification prometheus-alertmanager
Alert notification teams
Alert notification dingding
Alert notification email
Alert notification opsgenie
Alert notification telegram
Alert notification threema
Alert notification webhook
TLS configuration
HMAC signature configuration
Alert notification googlechat
Alert notification Cisco Webex Teams
Grafana Enterprise
Grafana Enterprise supports:


