
What's new from Grafana Labs
Grafana Labs products, projects, and features can go through multiple release stages before becoming generally available. These stages in the release life cycle can present varying degrees of stability and support. For more information, refer to release life cycle for Grafana Labs.
Loading...
Area of interest:
Cloud availability:
Cloud editions:
Self-managed availability:
Self-managed editions:
No results found. Please adjust your filters or search criteria.
There was an error with your request.
We are excited to announce the public preview of native histograms!
Native histograms are a metric type in Prometheus that can produce, store, and query high-resolution histograms of observations. They usually offer higher resolution and more straightforward instrumentation than classic histograms.
We’re excited to announce that k6 browser checks in Synthetic Monitoring are now generally available.
k6 browser checks allow you to go beyond traditional monitoring, enabling you to test and validate real user flows and gain insight into performance in ways you can’t with HTTP-level checks. With browser checks, you’re not just monitoring performance at a protocol level; you’re simulating user interactions that provide you with a much richer view of your app’s behavior in production.
You can define custom labels at the scrape job level across all services in a job, making it easier to:
- Attribute costs
- Track ownership
- Apply consistent metadata
Especially valuable for teams without direct access to AWS tagging, this feature:
You can now configure logs queries per-service and override the global configuration for services in Application Observability.
This feature allows you to change how service details query logs and facilitate traces to logs, providing the flexibility to mix and match signals across databases and datasources.
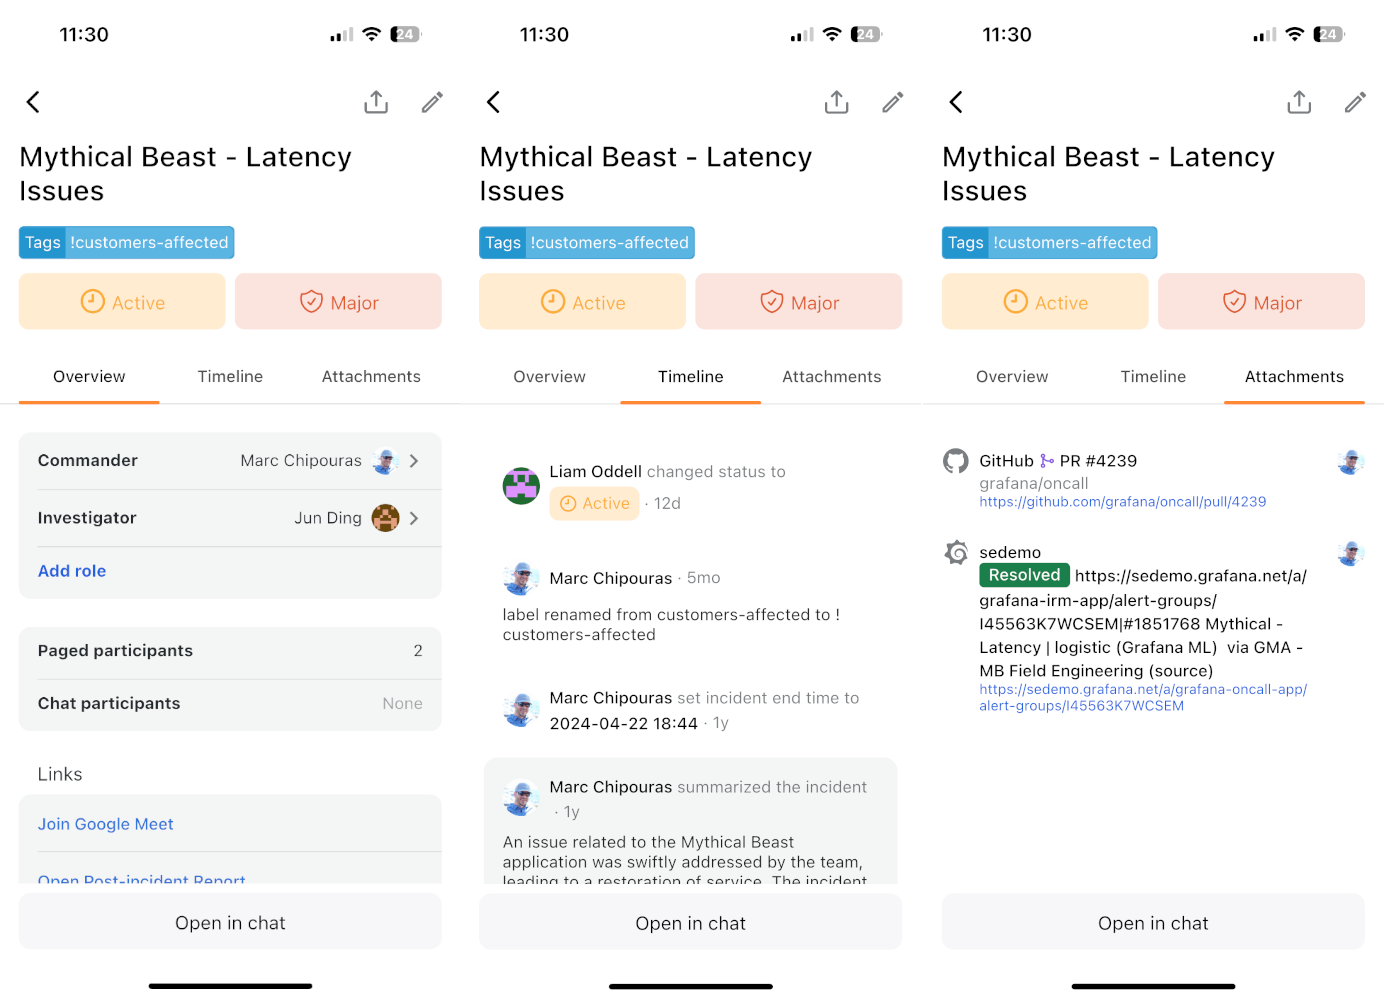
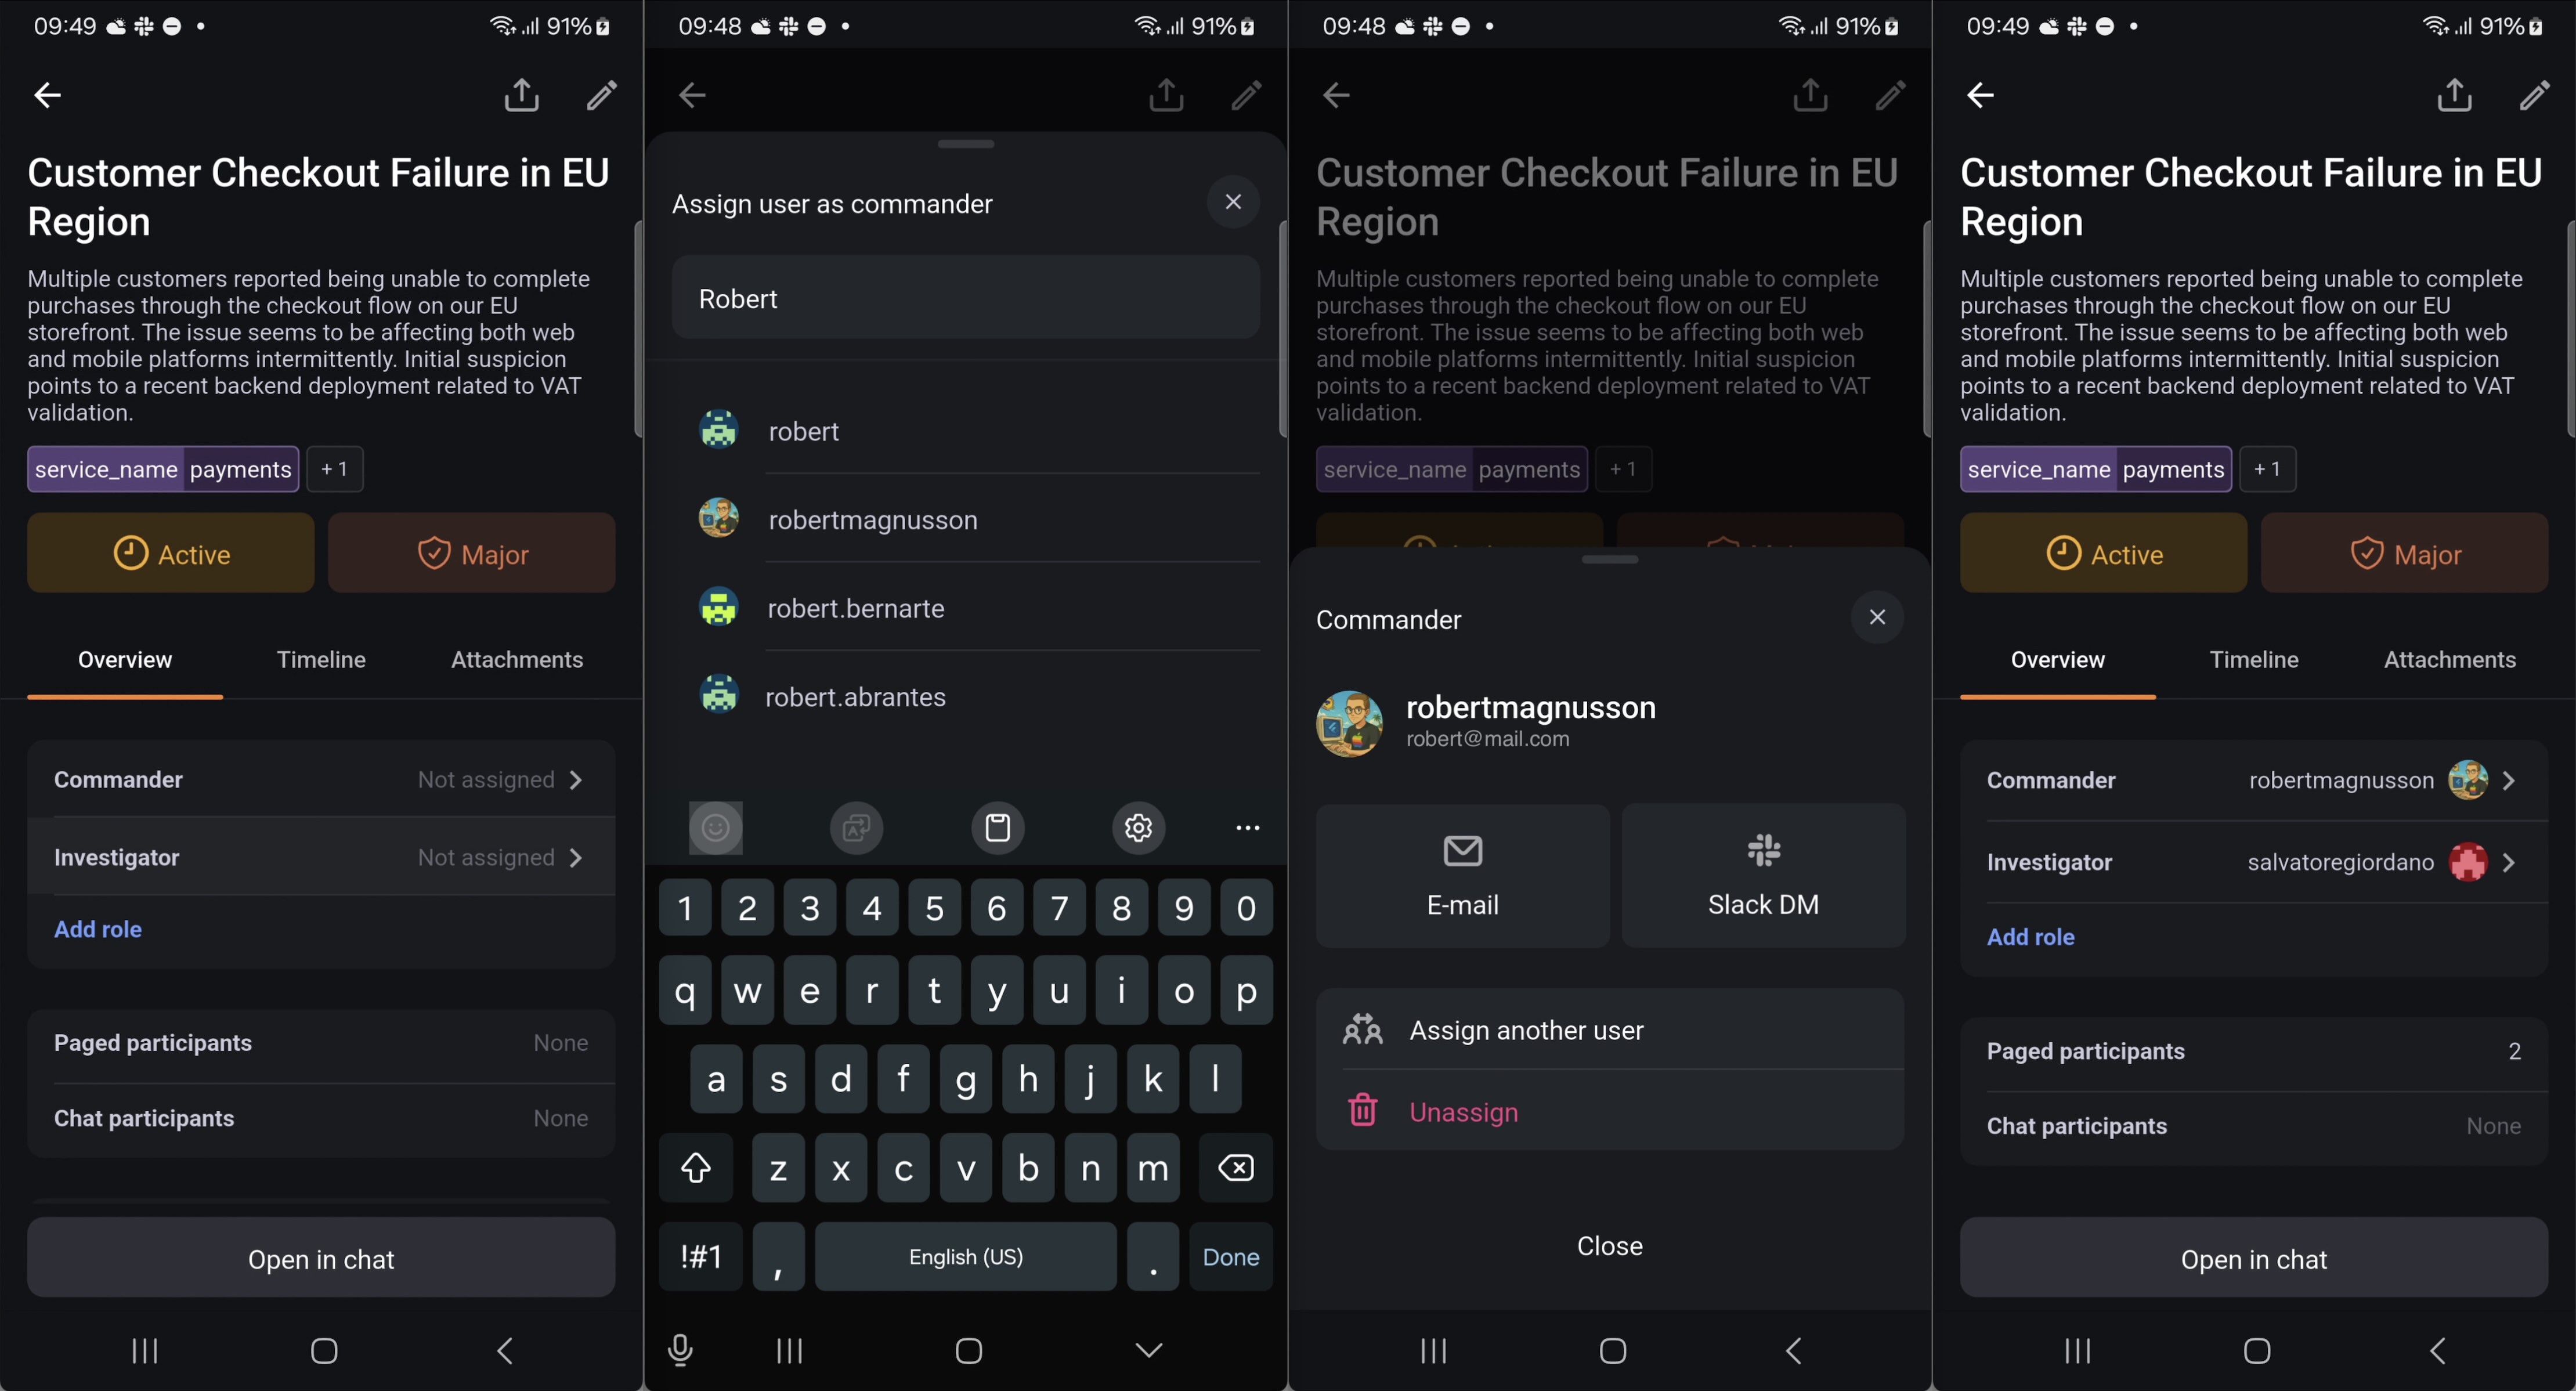
We keep making it easier to manage incidents from anywhere — no laptop needed!
With this latest update, you can now dive into the full incident timeline directly from your phone. Instantly catch up on everything that’s happened: comments, notes, attachments, and key activity — all organised chronologically.
We are excited to announce the General Availability (GA) release of Grafana Traces Drilldown, bringing a simplified, queryless experience to distributed tracing analysis. Building on months of public preview feedback and lessons learned from the Drilldown suite, this GA release delivers a refined, integrated solution for deep-dive trace analysis.
Pipelines in Grafana Fleet Management can now inject variable collector attribute values into their configurations. This powerful new feature enables you to create dynamic configurations that adapt to each collector’s characteristics, reducing the need for multiple similar pipelines.
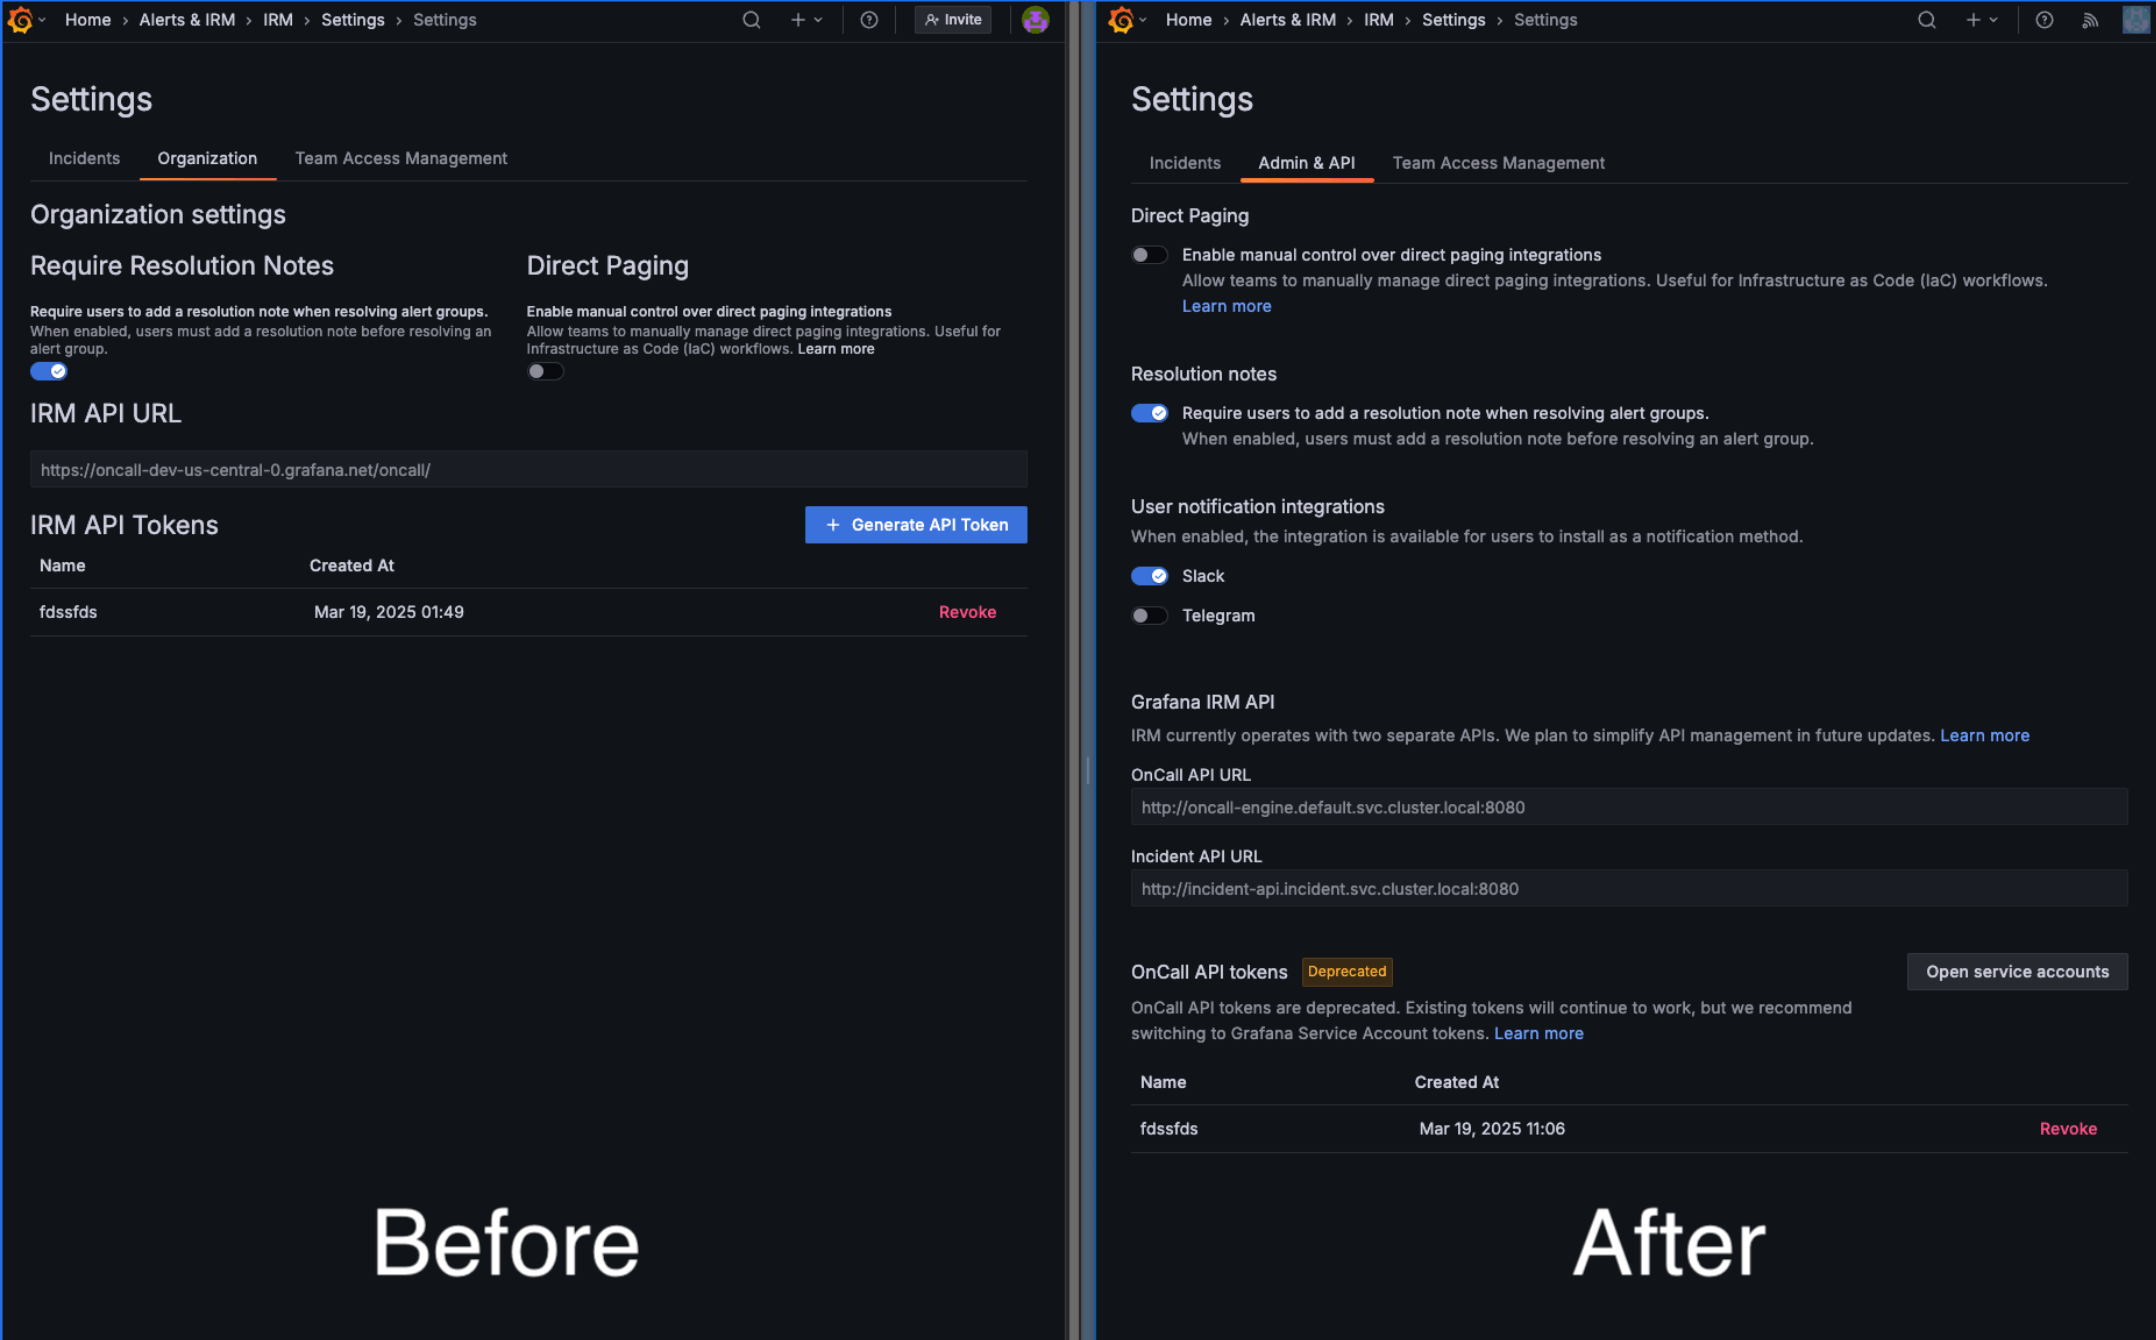
We’ve made several updates to the IRM settings to give administrators greater visibility and control:
- Renamed the Organization settings to Admin & API.
- Added Admin-level setting to enable or disable the availability of notification channels (such as Slack or MS Teams) across all user profiles.
- Deprecated OnCall API tokens in favor of Grafana Cloud service accounts. Existing OnCall API tokens can still be used, viewed, and deleted, but new tokens can no longer be generated.
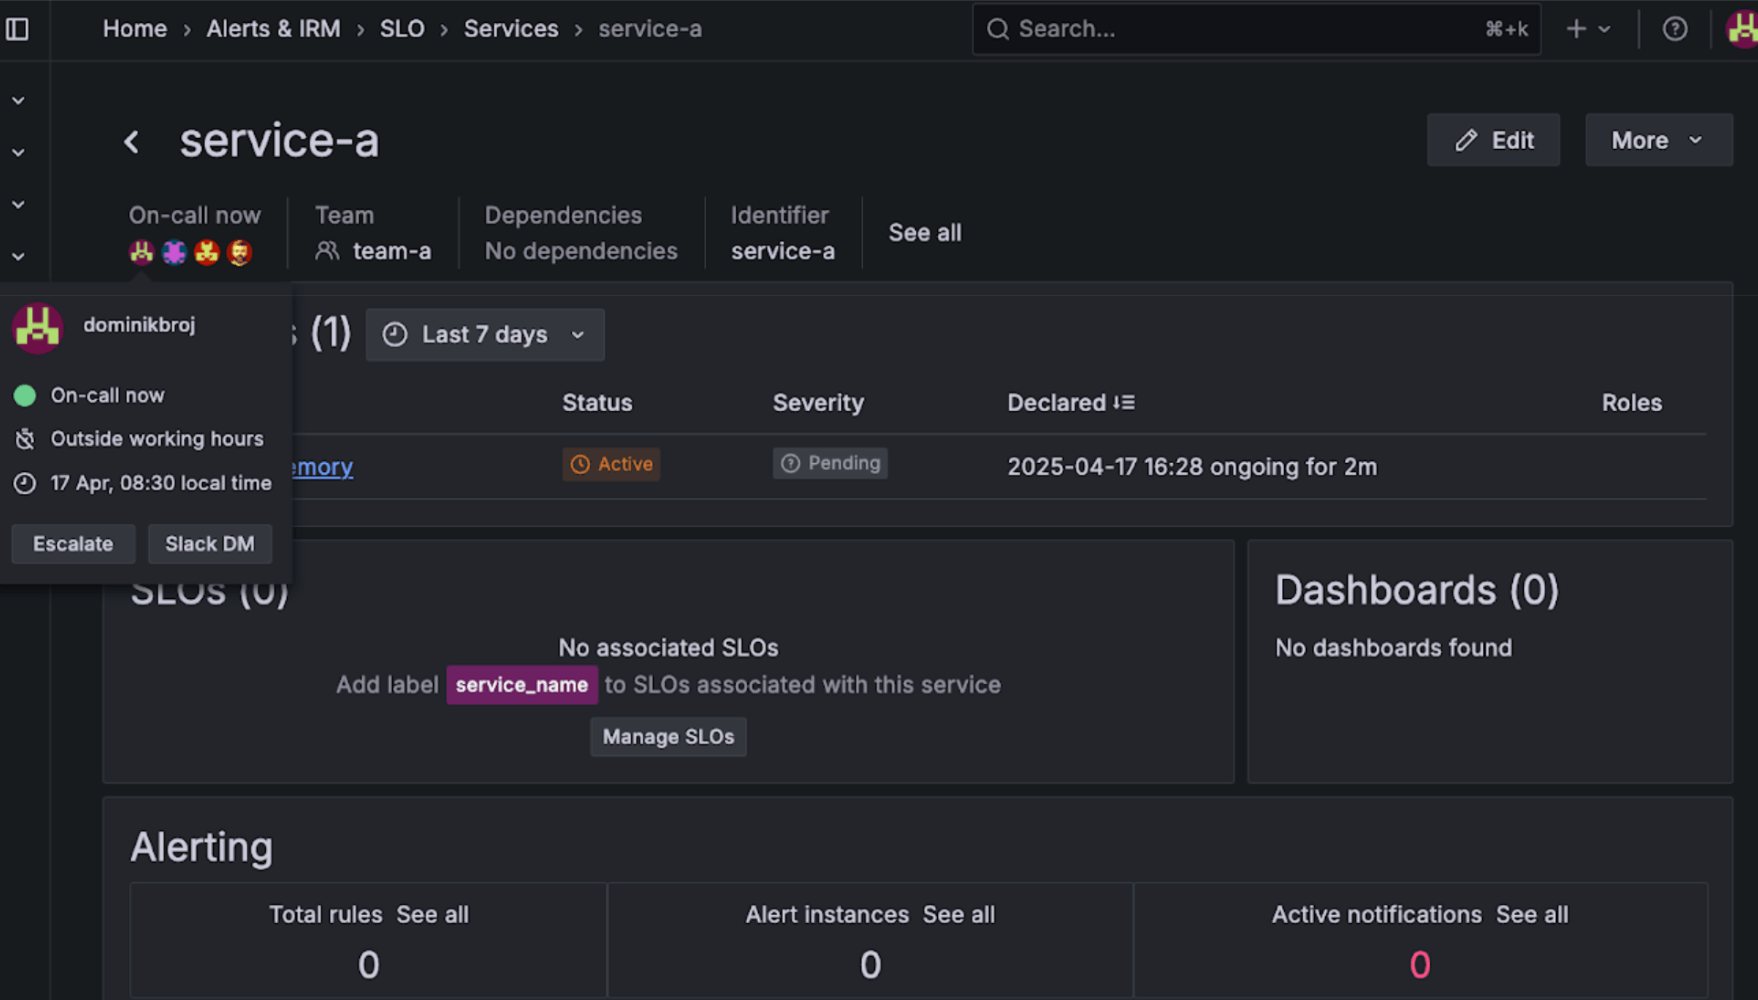
We’ve made it easier to understand ownership and take action immediately when a service looks off. The latest update to Grafana Service Center brings IRM (incident response management) context directly into the service details view. You can now quickly see who’s on-call and escalate issues without leaving Service Center.
Grafana’s dashboard schema has stayed mostly the same for years, originally built around a single grid layout. Over time, it became more complex and harder to work with, mixing different concerns and adding unnecessary complications. In Grafana v12, we’re introducing a new dashboard schema.
In the middle of an incident? Deploying a service? Would having every log line available help?
Now with Pause Adaptive Logs, end users of logs can temporarily ingest the logs they need for the service, application, or cluster they care about, without needing to configure anything in Adaptive Logs or work with their centralized team. Get all the cost savings benefits of Adaptive Logs, while making sure your dev teams aren’t stranded during an Incident!

We continue adding more functionality to the IRM mobile app to make incident management smoother and more flexible, allowing you to react instantly from anywhere.
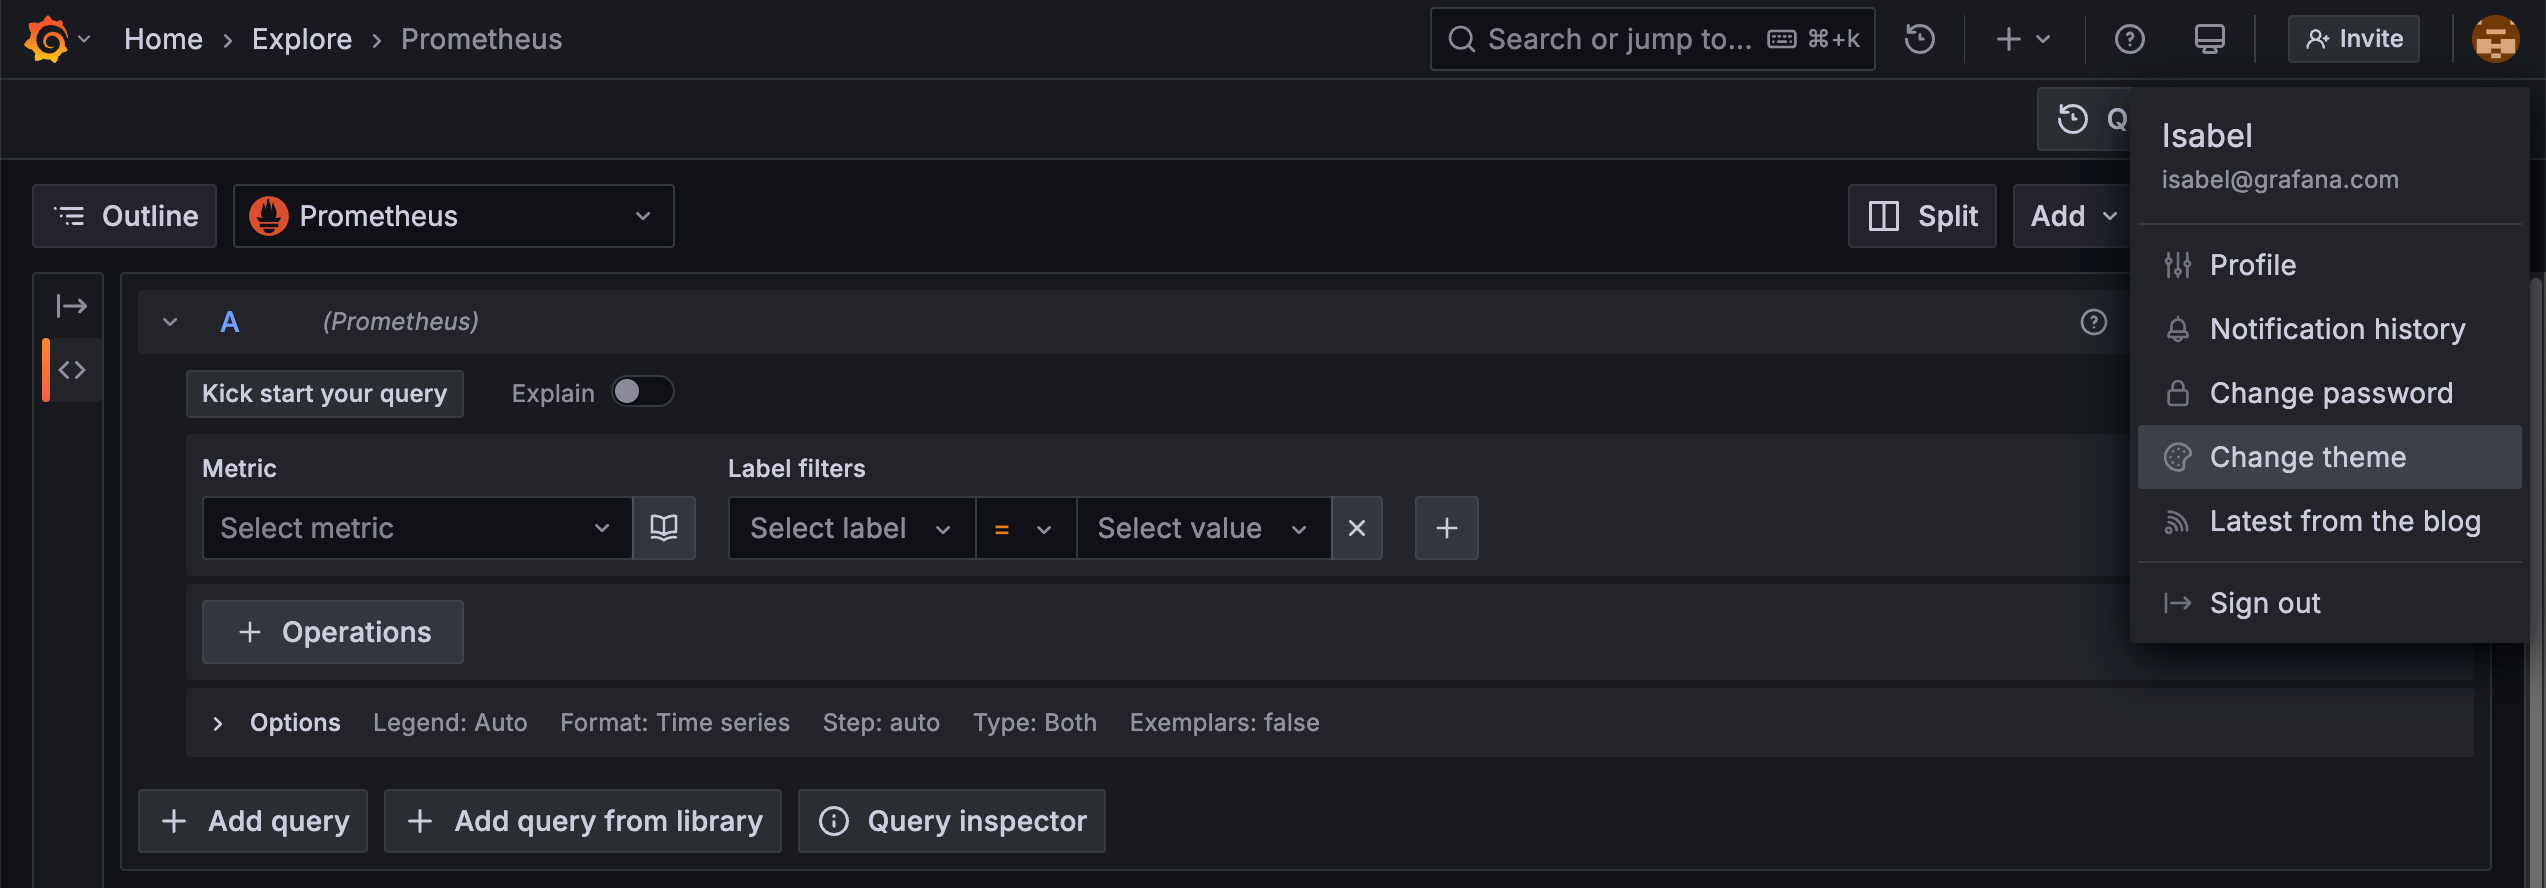
We’re giving the community early access to several new experimental themes to celebrate the release of Grafana 12! You can jazz up your Grafana experience with Sapphire dusk, Tron, Gilded grove, Gloom, or Desert bloom. To see the color scheme of a theme before selecting it, click the user icon in the top-right corner of the page and select Change theme.
Last year, we migrated our dashboard architecture to the Scenes library, unlocking a more stable, dynamic, and flexible foundation for the future of Grafana dashboards. Today, we’re excited to showcase what the team has built on top of it, with a strong focus on improving core user workflows: navigating, consuming, and editing dashboards.
Introducing new controls for Logs in Explore
We’re excited to introduce a new controls component for Logs in Explore, designed to make better use of the layout around logs, and give users greater flexibility when working with log data.