
What's new from Grafana Labs
Grafana Labs products, projects, and features can go through multiple release stages before becoming generally available. These stages in the release life cycle can present varying degrees of stability and support. For more information, refer to release life cycle for Grafana Labs.
Loading...
Area of interest:
Cloud availability:
Cloud editions:
Self-managed availability:
Self-managed editions:
No results found. Please adjust your filters or search criteria.
There was an error with your request.
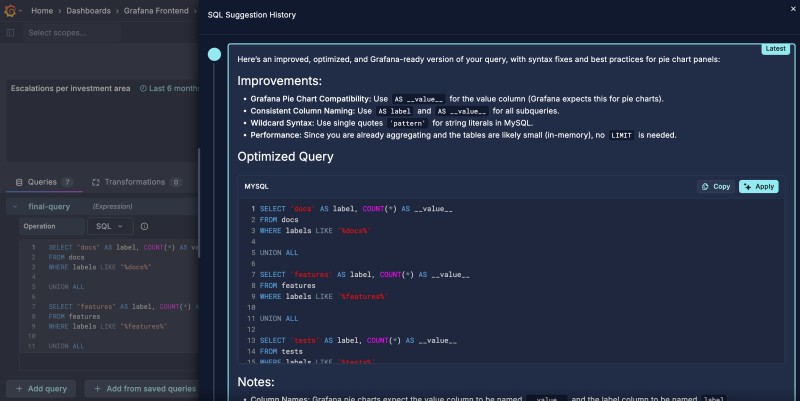
Grafana SQL Expressions, Grafana’s solution for manipulating and transforming the results of data source queries using SQL (MySQL dialect) syntax, is now available in Public Preview.
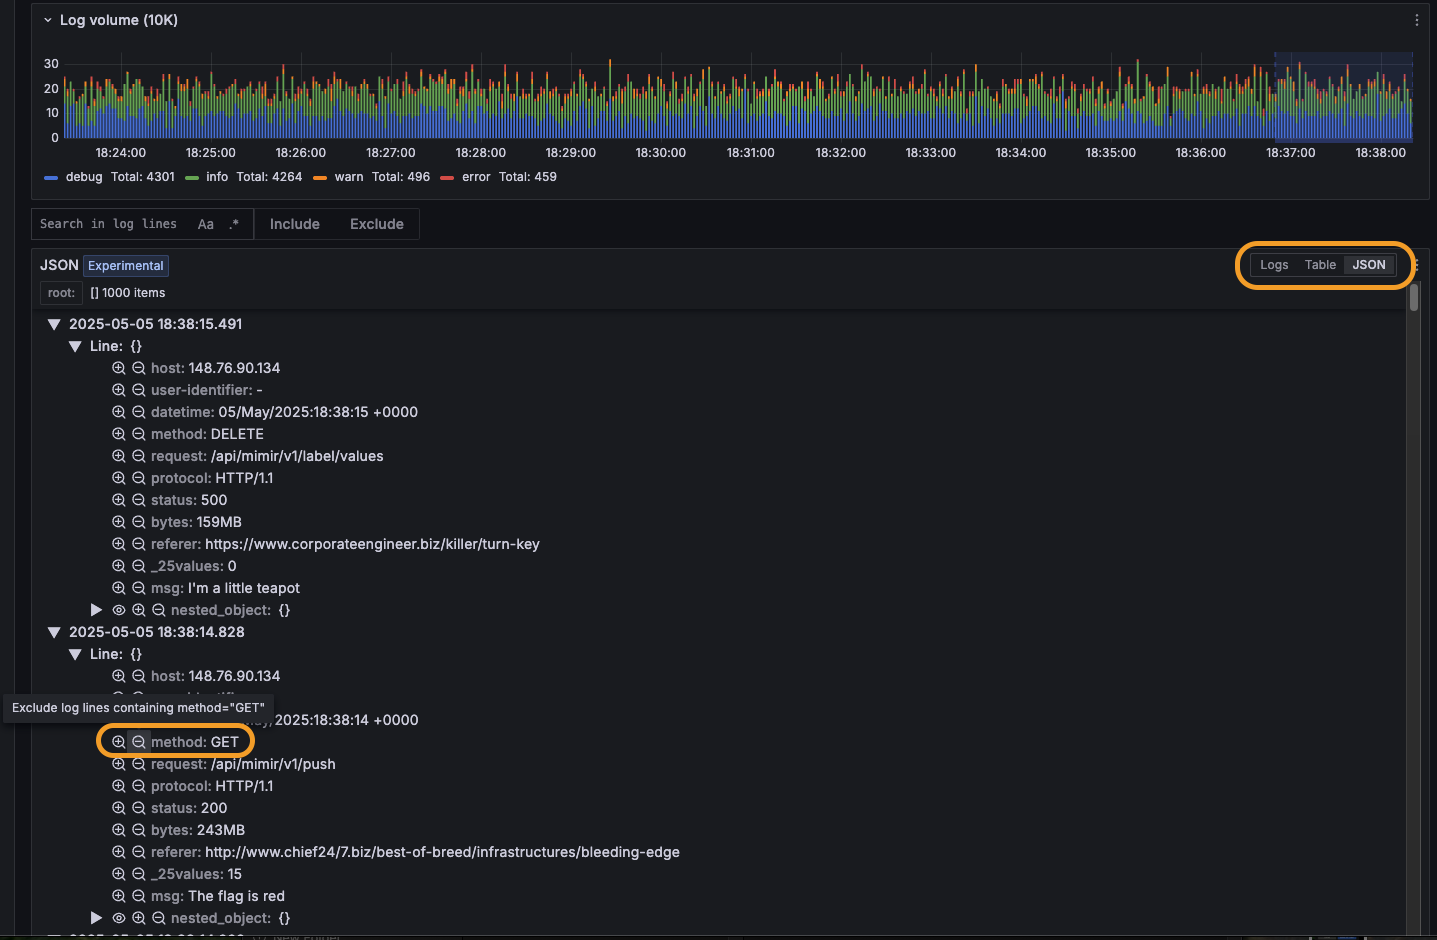
Because Ad hoc filters can’t be reliably implemented on SQL data sources, we’re introducing a new way forward. Starting with this release, you can now query a dataset from a first panel using a SQL data source, then build the rest of your dashboard on top of that dataset—and use ad hoc filters to drill into it.
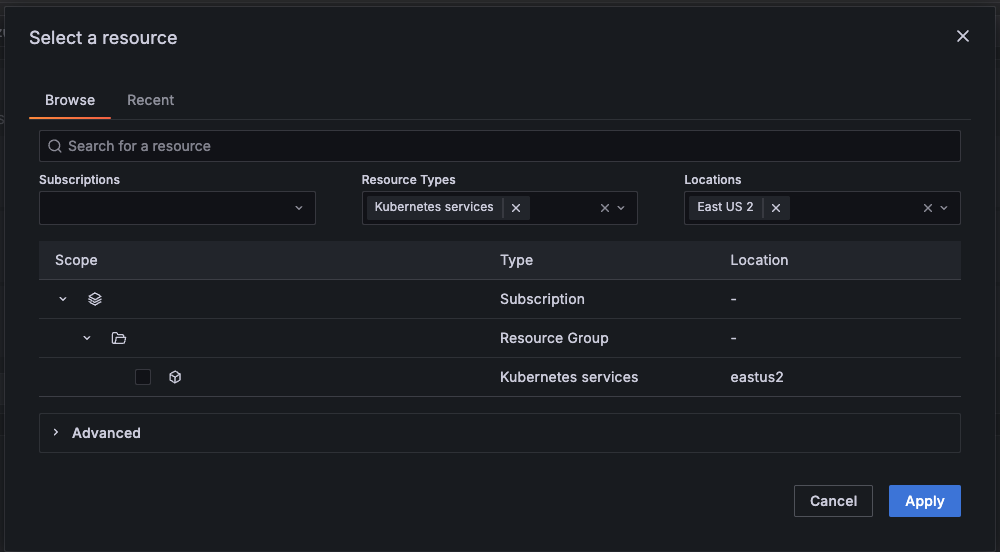
The Azure Monitor resource picker has been revamped to better support users with large Azure estates.
The key changes are support for filtering and the ability to browse recent resources.
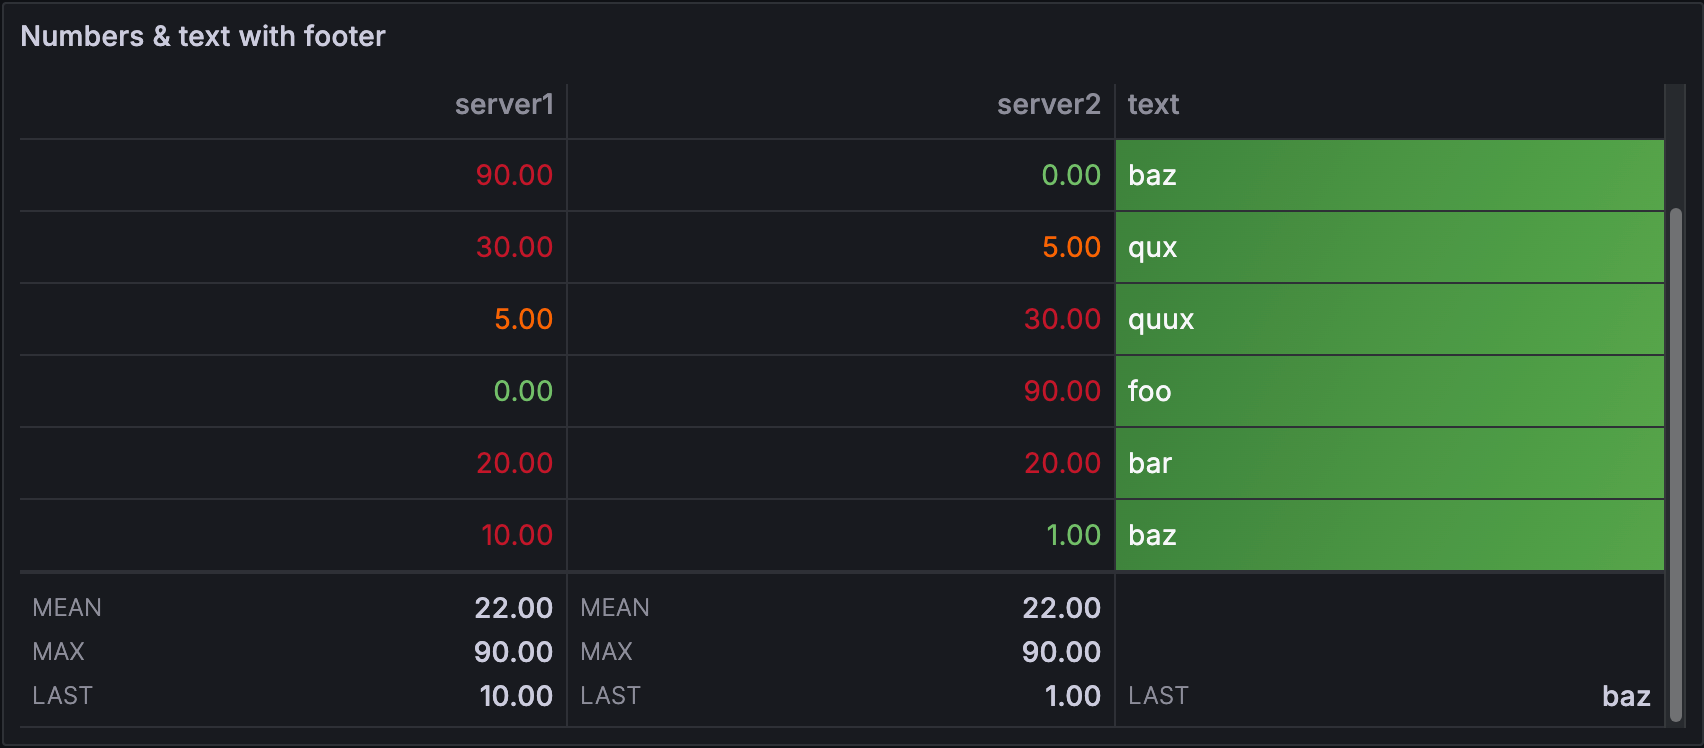
The table footer displays the results of calculations (and reducer functions) on fields. We’ve updated the footer so that you can apply multiple calculations or reducers simultaneously:
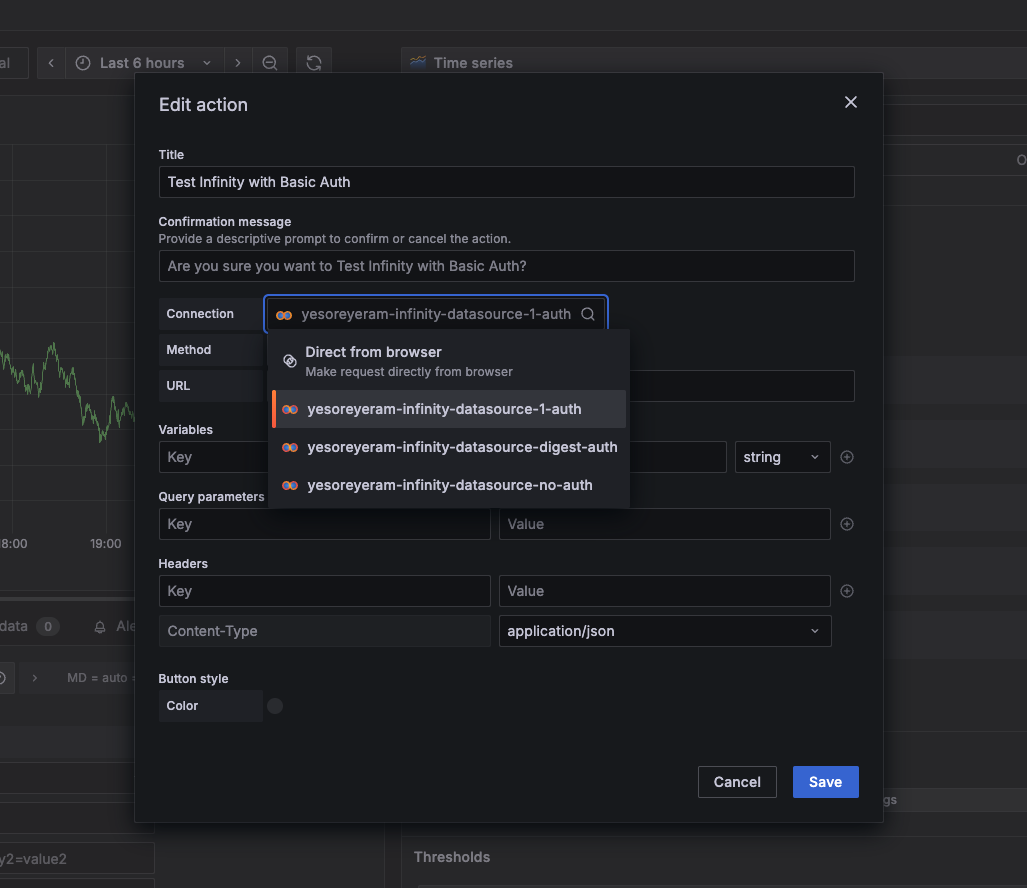
Visualization actions now support authenticated HTTP requests by integrating with the Infinity data source. This lets you perform actions that require authentication by leveraging preconfigured Infinity data source connections.
Save money and apply an extra layer of network security by using GCP Private Service Connect to send telemetry data to Grafana Cloud.
Normally when you send telemetry from your GCP network to Grafana Cloud, you incur in network egress fees and your data, though encrypted, traverses the public internet.
With this release, we’re rethinking our dashboard APIs and making the default a new model that is consistent, versioned, and resource-oriented.
We started the rollout in May. Since then, we’ve gathered feedback, measured impact, and improved testing. We’re now confident the APIs are stable and have made them the default.
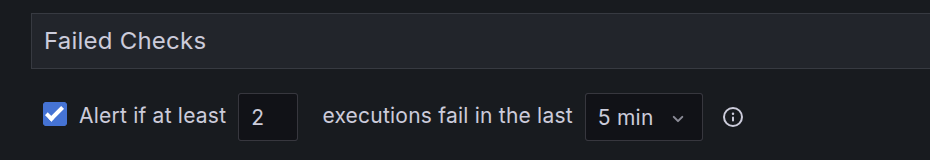
We’re excited to announce the general availability of new alerting capabilities for Synthetic Monitoring. These new capabilities are available to all Grafana Cloud users.
You can now create alerts for each check in your Synthetic Monitoring application. For example, you can create an alert based on the number of check failures in a specific time window, with different settings for each one of your checks.
Status updates are crucial communication milestones during incident response, providing stakeholders with essential information about progress, status changes, and severity adjustments. Now you can view the complete timeline of key updates, see what changed and when, and contribute your own status updates with rich text content and “severity” or “status” modifications.
We are excited to announce the general availability of Amazon CloudWatch metric streams.
CloudWatch metric streams with Amazon Data Firehose offer you a less expensive, highly accurate way to import metrics from AWS into Grafana Cloud. As with CloudWatch metrics scrape, CloudWatch metric streams do not require you to deploy or maintain Alloy agents or servers and can be configured as code using Terraform or using a CloudFormation template.
You can now control the direction of connections between canvas elements by mapping the direction to a field value. A positive value draws the connection arrow forward, a negative value draws it in reverse, and a value of zero removes the directional arrow entirely. Alternatively, you can assign a fixed direction value.
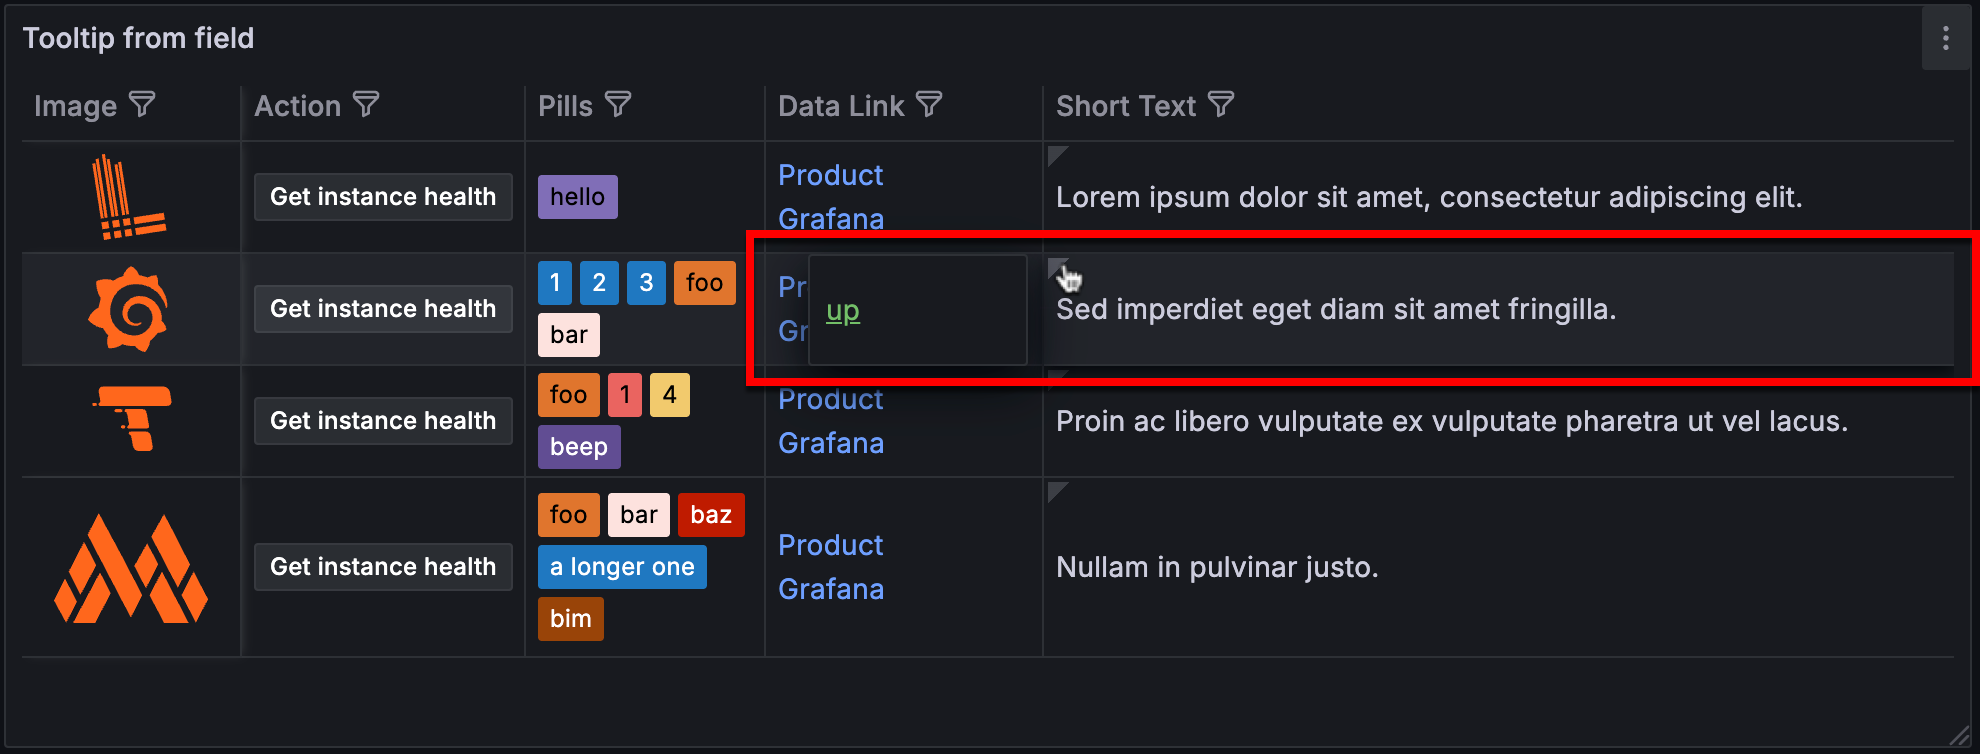
The Tooltip from field option in table visualizations allows you to use the values from another field (or column) in a tooltip.
When you toggle the switch on, you can select from a drop-down list any of the fields in the table to be used as the source of the tooltip content. All table fields are available for selection, whether visible or hidden.
We are excited to announce the general availability of k6 extensions in Grafana Cloud k6.
Grafana Assistant, Grafana’s AI tool within Grafana, is now available in Public Preview.
Grafana Assistant is an AI tool that can…
- … create dashboards.
- … write queries.
- … help you get onboarded.
- … support you in learning Grafana.
- … support in investigations and incidents.
Read our blog or watch a short video on how you can get started with Grafana Assistant.