
What's new from Grafana Labs
Grafana Labs products, projects, and features can go through multiple release stages before becoming generally available. These stages in the release life cycle can present varying degrees of stability and support. For more information, refer to release life cycle for Grafana Labs.
Loading...
Area of interest:
Cloud availability:
Cloud editions:
Self-managed availability:
Self-managed editions:
No results found. Please adjust your filters or search criteria.
There was an error with your request.
The Jenkins data source allows you to query and visualize metrics such as projects, builds, build queues, nodes and load statistics from within Grafana.
This enterprise plugin includes two built-in dashboards to help you quickly get started visualizing Jenkins data:
- Jenkins Overview dashboard provides an overview of the Jenkins instance, including all projects, nodes, executor status and build queue.
- Jenkins DORA Metrics dashboard provides information on four key metrics used to assess software development team performance: deployment frequency, lead time for changes, change failure rate and time to restore service. These metrics focus on both the speed and stability of software delivery.
We’re excited to announce the public preview release of secrets management for Synthetic Monitoring, available to all Grafana Cloud users.
Secrets management gives you a centralized place to securely store sensitive data like API keys, passwords, and tokens.
We’re excited to announce the integration of the Model Context Protocol (MCP) into Grafana Cloud Traces and into open-source Tempo (merged, available in Tempo 2.9). MCP, a standard developed by Anthropic, allows data sources to expose data and functionality to Large Language Models (LLMs) via an agent.
This integration opens up new possibilities for interacting with tracing data. You can now connect LLM-powered tools like Claude Code or Cursor to Grafana Cloud Traces, enabling you to:
- Explore services and understand interactions: LLMs can be used to teach new developers about service interactions within an application by analyzing tracing data. For instance, a new developer could ask the AI to explain how their services interact. The AI would use live tracing data from Cloud Traces to answer these questions.
- Diagnose and investigate errors: You can leverage LLMs to identify and diagnose errors in your systems. The AI can answer questions like “Are there errors in my services?”, “What endpoints are being impacted”, etc?
- Optimize performance and reduce latency: LLMs can assist in identifying the causes of latency and guiding optimization efforts. By analyzing trace data, an LLM can summarize operations in a request path, pinpoint bottlenecks, and even suggest code changes to improve performance, such as parallelizing operations.
Grafana IRM outgoing webhooks now support incident events, providing a unified experience for automating alert group and incident workflows. You can configure webhooks from the Outgoing Webhooks tab and trigger requests based on key incident lifecycle events, such as when an incident is declared, updated, or resolved.
With this update, you can:
- Customize webhook requests with support for any HTTP method
- Use templated URLs, headers, and request bodies
- Dynamically reference incident data and prior webhook responses
- View webhook execution details directly from the incident or alert group timeline
- Manage incident-related webhook configurations using Terraform
Creating effective alert rules often requires knowing exactly what query to write upfront. But sometimes you need to explore your data first — understanding how metrics behave across different label combinations, spotting patterns, and building confidence in your monitoring approach before committing to an alert rule.
The Solution:
Metrics Drilldown integration brings visual data exploration directly into alert creation. Launch from your alert rule editor into Grafana’s queryless Metrics Drilldown experience, where you can “quickly find related metrics with just a few simple clicks, without needing to write a PromQL query.” Explore your Prometheus data through intuitive point-and-click interactions, visualize how metrics break down across labels, and leverage “smart segmentation” with “optimal chart types selected automatically.” When you discover the perfect visualization, click through to Explore to grab the underlying query and use it in your alert rule.
What Makes This Special:
We’re excited to share a new integration between Tailscale and Grafana Cloud that lets you query data sources on your Tailscale network directly from your Grafana Cloud stack.
Tailscale allows you to create a secure network (called a tailnet) by directly connecting users, devices, and resources. This new integration adds an ephemeral machine to your tailnet on your behalf. You can add tags to these machines, which allow you to configure Tailscale ACLs and Grants, giving you full control of what your Grafana Cloud stack can access.
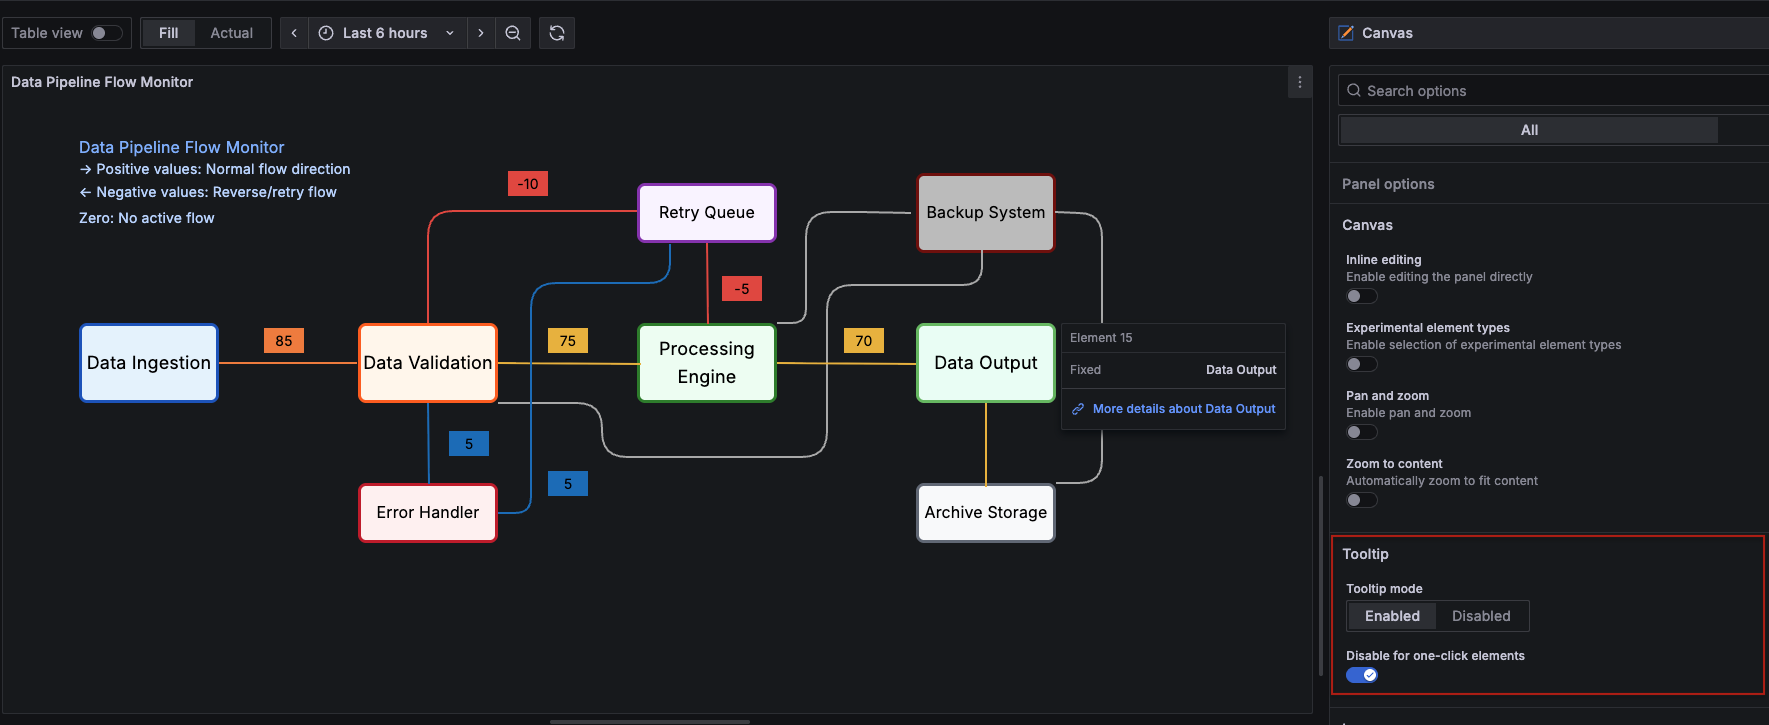
The canvas visualization editor now offers a completely re-engineered pan and zoom experience.
You can now place elements anywhere—even beyond panel edges—without disrupting connections or layouts. Background images stay consistent, connection anchors rotate with elements, and an optional Zoom to content toggle automatically fits your canvas content to any view. Constraints remain intact thanks to a transparent root container, ensuring layout behavior stays reliable across pan and zoom operations.
Constraint system support
Grafana SLO now supports exporting existing SLOs in HCL format and generating HCL during new SLO creation so users can use Terraform to manage their SLOs.
- Users looking to export an existing SLO into HCL format should locate their SLO on the Manage SLO screen, click the More drop-down, and select Export
- Users looking to create a new SLO to be exported should navigate to the Manage SLO screen, click the more drop-down on the top right of the page, and select New SLO for export
You can now choose to enable or disable tooltips in canvas visualizations. The Tooltip mode setting controls the display of tooltips when hovering over elements in a canvas that are connected to data, data links, or actions.
Additionally, you can now use the Disable for one-click elements option to selectively hide tooltips on elements that have one-click functionality enabled. This enhancement prevents tooltips from interfering with one-click interactions while still allowing tooltips on other elements.
The process for configuring alerting using Faro data coming from your frontend apps has just gotten a whole lot easier. Introducing Grafana Cloud Frontend Observability out of the box alerting. We have taken the first step in helping users configure Grafana-managed alerts without needing any previous experience with alerting in Grafana Cloud.
Using our simple workflows you can enable and configure alerts based on your web app’s errors and web vital metrics. Find and troubleshoot issues sooner now that alert configuration and rules are handled automatically. Additionally, these alerts can serve as templates for you to expand the alerting coverage of your frontend apps.
You can now add Status updates to incidents in Grafana IRM to help keep your team and stakeholders informed during an incident.
Status updates are structured messages that communicate key information throughout the incident lifecycle. Whether you’re confirming impact, escalating to another team, or resolving the issue, use status updates to help track and share progress in a consistent, high-signal way.
The Grafana Advisor is designed to help Grafana server administrators keep their instances running smoothly, securely and in keeping with best practices.
It performs a series of periodic checks against your Grafana instance to highlight issues requiring the server administrator’s attention.
Apply this transformation to any dataset to add a trendline as a new series, fitted to your data using linear regression. This allows you to infer what the data was at a point that may not be exactly represented in the original dataset, or plot predicted values in the future. Trendlines are great for spotting patterns in fluctuating or inconsistent time series. This transformation is extra useful because trendlines can be styled and used just like any other series in your visualization. The Trendline transformation supports both linear and polynomial regression models.
See examples of this transformation on Grafana Play.

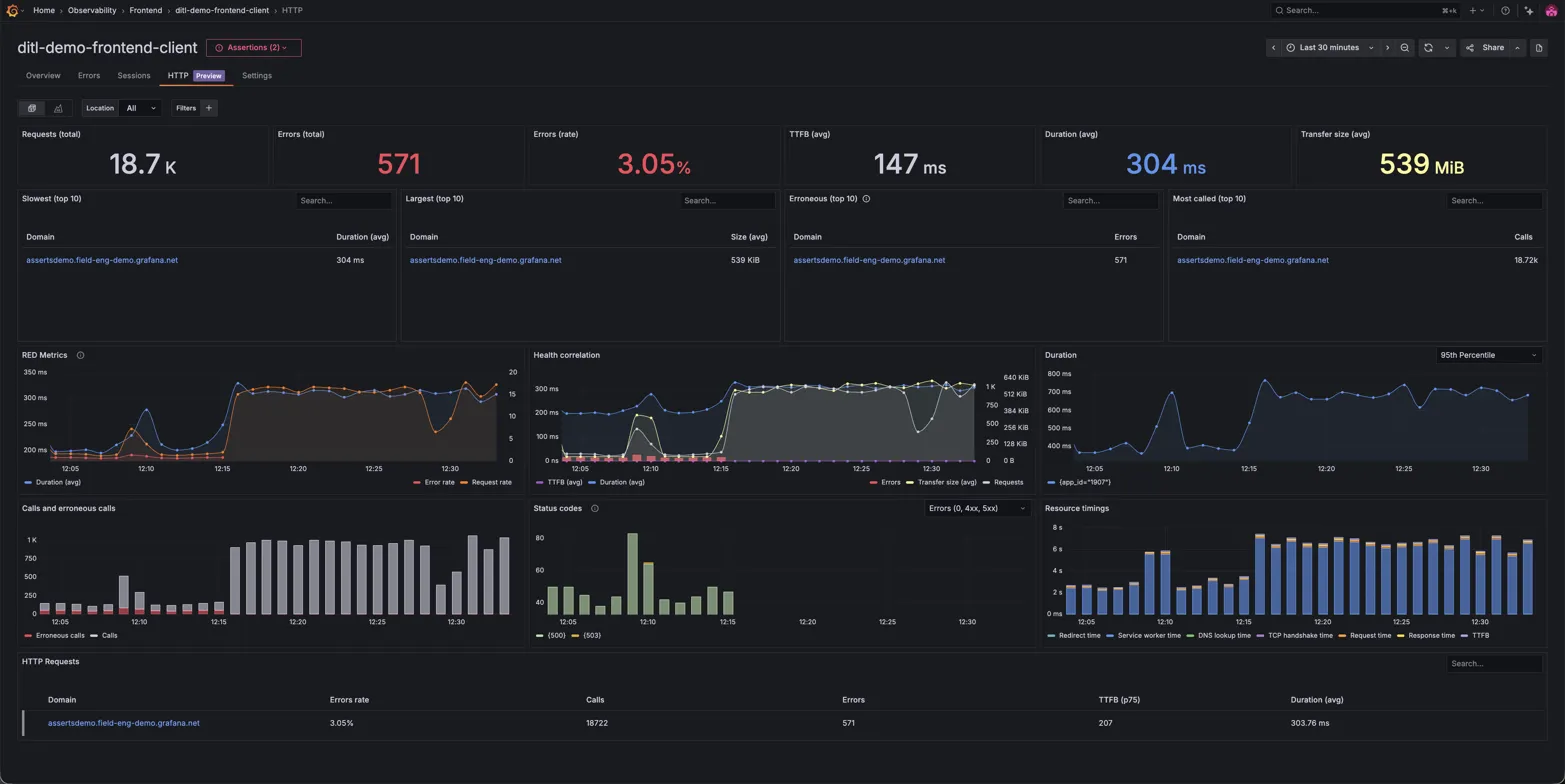
You can now visualize HTTP Performance Insights in Grafana Cloud Frontend Observability. This feature provides a unified view of your slowest endpoints, largest requests, and most error-prone calls, helping you quickly identify and resolve application performance issues.
No more hunting through scattered logs or custom dashboards. These views and breakdowns help you discover insights and gauge impact. You can understand:
- Which API endpoints or assets are causing slowdowns or errors?
- How widespread is a specific performance issue?
- What are the biggest opportunities for optimization based on how issues occur over time.
Instantly pivot from Kubernetes Monitoring to the exact EC2 instance in Cloud Provider Observability that’s impacting performance or stability. Whether it’s a failing node, resource exhaustion, or an unreachable instance, this seamless cross-layer visibility removes manual guesswork and eliminates the need for context-switching.

View GPU utilization panels on the GPU tabs of Cluster and Node detail pages to discover whether Nvidia GPUs inside the Cluster are appropriately utilized and whether workloads are getting and using the GPU resources that have been made available.
