What's new from Grafana Labs
Grafana Labs products, projects, and features can go through multiple release stages before becoming generally available. These stages in the release life cycle can present varying degrees of stability and support. For more information, refer to release life cycle for Grafana Labs.
Loading...
Area of interest:
Cloud availability:
Cloud editions:
Self-managed availability:
Self-managed editions:
No results found. Please adjust your filters or search criteria.
There was an error with your request.
Introducing Catchpoint data source plugin.
The Catchpoint data source plugin allows you to query and visualize Tests, RUM and SLO data from within Grafana.
Running tests has become common in recent years, but it’s only part of the story. The real value lies not just in testing but also in analyzing the results. Was the system under test stable? How was its performance?
Grafana Explore now allows for logs filtering and pinning in content outline.
Filtering Logs: All log levels are now automatically available in the content outline. You can filter by log level, currently supported for Elasticsearch and Loki data sources. To select multiple filters, hold down the command key on Mac or the control key on Windows while clicking.
More easily create silences directly from the Alert rule list view or detail page.
These rule-specific silences are guaranteed to only apply to a single rule and permissions to read, create, update or delete are tied to a user’s permissions for that rule.
Manage silences through Role-Based Access Control (RBAC). In addition to the Grafana open source functionality in Rule-specific silences with permissions, you can choose who can create, edit, and read silences using the following permissions:
Send alert notifications to Amazon Simple Notifications Service (Amazon SNS).
Grafana Cloud Traces users now get partial results from TraceQL queries as they come in, rather than having to wait for all results to be returned at once. This allows you to start looking at traces matched by your query immediately, speeding up your root cause analysis.
Enables you to easily choose which templates you want to use in your alert notification messages by adding a template selector in the Contact Points form.
Fetching a rule group no longer requires the datasources:query permission for every data source used by the rules within that group. Now, the only requirements are alert.rules:read and folders:read for the folder the group is contained in.
For the past few months we’ve been working on a major update of our Dashboards architecture and migrated it to the Scenes library. This migration provides us with more stable, dynamic, and flexible dashboards as well as setting the foundation for what we envision the future of Grafana dashboards will be. Here are two of the improvements that are being introduced as part of this work:
Introducing a major performance improvement for the PDF export feature.
Are you tired of waiting for your PDF to be generated or your report to be sent? We’re working on a major update of the dashboard-to-PDF feature to make it faster for large dashboards. The generation time will no longer be proportional to the number of panels in your dashboard. As an example, an SLO dashboard containing around 200 panels has gone from taking more than seven minutes to be generated to only eleven seconds.
Version 2.15.0 of the OpenSearch plugin introduces support for visualizing Service Map for Open Search traces ingested with OpenSearch Data Prepper.
Service map in Grafana enables customers to view a map of their applications built using microservices architecture. With this map, customers can detect performance issues, or increase in error rates in any of their services.
In order to display the map, select Traces query type in the query editor and switch on the Service Map toggle.
The SLO Performance page provides a filterable view as to how your team and service SLOs are performing. This is critical for customers with a large amount of SLOs who would like to view a logical subset. To get started - tag your SLOs with the team_name and/or service_name labels.
Configure OAuth2 authentication for any Alertmanager or Mimir receiver (called Contact Points in Grafana) through the user interface.
OAuth2 is not implemented for the Grafana built-in Alertmanager.
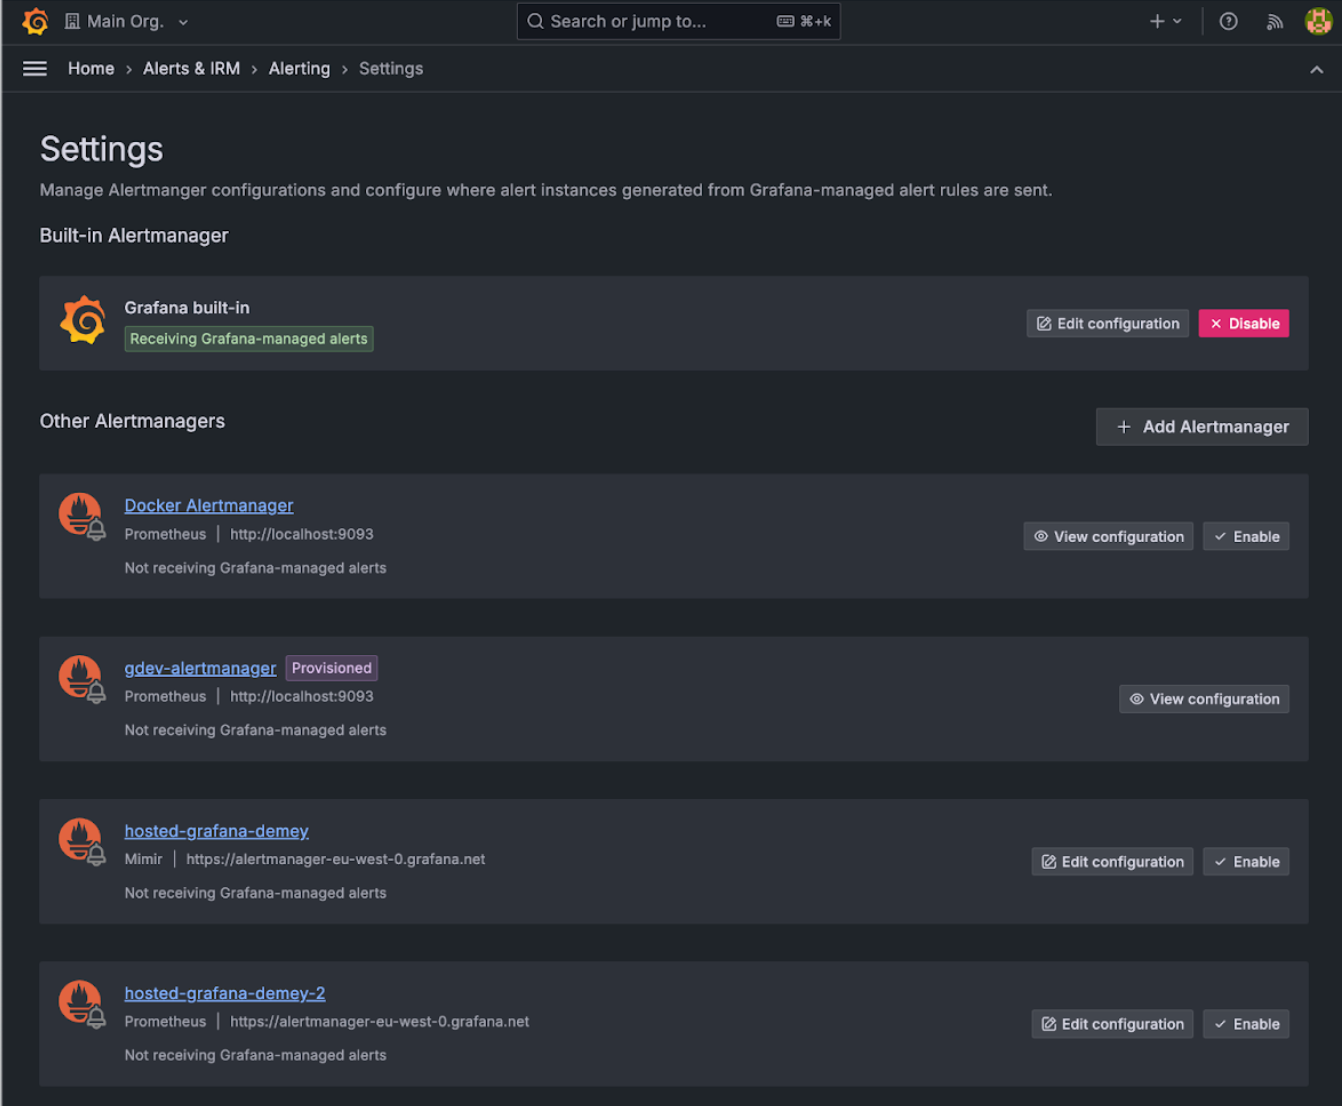
The new settings page provides you with a holistic view of where Grafana-managed alert instances are forwarded.
- Manage which Alertmanagers receive alert instances from Grafana-managed rules without navigating and editing data sources.
- Manage version snapshots for the built-in Alertmanager, which allows administrators to roll back unintentional changes or mistakes in the Alertmanager configuration.
- There is also a visual diff that compares the historical snapshot with the latest configuration to see which changes were made.