What's new from Grafana Labs
Grafana Labs products, projects, and features can go through multiple release stages before becoming generally available. These stages in the release life cycle can present varying degrees of stability and support. For more information, refer to release life cycle for Grafana Labs.
Loading...
Area of interest:
Cloud availability:
Cloud editions:
Self-managed availability:
Self-managed editions:
No results found. Please adjust your filters or search criteria.
There was an error with your request.
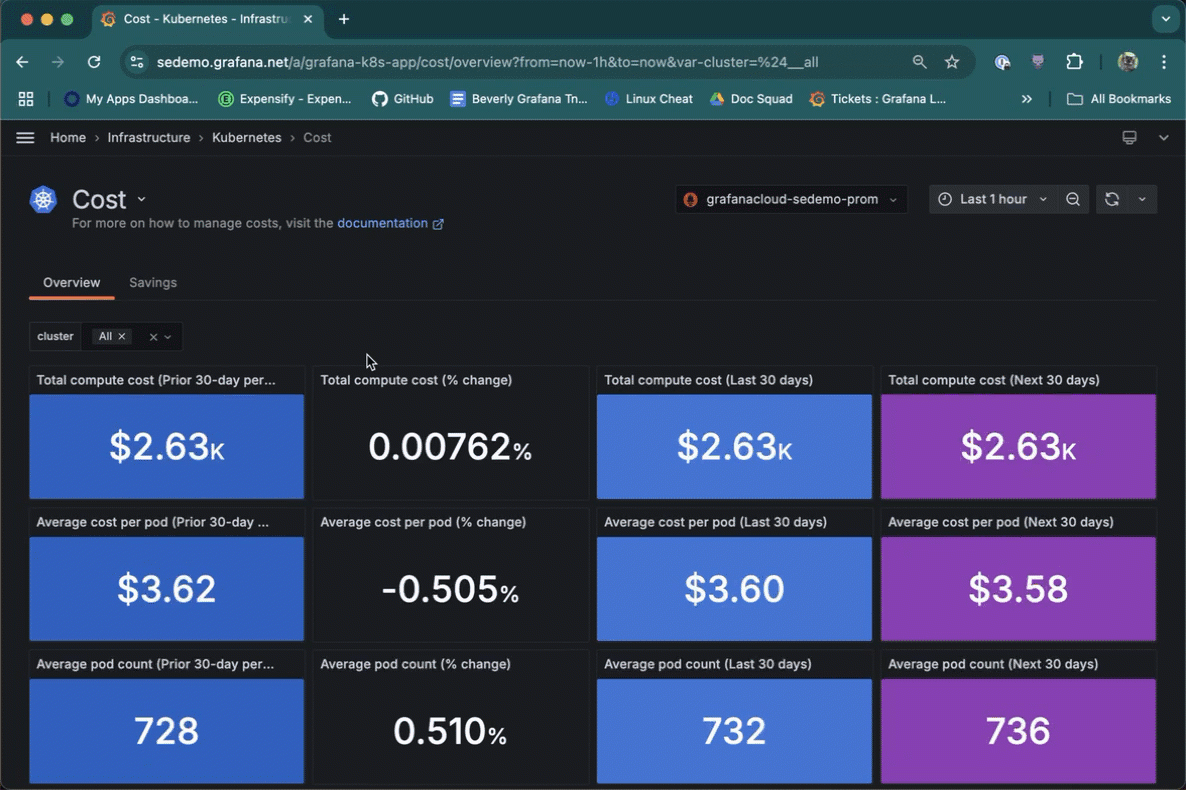
Jumpstart your alert creation and customization. Throughout Kubernetes Monitoring, panels from CPU usage to cost are ready for you to create and customize an alert.
Grafana admins struggle to effectively communicate important updates and maintenance information to their users through traditional channels like email and Slack. Customers have requested a feature to display customizable banners within the Grafana interface to ensure critical information is visible and timely.

Introducing the new mobile app home screen
The new home screen is a centralized hub that gives you an at-a-glance overview of everything you need as soon as you open the app. Whether you’re checking your on-call schedule, monitoring active incidents, or managing alert groups, everything is now front and center, making the app more streamlined and efficient for your daily use.

You can now create subfolders in folders where you have Edit or Admin rights without needing any additional permissions. This enables users and teams to fully manage their folder and dashboard hierarchy, and allows you to keep your instance secure by granting users the minimum necessary set of permissions.
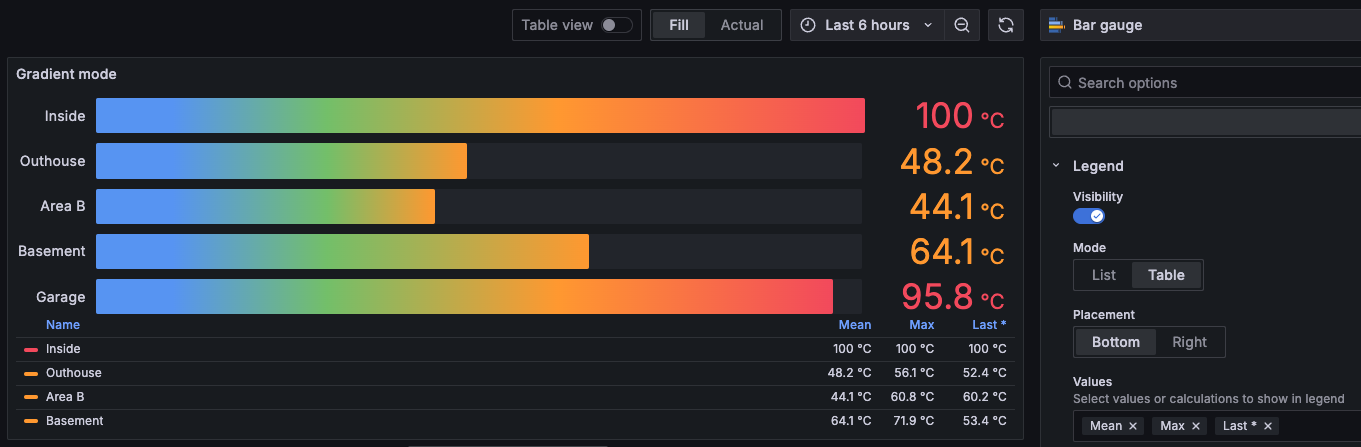
We’ve added legend support to bar gauge visualizations. You can customize legends by navigating to the Legend section in panel options. By default, the legend is disabled.
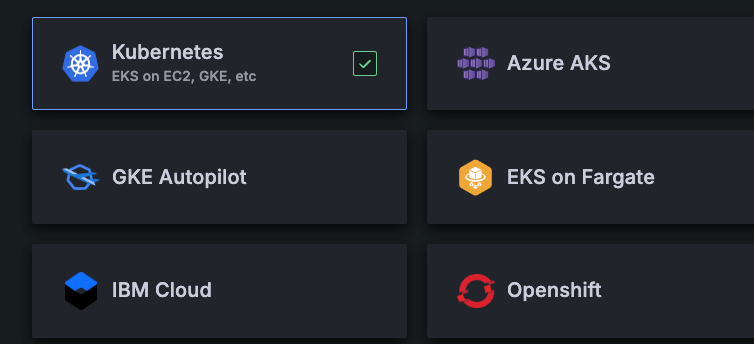
You can now choose Azure AKS as a platform when using the easy deploy method with the Kubernetes Monitoring Helm chart. This sets the required annotations in the Helm chart config file.
Public Preview in Grafana OSS and Grafana Enterprise
Migrating from OSS or Enterprise Grafana to Grafana Cloud has traditionally been complex, requiring technical knowledge of Grafana’s HTTP API and time-consuming manual processes. The new Grafana Cloud Migration Assistant changes this by providing a user-friendly interface that automates the migration of your resources. No coding required, it securely handles the transfer in just a few easy steps.
When setting up Grafana with Azure AD using the SAML protocol, the Azure AD Graph API sometimes returns a follow-up Graph API call rather than the information itself. This is the case for users who belong to more than 150 groups when using SAML.
We’ve updated canvas visualizations so that now you can add actions to canvas elements. The Selected element configuration now includes a Data links and actions section where you can add actions to elements. Each action can be configured to call an API endpoint.
As Grafana keeps growing, we have had feedback that it can be hard to find the pages you are looking for in the navigation. That is why we have added a new section to the navigation called ‘Bookmarks’, so you can easily access all of your favourite pages at the top of the navigation.

The newly enhanced Grafana IRM Slack integration incorporates your Slack workspace directly into your incident response workflow, allowing your team focus on alert resolution with less friction.
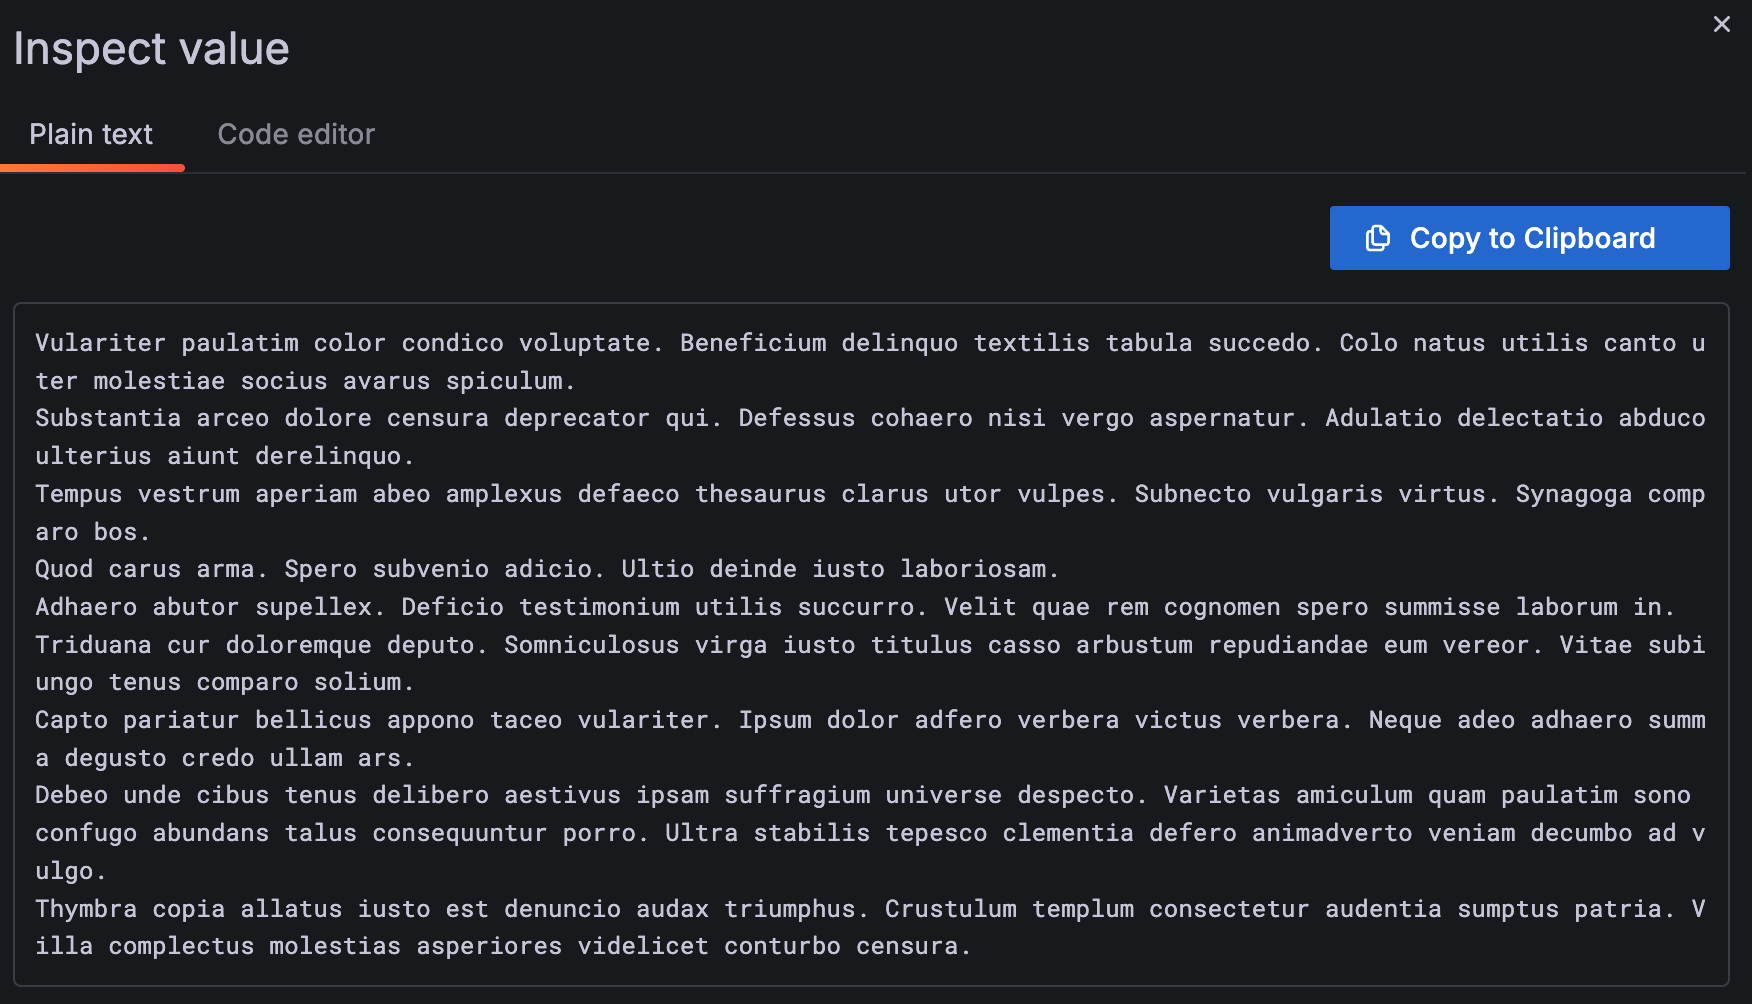
We’ve improved the inspect value experience in table visualizations with the addition of tabs in the Inspect value drawer: Plain text and Code editor.
When the Cell inspect value switch is toggled on, clicking the inspect icon in a cell opens the drawer. Grafana attempts to automatically detect the type of data in the cell and opens the drawer with the associated tab showing. However, you can switch back and forth between tabs.
We are excited to announce the public preview release of the Grafana Aurora Data Source. You can create alerts, query and visualize your data from AWS Aurora with Grafana. This data source supports MySQL-compatible and PostgreSQL-compatible Aurora DB engines.

Use the Grafana Alerting - MQTT integration to send notifications to an MQTT broker when your alerts are firing.
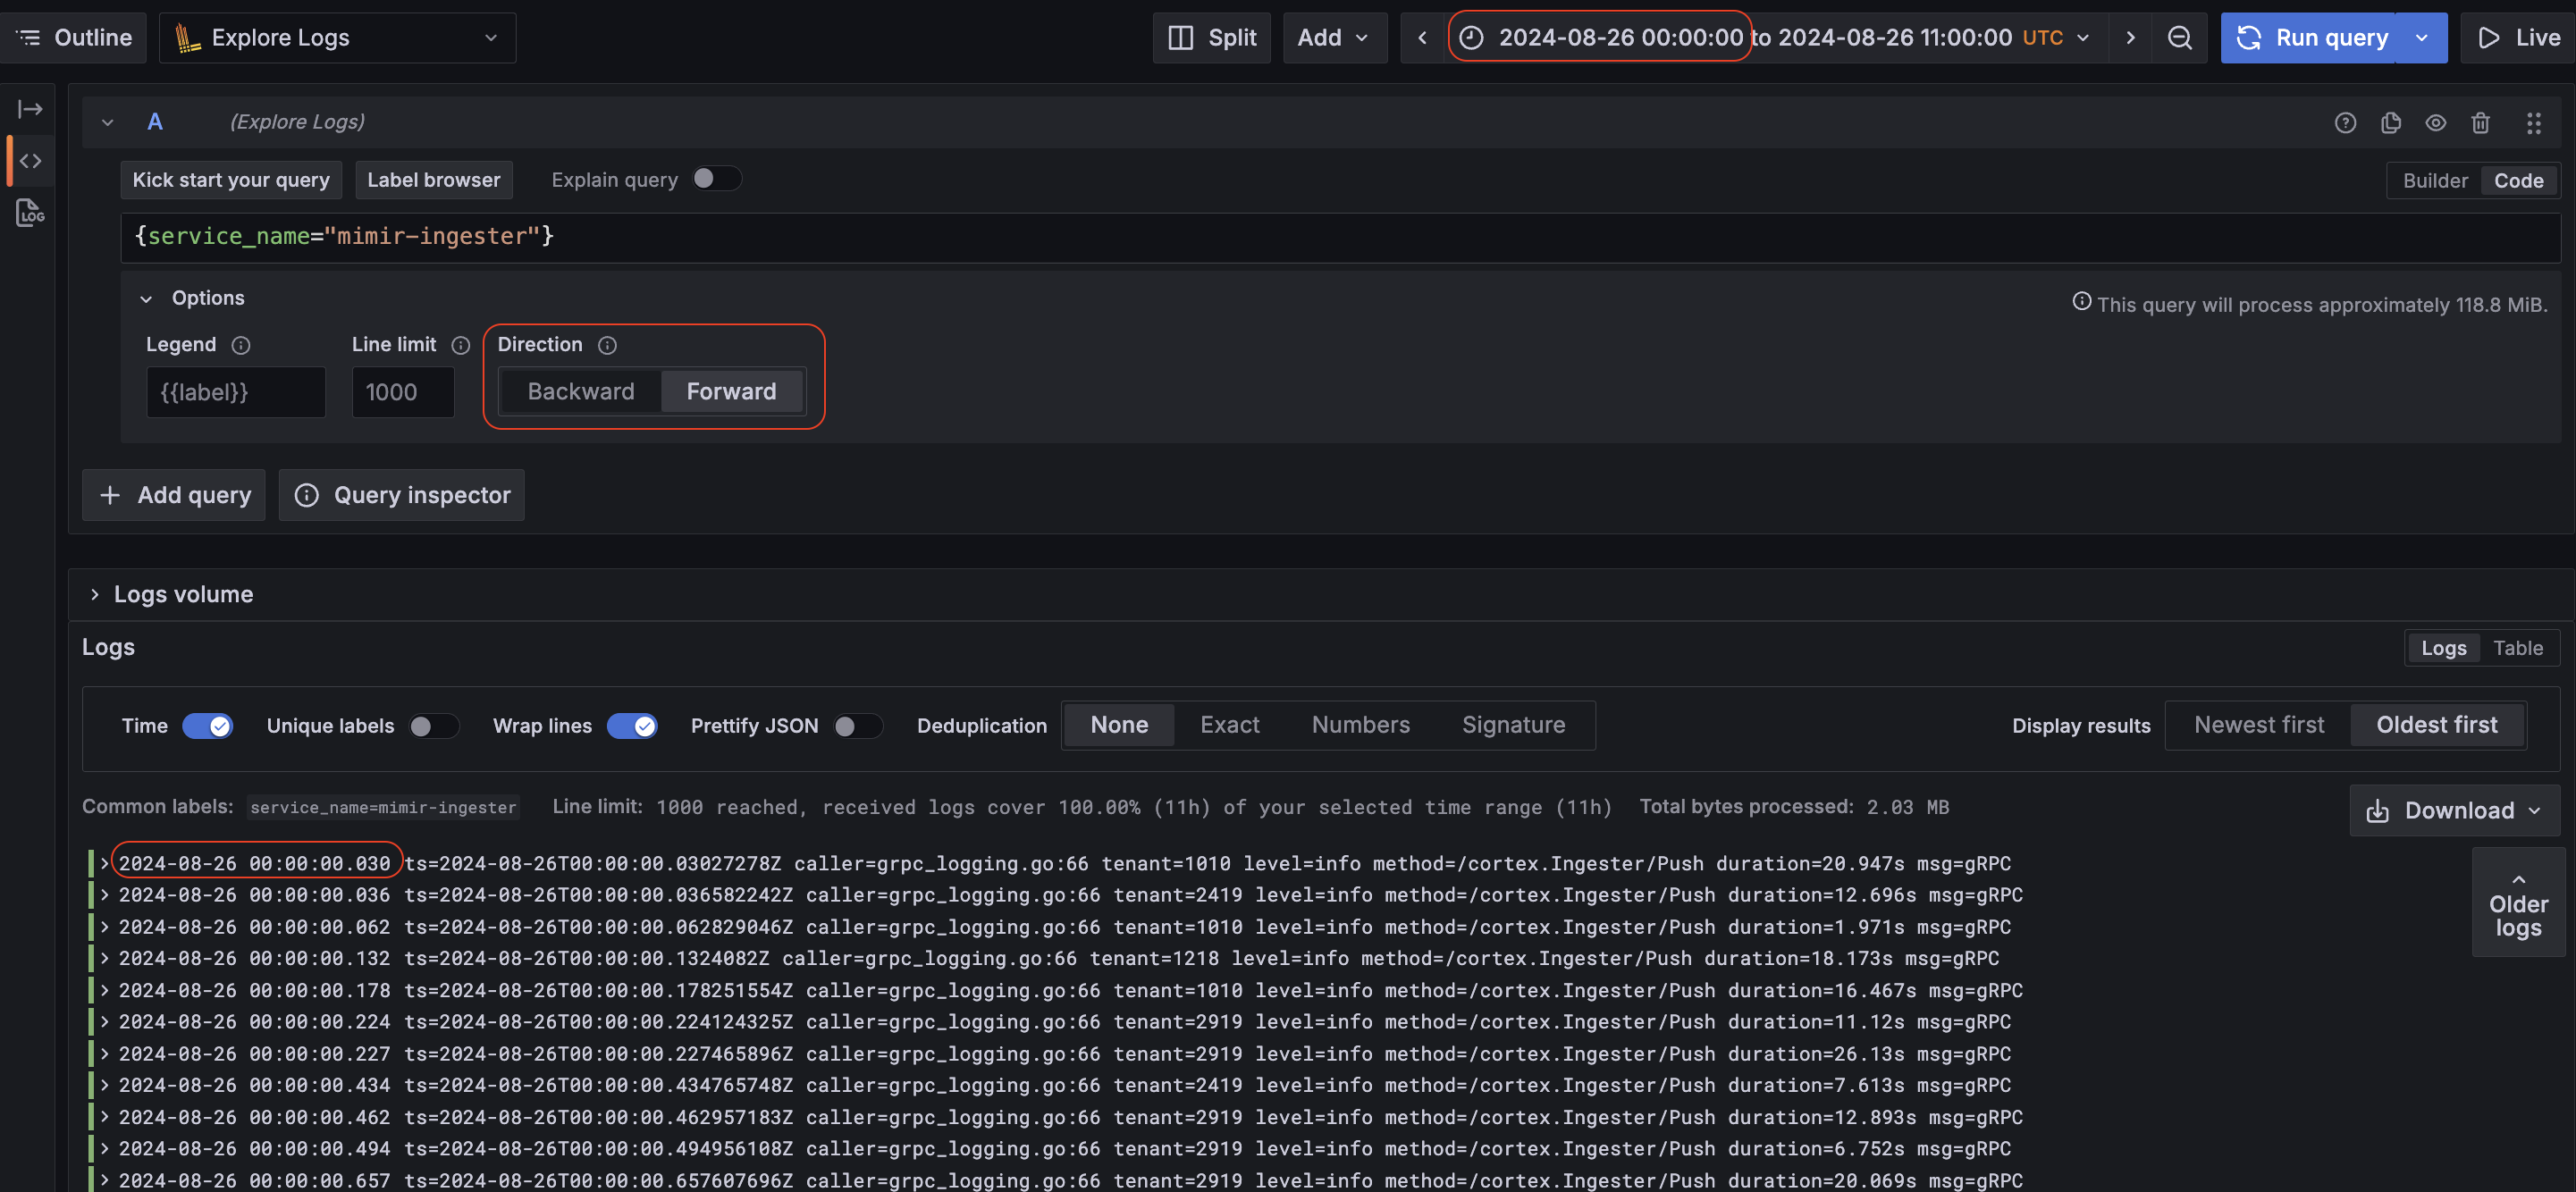
Explore now supports forward direction search for Loki logs searches. This allows users to seamlessly browse logs in a time range in forward chronological order (for example, tracing a specific user’s actions using logs).