
What's new from Grafana Labs
Grafana Labs products, projects, and features can go through multiple release stages before becoming generally available. These stages in the release life cycle can present varying degrees of stability and support. For more information, refer to release life cycle for Grafana Labs.
Loading...
Area of interest:
Cloud availability:
Cloud editions:
Self-managed availability:
Self-managed editions:
No results found. Please adjust your filters or search criteria.
There was an error with your request.
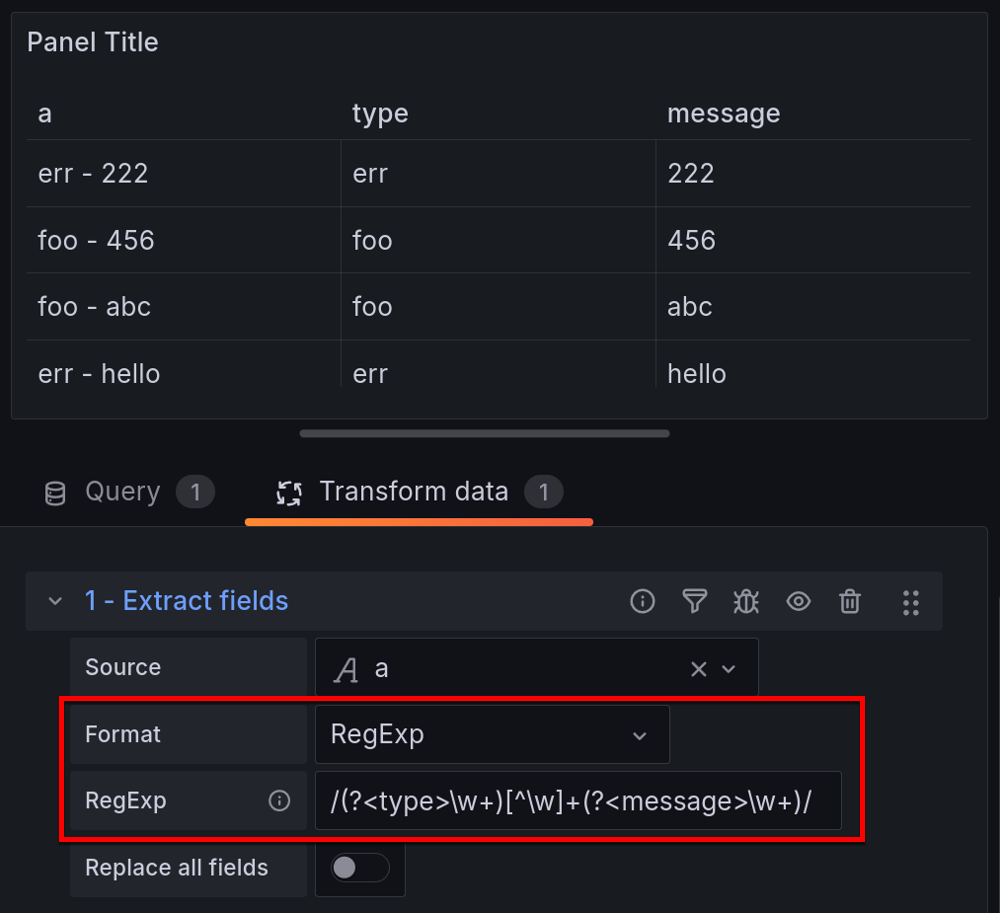
We’ve updated the Extract fields transformation with an additional RegExp format option you can use to perform more advanced parsing of the selected field, such as extracting parts of strings or splitting content into multiple fields using named capturing groups like /(?<NewField>.*)/.
This new feature groups labels and folders in one step so that you can more easily organize your Grafana-managed alert rules.

Private Data Source Connect (PDC) is now supported across more AWS data source plugins - including:
- AWS Athena (Version 2.19.0)
- AWS Aurora (Version 0.4.0)
- OpenSearch (Version 2.21.0)
- AWS Redshift (Version 1.20.0)
- AWS X-Ray (Version 2.13.0)
With PDC, you can establish a private, secured connection between a Grafana Cloud instance, or stack, and data sources secured within a private network. Take advantage of the convenience and power of Grafana Cloud - even if your cluster is hosted in a Virtual Private Cloud (VPC) or another private network.
Find the full list of supported data source plugins here.
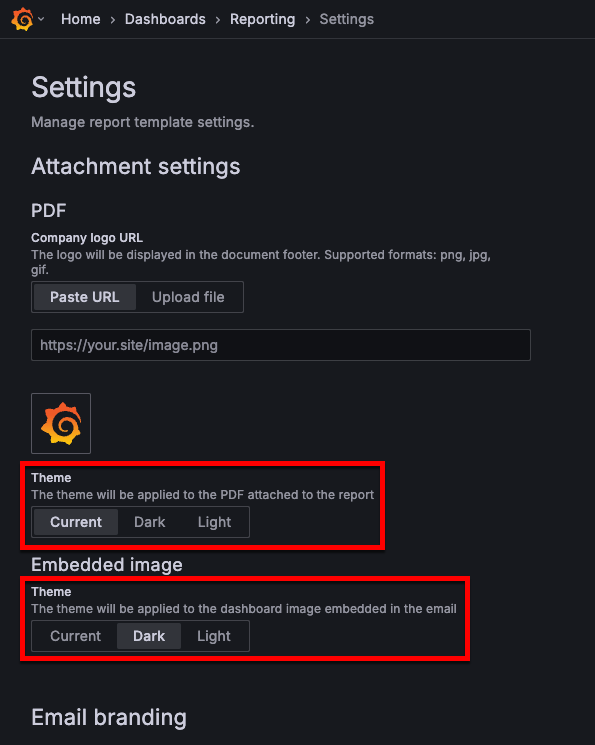
Choose the light or dark theme for PDF attachments and embedded dashboard images in Reports. The selected theme options are applied to PDFs and embedded images for all reports within your organization.
Many teams struggle with selecting a realistic SLO target when creating or modifying SLOs. The target sets the sensitivity for when an SLO will start to burn budget, impacting alerting noise and “error budget remaining”. If you assume you want to create an SLO to ensure “99.5% of HTTP requests return successfully in under 500 ms”, how do you know that 99.5% is a realistic target for your service? People often guess or take a number from management.
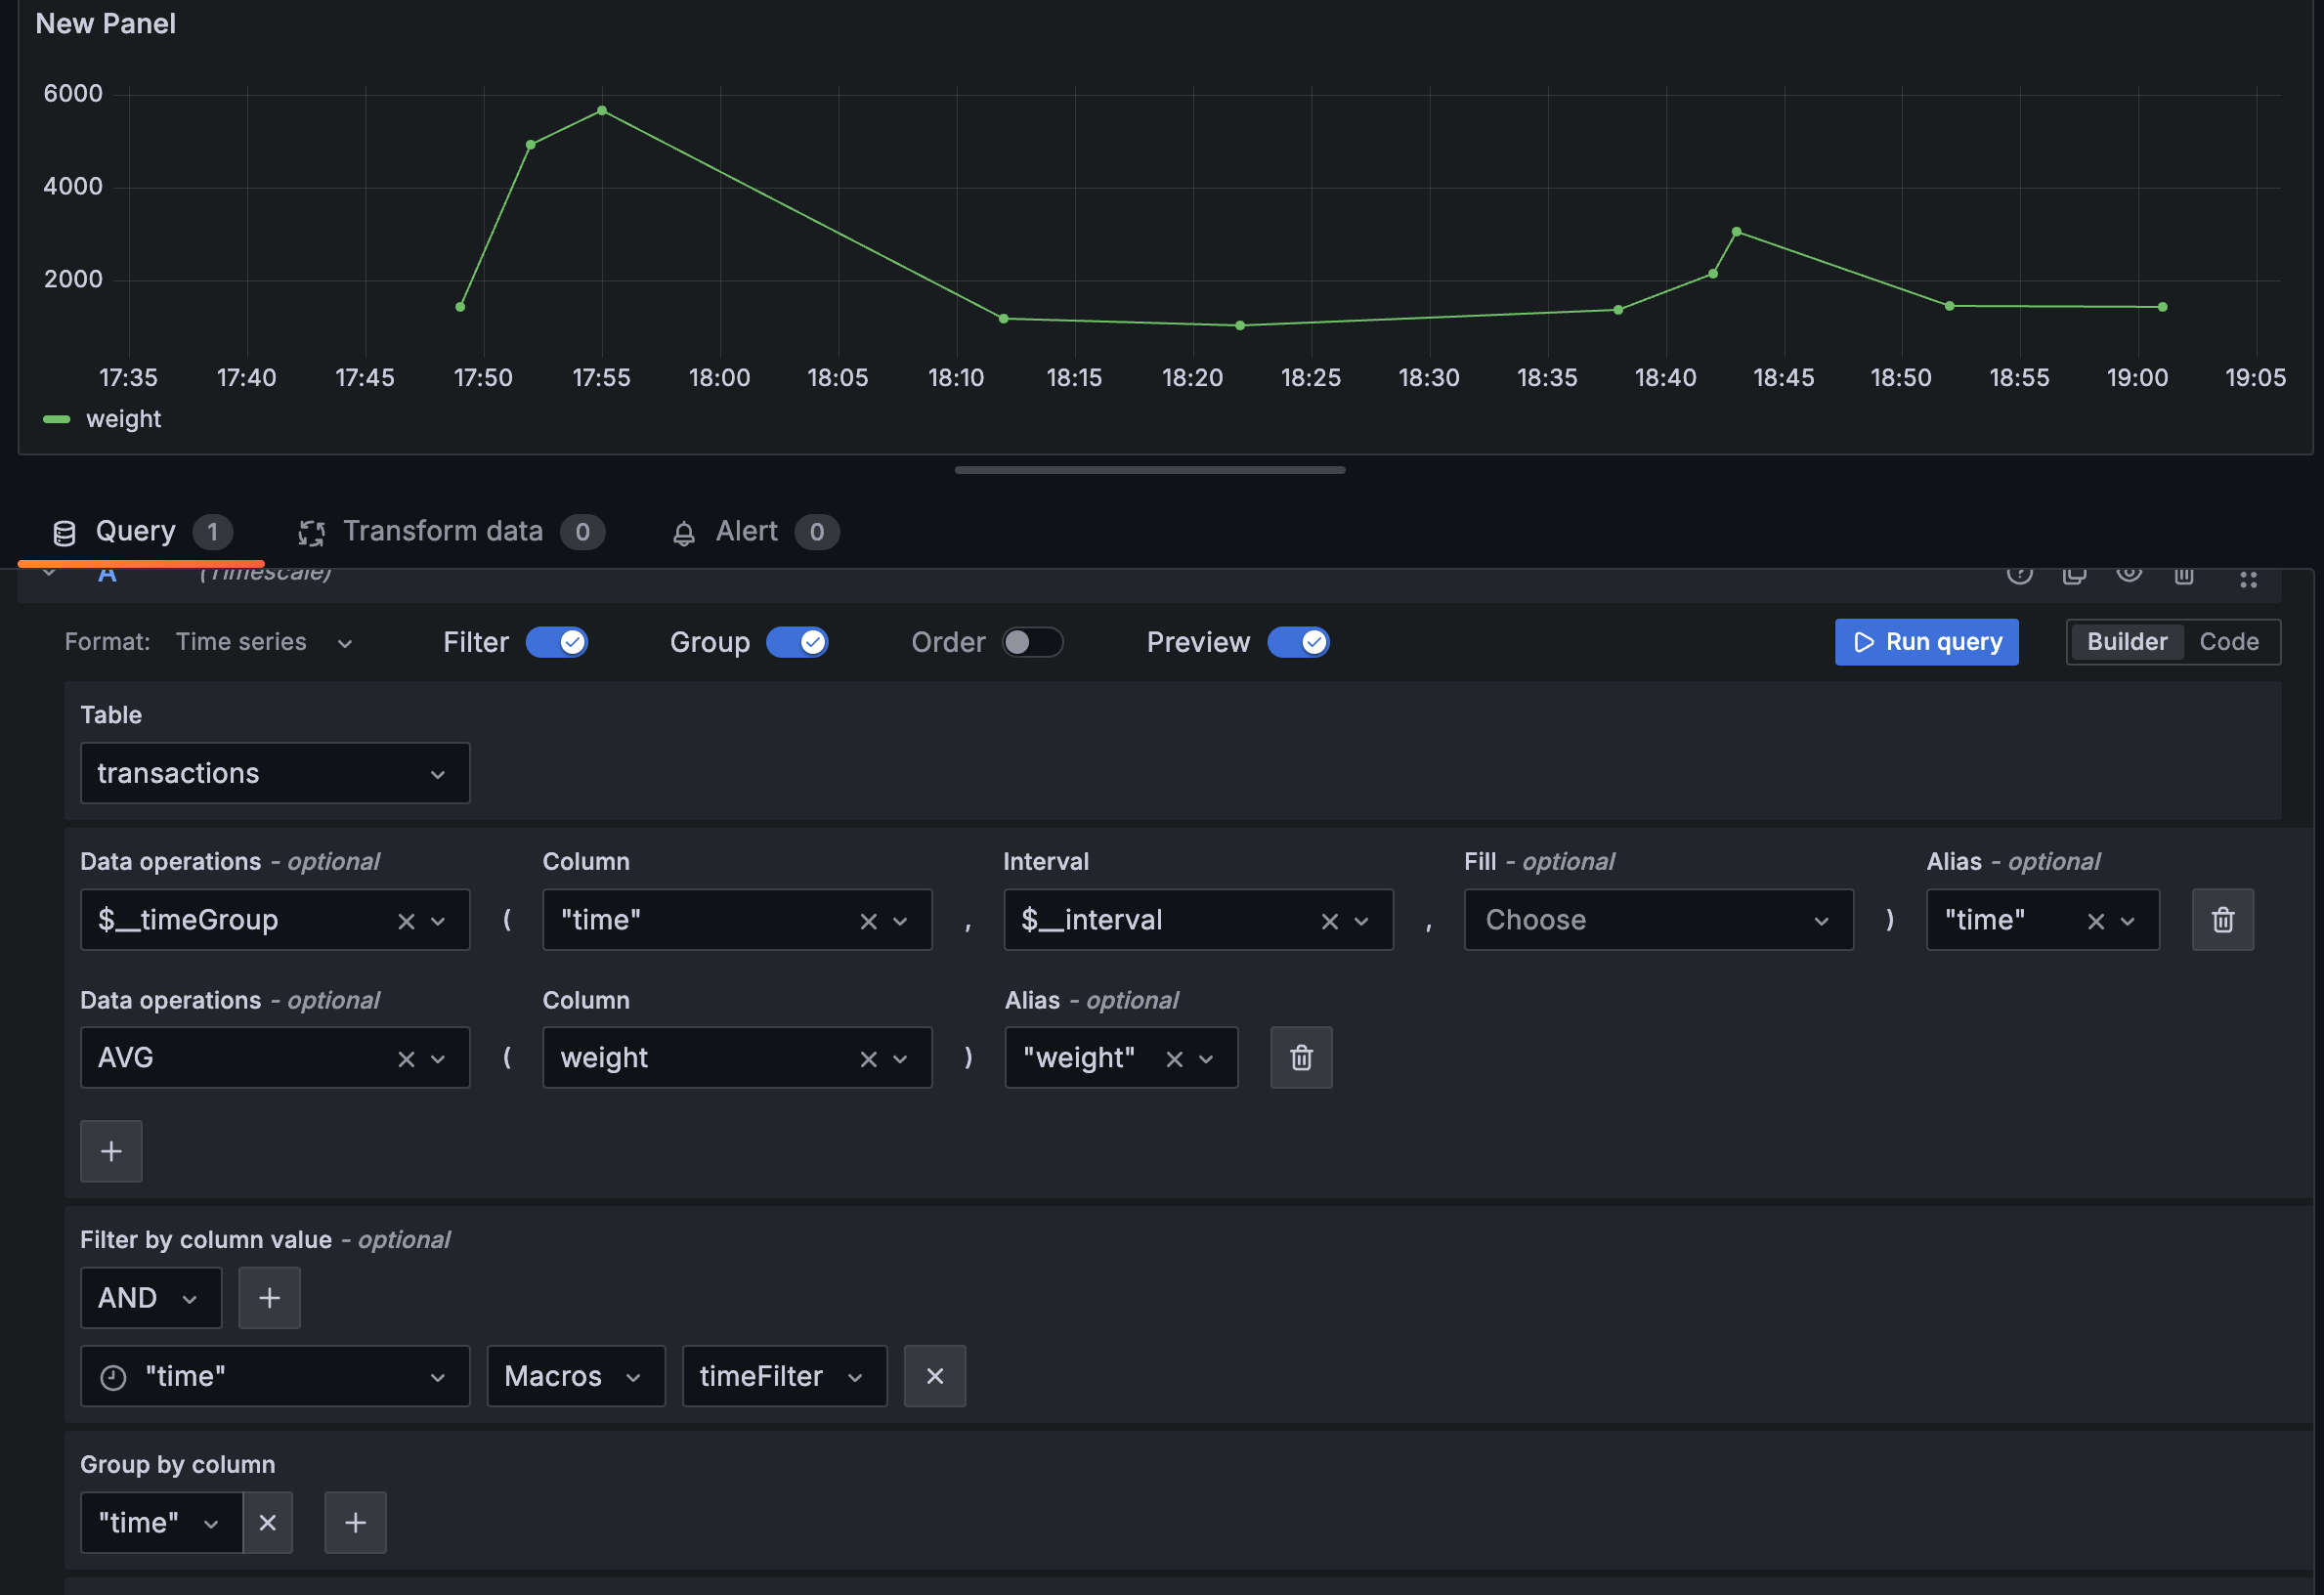
It is now possible to create time series queries from the query builder in the following data sources. MySQL, PostgreSQL, MS SQL. Use the Data operations drop-down to select a macro like $__timeGroup or $__timeGroupAlias.


We’ve introduced a new section under Settings > Push Notifications to ensure reliable delivery of notifications by actively prompting users to disable battery optimization and inactivity restrictions on Android devices.
Starting in early 2025 we will roll out eight new public probe locations running in AWS: Stockholm, Zurich, Spain, UAE, Montreal, Calgary, Hyderabad, and Indonesia.
We’ve redesigned dashboard filters for an improved filter creation experience!
The redesigned filters are more prominent in the dashboard and filters based on the same ad hoc filter variable are more clearly related. In the new design, you can click anywhere in the filter field to begin creating a one and Grafana automatically detects which part of the filter you’re setting up. It takes fewer clicks to create a filter and the creation process using keyboard strokes is smoother than previously.

We’re excited to announce the release of Grafana IRM Mobile, the next evolution of our mobile app which was previously known as Grafana OnCall. This rebrand marks a major step forward in providing teams with a seamless, comprehensive way to manage incidents—all from your mobile device.
Correlations is a feature that allows Grafana users to set up links between their data sources. Previously, the link generated would only be from one query to another—meaning results from a query could only generate links to open a second Explore pane with other query results.
We’re excited to announce that plugins can now leverage Grafana’s role based access control to define their own roles and permissions in order to control access to their routes.
A new escalation step is now available in Grafana OnCall. You can configure your escalation chains to automatically create an incident in Grafana Incident with a specified severity.
Explore Logs is a plugin that lets you automatically visualize and explore your logs without having to write queries. It makes finding spikes in your log volume, filtering your logs and pinpointing problematic log lines a lot easier and more smooth.
Introducing the Series limit in the Metrics browser.
On occasion, a Prometheus instance may contain a metric that has many, many series. When this happens the metrics browser can become slow or break when searching labels on a metric.
