
What's new from Grafana Labs
Grafana Labs products, projects, and features can go through multiple release stages before becoming generally available. These stages in the release life cycle can present varying degrees of stability and support. For more information, refer to release life cycle for Grafana Labs.
Loading...
Area of interest:
Cloud availability:
Cloud editions:
Self-managed availability:
Self-managed editions:
No results found. Please adjust your filters or search criteria.
There was an error with your request.
Create recording rules for Grafana-managed alert rules to calculate frequently needed expressions or computationally expensive expressions in advance and save the result as a new set of time series. Querying this new time series is faster, especially for dashboards since they query the same expression every time the dashboards refresh. Previously, this was only available for data-source managed alert rules.
You can now authenticate the GitHub data source using a GitHub App, providing an alternative to personal access tokens (PATs). GitHub App authentication offers enhanced security by granting more granular permissions, reducing the risk of over-permissioning.
We’ve updated several visualizations so that now you can add actions to them. The panel configuration now includes a Data links and actions section where you can add actions that can each be configured to call an API endpoint.
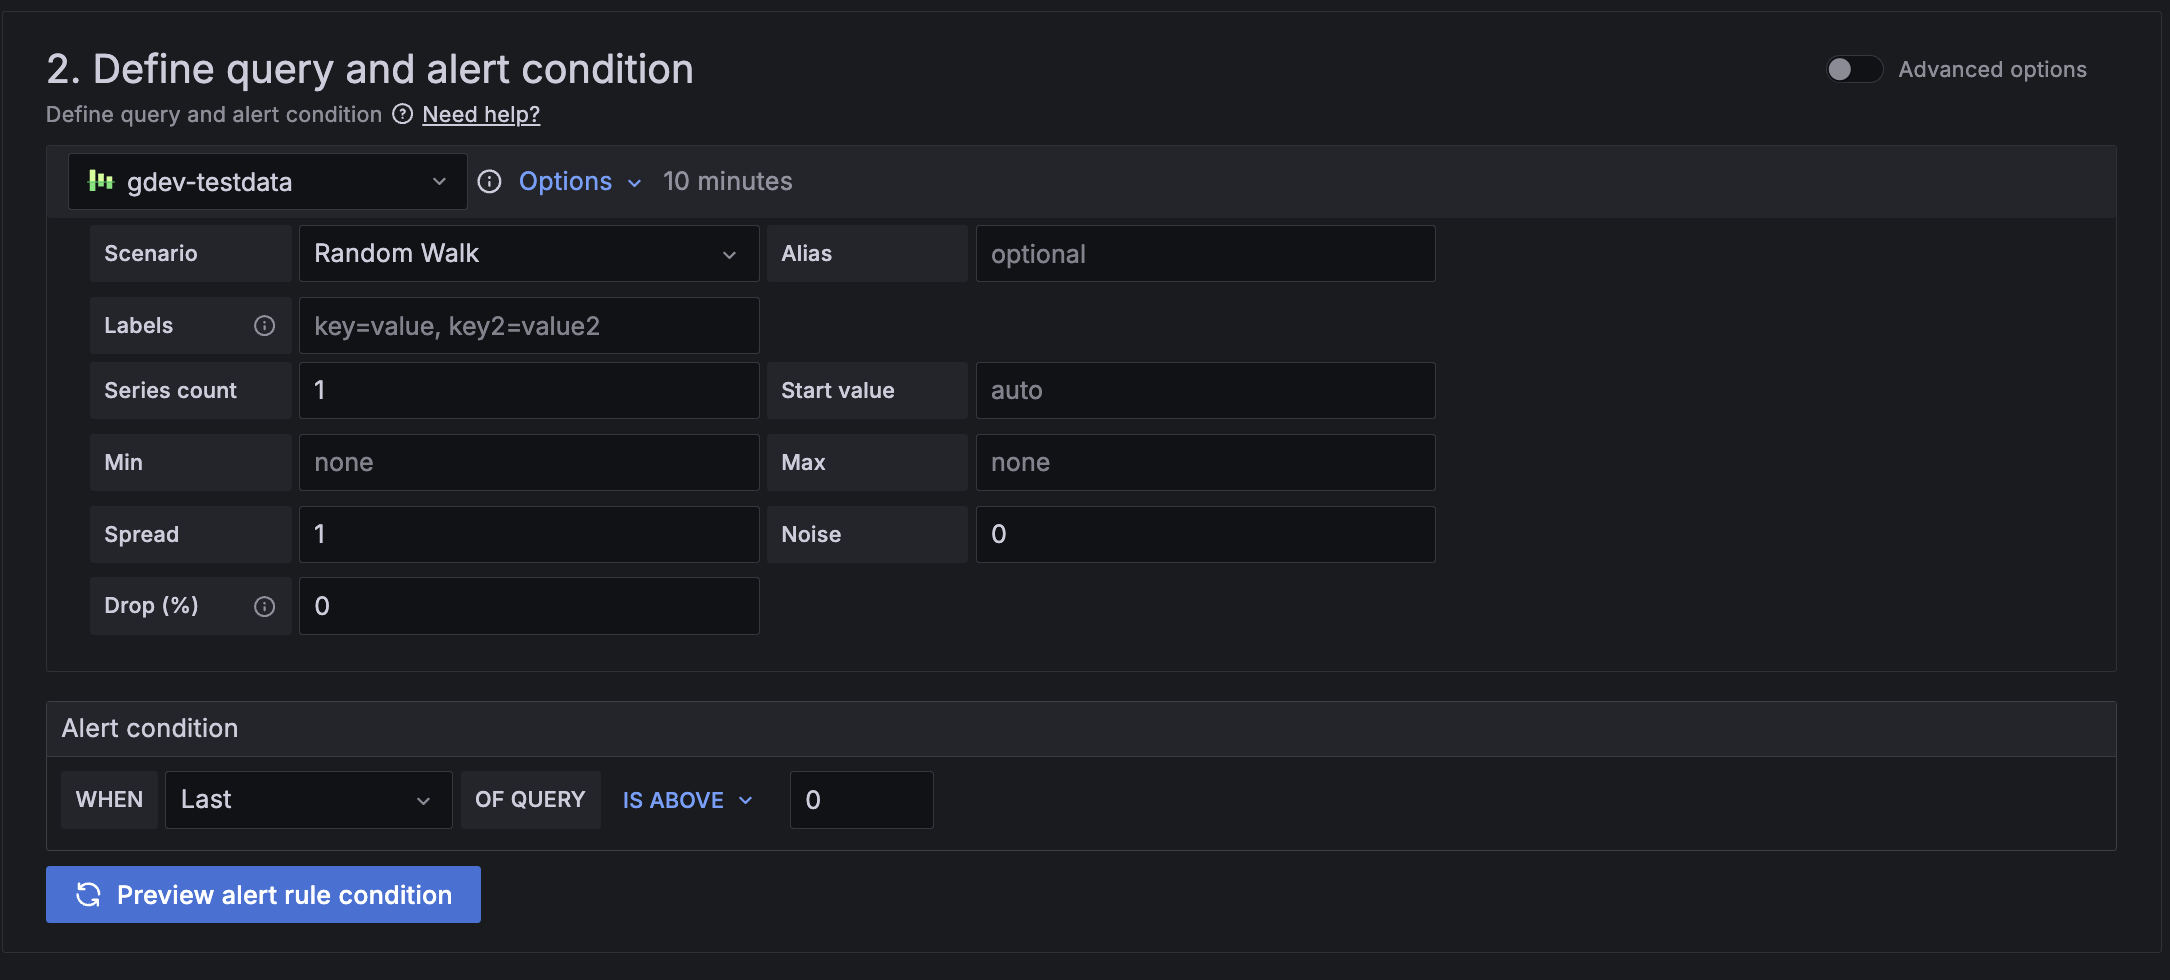
Introduces a simplified version of the query and alert conditions step for creating Grafana-managed alert rules. The default options streamline rule creation with a cleaner header and a single query and condition. For more complex rules, switch to advanced options to add multiple queries and expressions.
We’re excited to announce that k6 browser checks in Synthetic Monitoring are now in private preview.
With k6 browser checks, you can control a headless Chrome browser using a k6 script. Powered by the k6 browser module, browser checks collect frontend Web Vitals metrics, capture custom performance metrics, and simulate user actions like clicking buttons or filling forms. Any scripts you create are also portable between Synthetic Monitoring and Grafana Cloud k6, as they are backed by the same engine, allowing you to reuse your monitoring scripts for performance testing and vice versa.

Introducing a redesigned sharing experience in Dashboards! The redesigned sharing model is leaner, easier to navigate, and more focused on what you want to do.

We’ve renamed the Public dashboards feature, Shared dashboards. This renaming is part of our overall redesign of dashboard sharing and aims to better align externally shared dashboards with other dashboard sharing options.
The OpenID Connect Discovery URL is available in the Generic OAuth form. The info extracted from this URL will be used to populate the Auth URL, Token URL and API URL fields.
You can generate a new certificate and private key for SAML directly from the UI form. Click on the Generate key and certificate button from the Sign requests tab in the SAML form and then fill in the information you want to be embedded in your generated certificate.
Explore Logs offers a queryless experience for easily surfacing insights from logs stored in Grafana Loki, Grafana Cloud Logs, and Grafana Enterprise Logs.
You can spot troublesome services without running a single query, and quickly add filters with point-and-click interactions. Explore Logs generates visualizations of log volumes to let you easily detect anomalies or related changes across labels and over time. Patterns help you identify sources of signal or filter our sources of noise in your log line content, further accelerating your troubleshooting process.
Explore Metrics, generally available in Grafana OSS, Grafana Enterprise, and Grafana Cloud, offers a queryless experience to visualize time series data stored in Prometheus or any Prometheus-compatible time-series database.
Explore Profiles offers a queryless experience for easily surfacing insights from profiles stored in Grafana Pyroscope and Grafana Cloud Profiles.
Profiling data helps developers identify which parts of a program consume the most resources, such as CPU time, memory, or I/O operations. Profiling, as a signal, lets you either proactively or reactively address performance issues in multiple areas areas.
Explore Traces offers a queryless experience for easily surfacing insights from traces stored in Grafana Tempo, Grafana Cloud Traces, and Grafana Enterprise Traces.
Explore Traces helps you make sense of your tracing data so you can automatically visualize insights from your Tempo traces data. The app helps you understand errors and latency issues within complex distributed systems.
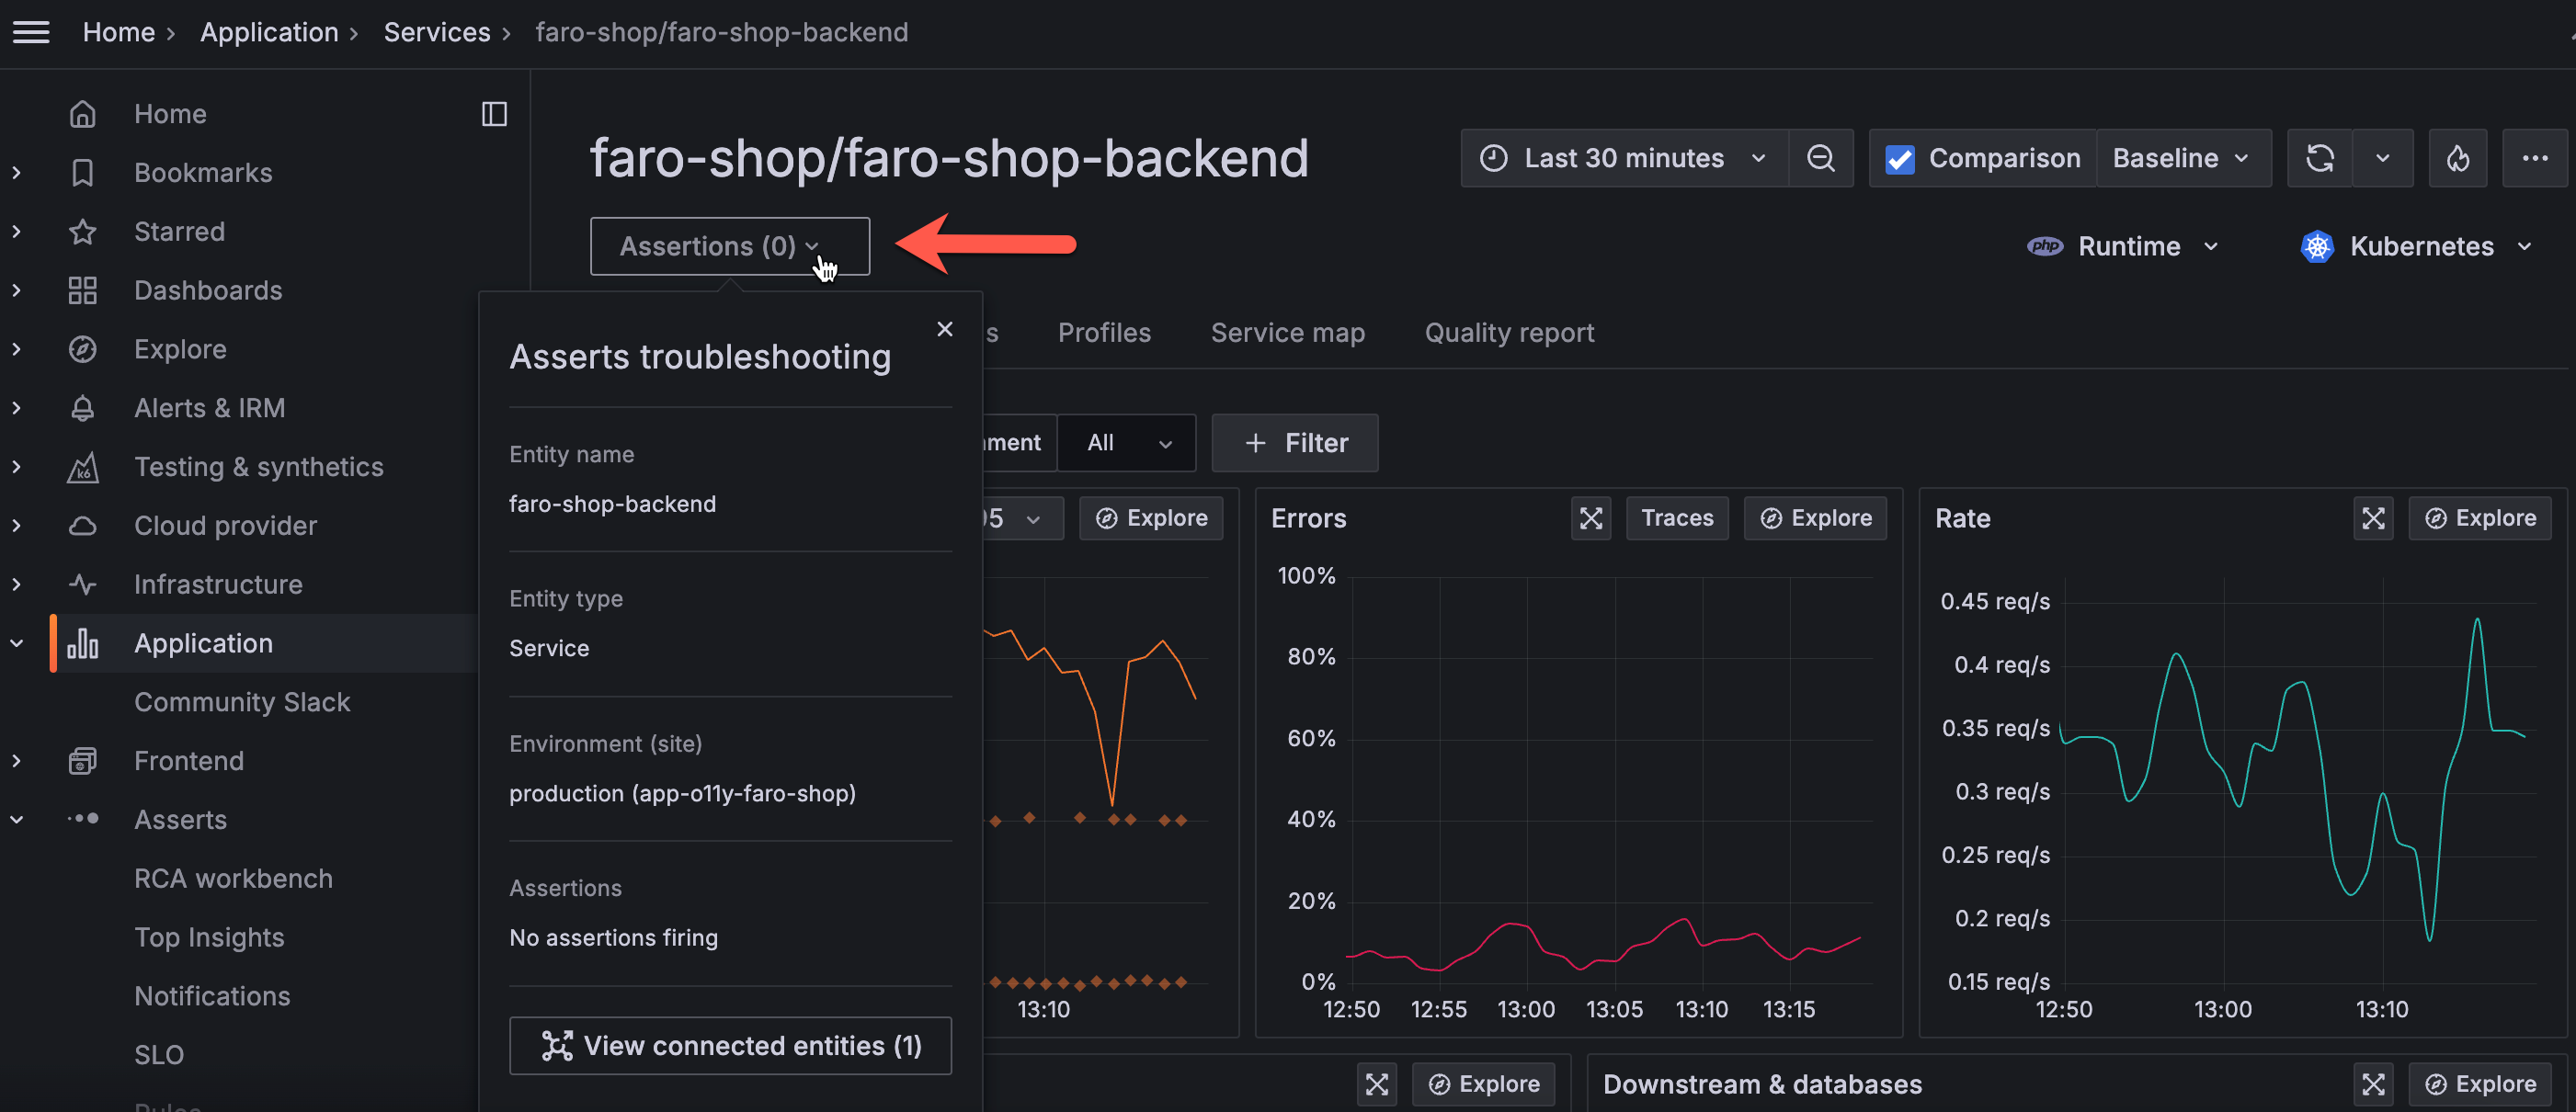
Contextual root cause analysis workflows
Asserts now supports root cause analysis bi-directional navigation between Asserts and Grafana Application Observability and Kubernetes Monitoring. When you are in Application Observability or Kubernetes Monitoring, you can seamlessly explore Assertions in Asserts without losing context. When in Asserts, you can easily navigate to Application Observability or Kubernetes Monitoring.
To help make it easier for administrators to assess and interact with Grafana plugins, we are reworking the plugin details page to highlight important metadata, such as when the plugin was last updated.
