
What's new from Grafana Labs
Grafana Labs products, projects, and features can go through multiple release stages before becoming generally available. These stages in the release life cycle can present varying degrees of stability and support. For more information, refer to release life cycle for Grafana Labs.
Loading...
Area of interest:
Cloud availability:
Cloud editions:
Self-managed availability:
Self-managed editions:
No results found. Please adjust your filters or search criteria.
There was an error with your request.
TraceQL queries now use regular expressions that are anchored at both ends. This change makes the queries faster and matches the behavior of PromQL, where regular expressions are also fully anchored.
The Grafana Datadog plugin now includes two new features:
- Percentile Aggregation Function for distribution-type metrics.
- New Query Variable Syntax – now supports all tags associated with a metric.
For more details, check out the video and Grafana Datadog data source documentation.
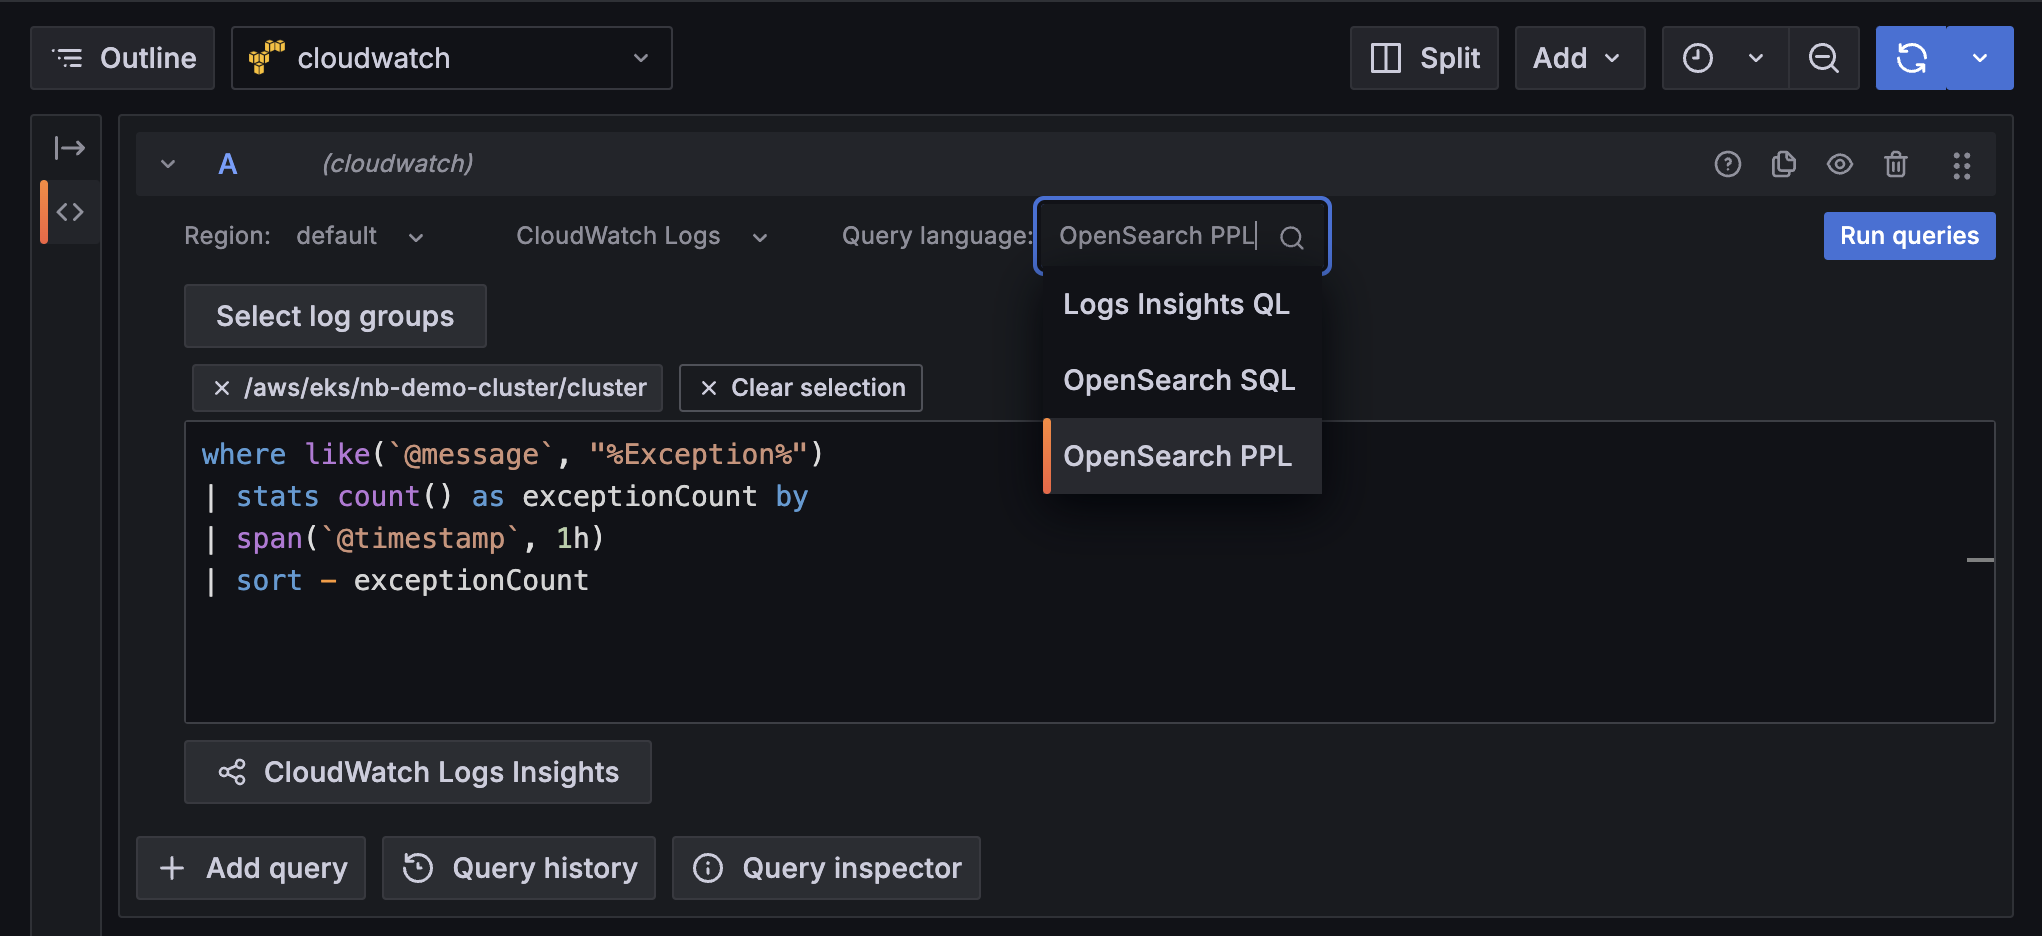
The AWS CloudWatch data source plugin now offers two new query languages for searching through logs: OpenSearch PPL and OpenSearch SQL. You now have increased flexibility to choose a more familiar query language and to take advantage of their unique features (like the SQL JOIN command) when querying AWS CloudWatch Logs Insights. In addition to the already supported Logs Insights QL option, you can find the added query language options in the new Query language drop-down list.
In May 2024, we announced a new way of generating PDFs that introduced a major performance improvement for the PDF export feature. It also fixed all caveats related to rendering a report with panels or rows set to repeat by a variable, like rendering repeating panels inside collapsed rows.
Many teams struggle with picking SLO targets, particularly for new SLOs. The target percentage drives the sensitivity of the burn rate calculations, the error budget remaining, and it can tune alert volume. If you assume you want to create an SLO to ensure “99.5% of HTTP requests return successfully in under 500 ms”, how do you know that 99.5% is a realistic target for your service? People often guess or take a number from management.
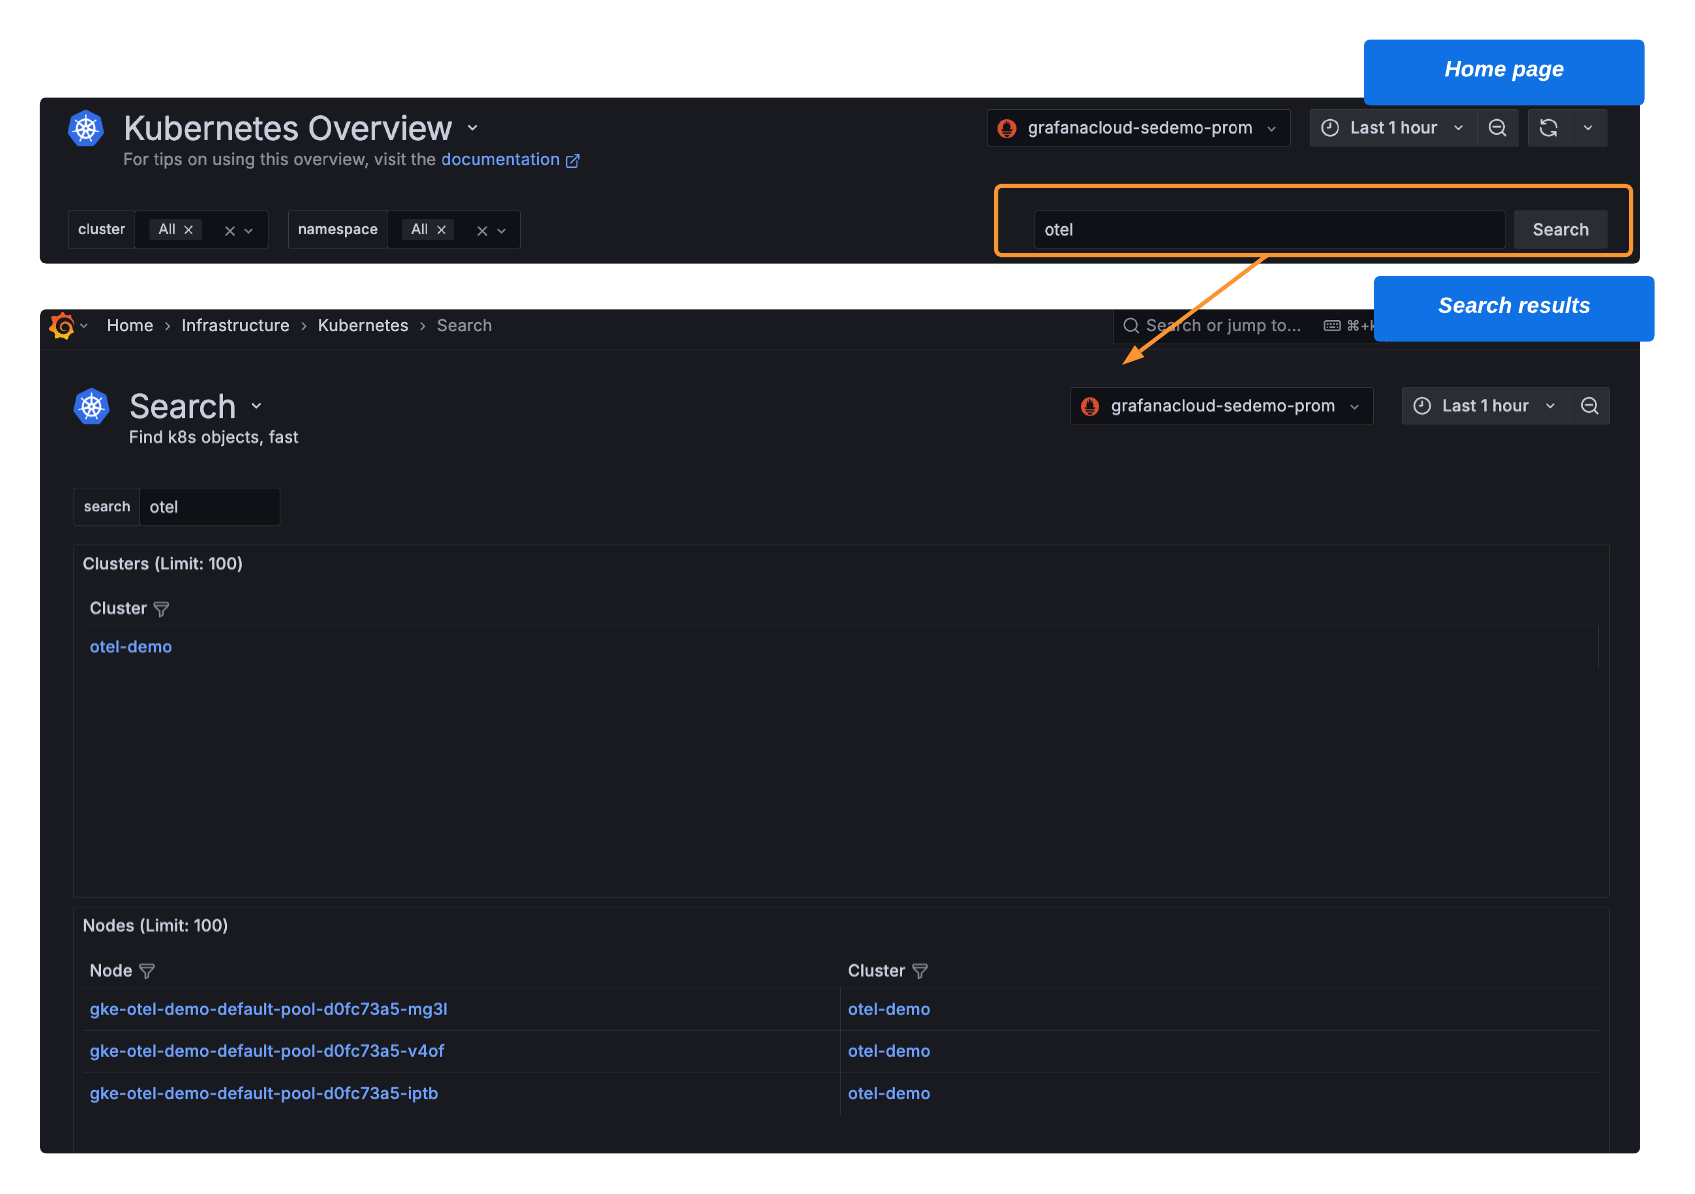
Use Search to find any Kubernetes object in your fleet.
Create a new alert rule definition as part of a provisioned rule group and export it into Terraform (HCL) format. Copy and paste the code into your Terraform pipeline to create your new alert rule. Previously, you had to add the rule definition to the code manually. Now, you can get that code from the UI, enabling you to quickly deploy and manage alert rules as part of your infrastructure as code.

With the AWS CloudWatch integration, you can scrape your CloudWatch metrics and logs and forward them to Grafana Cloud for a centralized place to monitor and alert on your infrastructure and large scale applications. However, handling AWS scrape jobs at scale can be tedious. Now, manage them as code with Terraform in Grafana Cloud! Scale smarter—quickly create, update, or delete scrape jobs with ease and precision.
Have you ever had a Grafana Cloud Logs query time out because it tried to process too much data? Query acceleration leverages bloom filters to quickly filter on structured metadata, showing you results faster and making timeouts less likely.
Introducing Fleet Management in Grafana Cloud
Managing observability workloads can quickly overwhelm even the most experienced admin. Whether you’re dealing with complex configurations, rising costs, or just trying to keep tabs on every collector, you need everything in one place to make sense of it all. That’s why we’re excited to announce the Public Preview of Fleet Management in Grafana Cloud—a powerful new way to monitor and manage observability collectors efficiently, regardless of scale. With Fleet Management, you can roll out configurations remotely, monitor collector health across all deployments, and control cost simply by activating or deactivating pipelines as needed. Get started today!
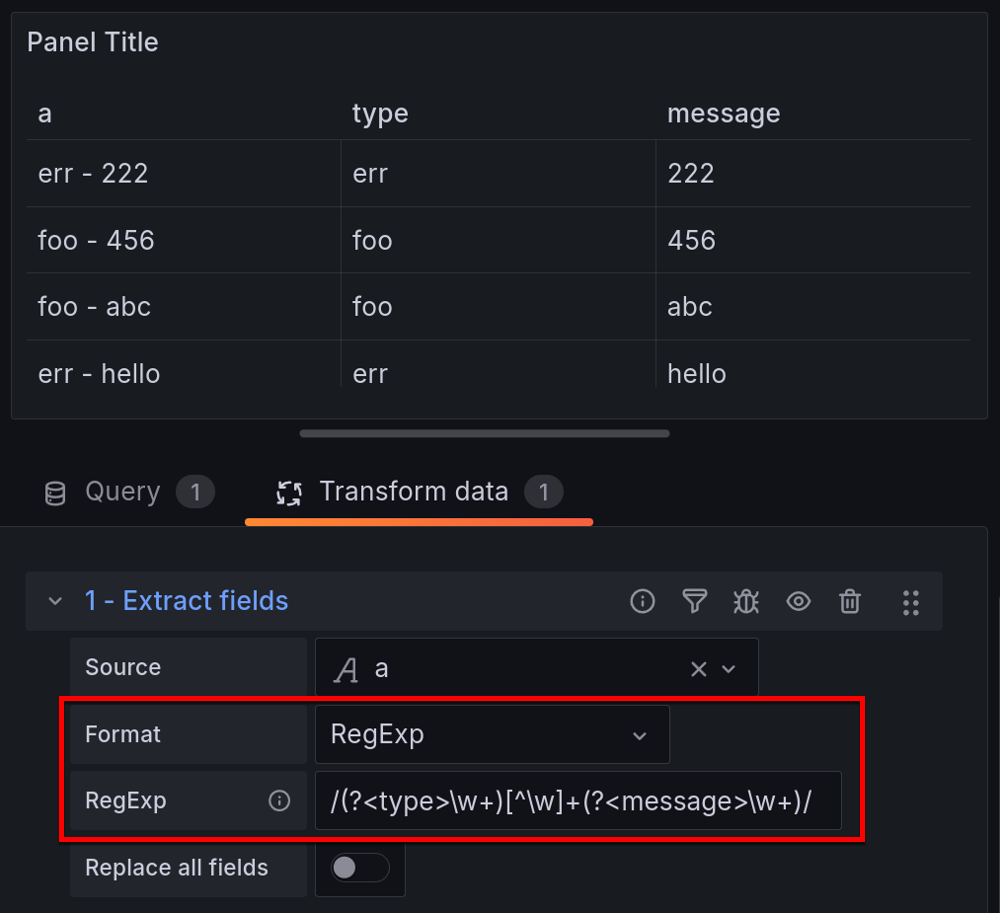
We’ve updated the Extract fields transformation with an additional RegExp format option you can use to perform more advanced parsing of the selected field, such as extracting parts of strings or splitting content into multiple fields using named capturing groups like /(?<NewField>.*)/.
This new feature groups labels and folders in one step so that you can more easily organize your Grafana-managed alert rules.

Private Data Source Connect (PDC) is now supported across more AWS data source plugins - including:
- AWS Athena (Version 2.19.0)
- AWS Aurora (Version 0.4.0)
- OpenSearch (Version 2.21.0)
- AWS Redshift (Version 1.20.0)
- AWS X-Ray (Version 2.13.0)
With PDC, you can establish a private, secured connection between a Grafana Cloud instance, or stack, and data sources secured within a private network. Take advantage of the convenience and power of Grafana Cloud - even if your cluster is hosted in a Virtual Private Cloud (VPC) or another private network.
Find the full list of supported data source plugins here.
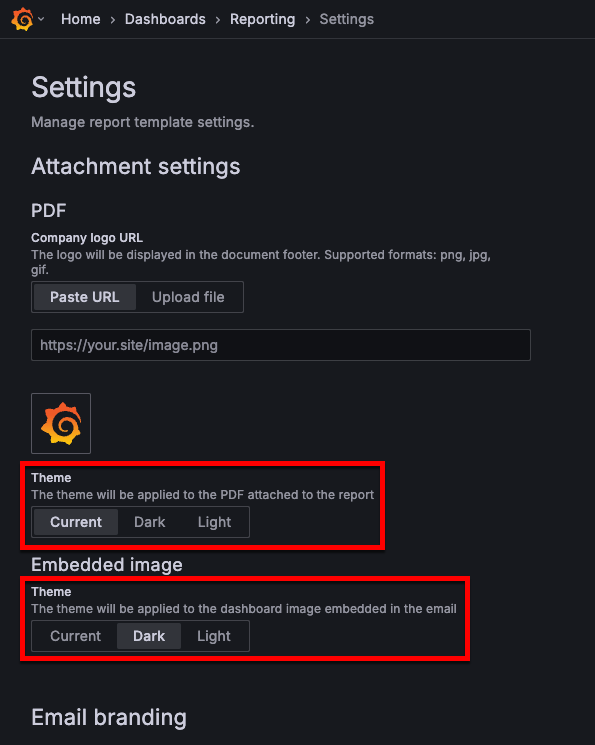
Choose the light or dark theme for PDF attachments and embedded dashboard images in Reports. The selected theme options are applied to PDFs and embedded images for all reports within your organization.
Many teams struggle with selecting a realistic SLO target when creating or modifying SLOs. The target sets the sensitivity for when an SLO will start to burn budget, impacting alerting noise and “error budget remaining”. If you assume you want to create an SLO to ensure “99.5% of HTTP requests return successfully in under 500 ms”, how do you know that 99.5% is a realistic target for your service? People often guess or take a number from management.