
What's new from Grafana Labs
Grafana Labs products, projects, and features can go through multiple release stages before becoming generally available. These stages in the release life cycle can present varying degrees of stability and support. For more information, refer to release life cycle for Grafana Labs.
Loading...
Area of interest:
Cloud availability:
Cloud editions:
Self-managed availability:
Self-managed editions:
No results found. Please adjust your filters or search criteria.
There was an error with your request.
The Machine Learning team is delighted to announce a new dynamic UI for Metric Forecasts!
Will the prediction algorithm see the patterns you expect in your data? If you tweak some of the parameters, will you get a better result?
Are you tracking incidents with a few simple tags but still struggling to see the bigger picture? We’ve heard your feedback and have overhauled how you can organize and correlate incidents across your observability workflows.

Grafana Cloud Traces introduces a new safeguard to help maintain stability and prevent out-of-memory crashes when fetching traces that contain large span attributes. With this change, attributes exceeding 2KB (2048 bytes) are automatically truncated before they’re stored, striking a balance between preserving valuable trace data and maintaining overall system stability.
You can now apply Adaptive Logs recommendations per-service.
This feature is useful if multiple services are producing logs with identical patterns, and you want to treat logs from those services differently. It also makes bulk applying recommendations per service, or team, easier and more useful.
The Plugin Frontend Sandbox is a security feature that isolates plugin frontend code from the main Grafana application. When enabled, plugins run in a separate JavaScript context, which provides several security benefits:
We’ve improved how Grafana manages external sessions for OAuth and SAML, enhancing compatibility with identity providers that support session management.
Grafana can now reliably manage SAML external sessions (Identity Provider sessions) by using the SessionIndex attribute in the SAML assertion and the NameID attribute in the logout request. Previously, Grafana relied on the Login attribute as the NameID and did not include the SessionIndex in the logout request, which could result in users being logged out of all their applications/IdP sessions when logging out of Grafana.
Between January 13 - 24, we’re launching eight (8) new public probes in AWS: Calgary, Hyderabad, Indonesia, Montreal, Spain, UAE, Stockholm, and Zurich.
The new probes will replace eight (8) deprecated probes running in Linode and Digital Ocean: Atlanta, Amsterdam, Bangalore, Dallas, Newark, New York, Toronto, and San Francisco.
Migrate your Grafana OSS/Enterprise instance to Grafana Cloud in just a few clicks.
The Grafana Cloud Migration Assistant launched in Grafana 11.2 with initial support for dashboards, data sources, and folders. We’re excited to announce support for plugins and Grafana alerts.
The Elasticsearch data source plugin now offers support for Elasticsearch’s Cross-cluster Search feature.
If you’re a big Elasticsearch user, you might have multiple clusters set up for geographical separation, different teams or departments, compliance, or scaling reasons. Previously, you needed to set up a separate data source in Grafana for each cluster. Now with cross-cluster search, you can query data across all these clusters from a single Grafana data source. This makes it simpler and more convenient to query all of your Elasticsearch logs. You can learn more about this feature in the Elasticsearch docs.
We’re excited to introduce service account token authentication for the OnCall API. With this change, you can now generate tokens to interact with the API so that they:
The Grafana Cloud platform and Grafana Cloud k6 application include a broad range of features that can help you maximize the value you get for your testing strategy. But, with several features to learn, sometimes it can take time to figure out where to start.

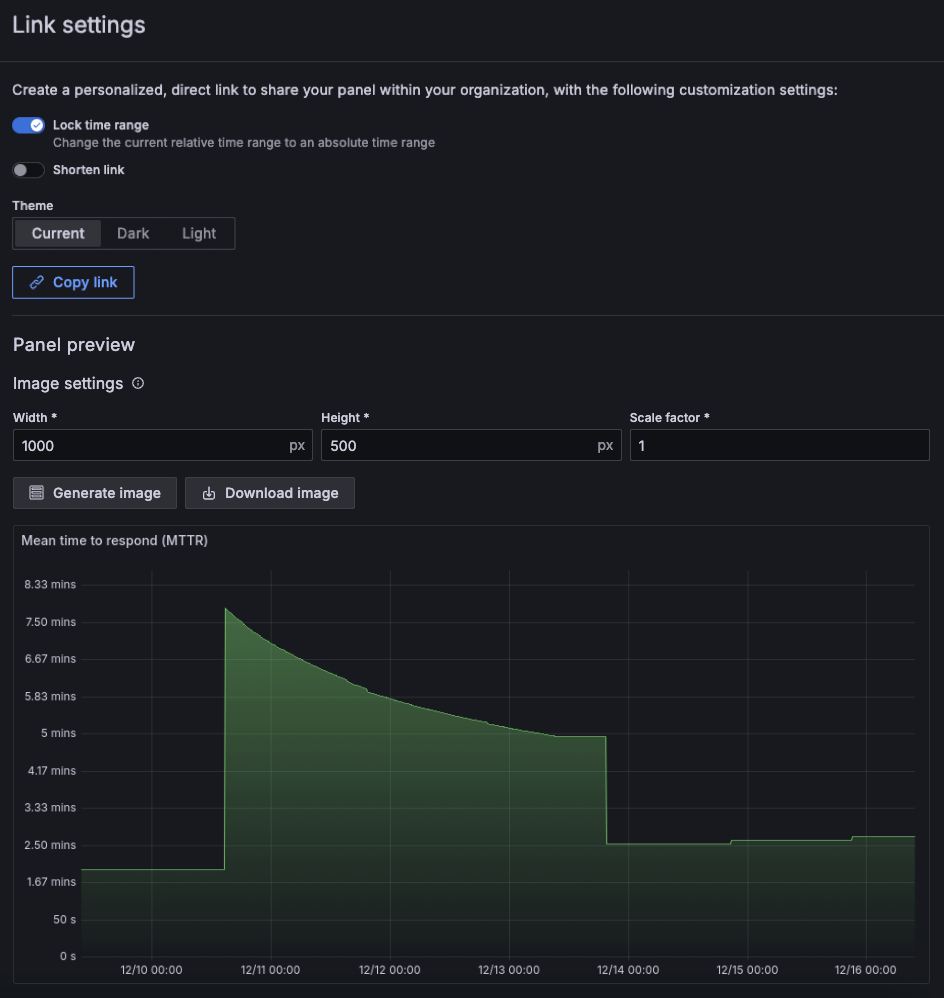
We’ve made some big changes to the panel image sharing experience. When you share a panel link, there’s a new Panel preview section where you can:
We’re excited to announce that a new version of the Grafana Cloud k6 API is now available!
The new Grafana Cloud k6 API includes endpoints that make it easier for teams to integrate k6 with their CI/CD processes. You can:
Grafana-managed alert rules are now supported in Grafana SLO!
Grafana-managed alerting rules gives you access to features like alerting annotations on SLO dashboard panels, SLO alert state history, and images in SLO alert notifications.
Your alerting system can be managed via plugin preferences, and can be set to generate either datasource-managed alert rules, or Grafana-managed alert rules. Check out the documentation for more information.
In October 2024, we announced our redesigned dashboard filters. Now we’re promoting this redesign from public preview to GA.
The redesigned filters are more prominent in the dashboard and filters based on the same ad hoc filter variable are more clearly related. Also, labels can have more than one value using the new multi-select operators. For more information about these changes, refer to the original What’s new entry.