
What's new from Grafana Labs
Grafana Labs products, projects, and features can go through multiple release stages before becoming generally available. These stages in the release life cycle can present varying degrees of stability and support. For more information, refer to release life cycle for Grafana Labs.
Loading...
Area of interest:
Cloud availability:
Cloud editions:
Self-managed availability:
Self-managed editions:
No results found. Please adjust your filters or search criteria.
There was an error with your request.
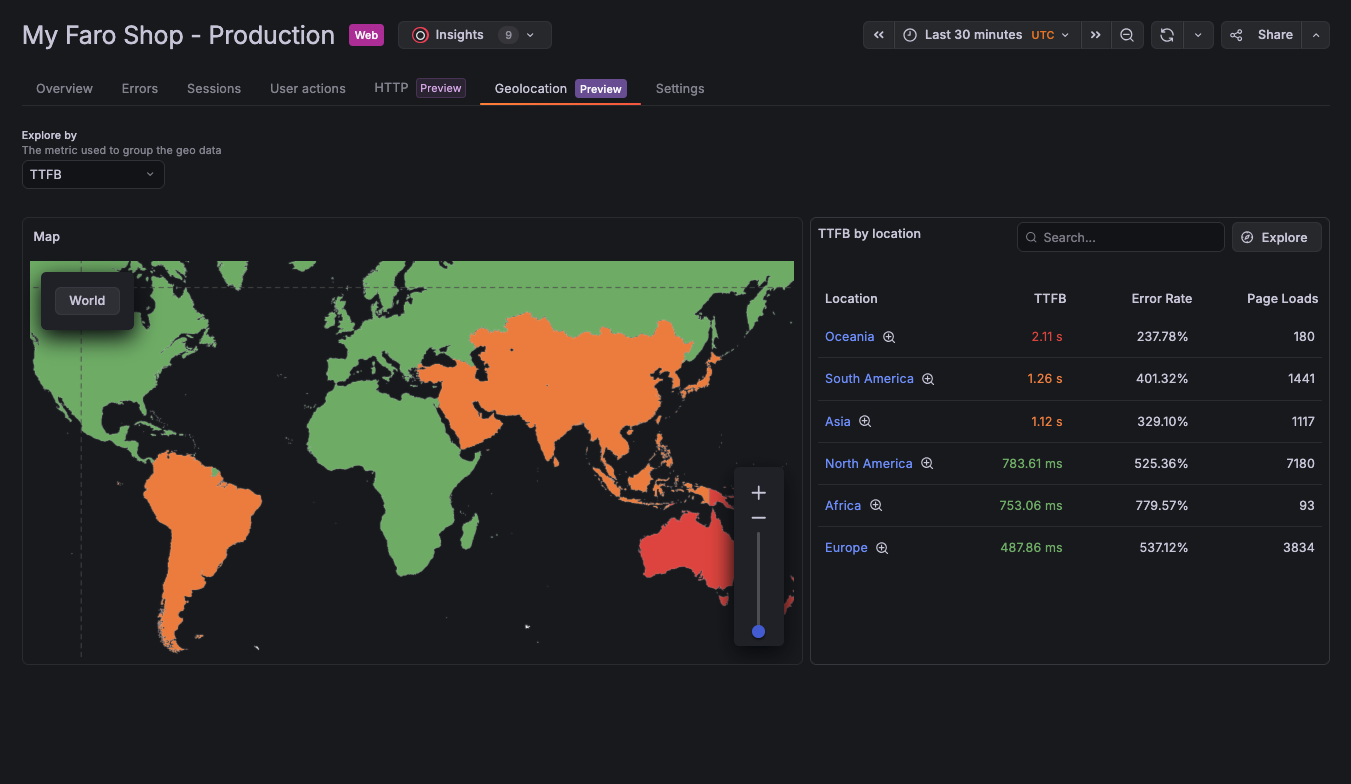
Teams can now quickly spot geographic patterns in performance and errors and drill into the regions driving issues. The new Geolocation tab turns location data into an interactive investigation experience, making it easy to identify hotspots, compare regions, and understand why users are impacted.
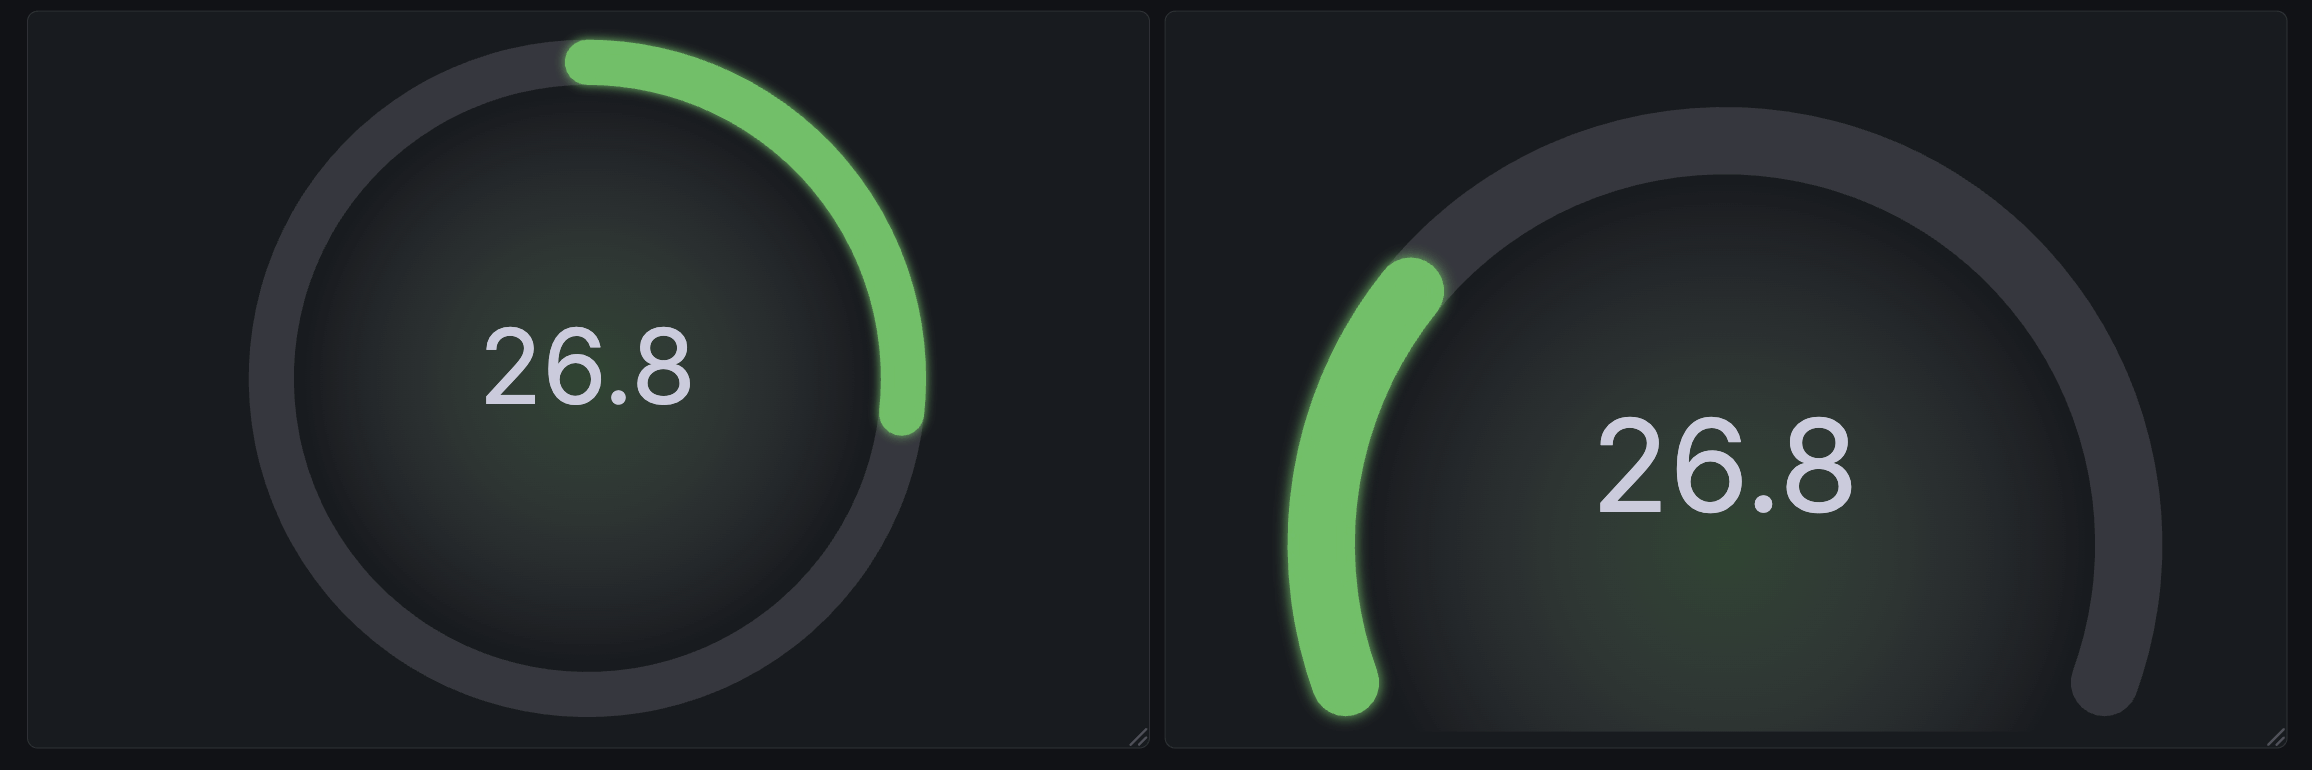
We’ve reimagined the gauge visualization to provide more options and several new variations to make your dashboards more informative and more appealing.
The Circular shape has been introduced as an alternative to the existing Arc gauge under the new Style option.
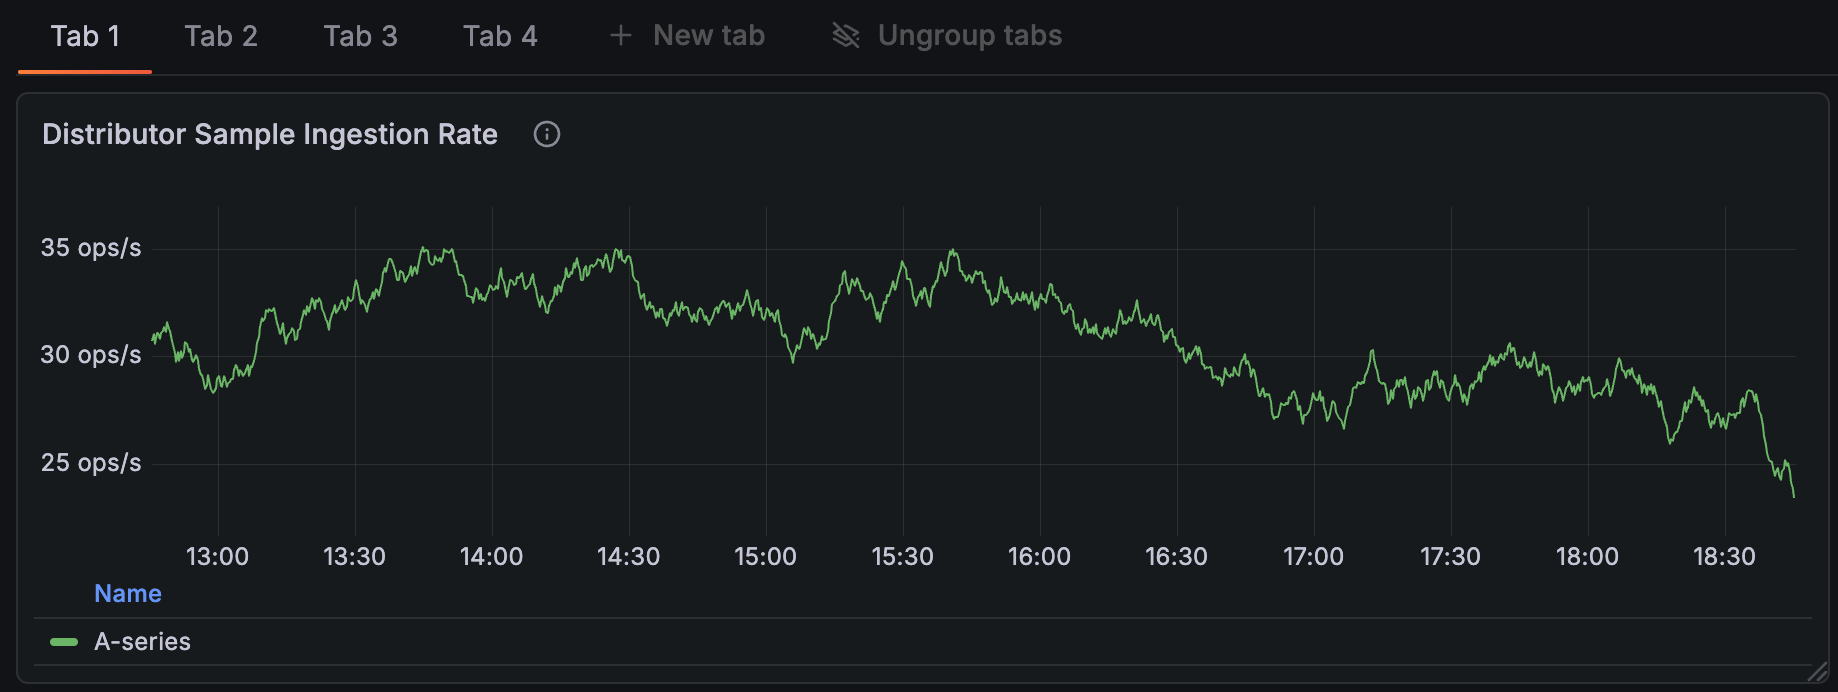
We’re excited to introduce time range pan and zoom in Grafana dashboards and panels!
We’ve added new ways to travel through time in dashboards and panels to make exploring your metrics and data more intuitive and efficient.
Today Grafana Assistant in Slack enters Public Preview!
Grafana Assistant is the premier AI feature in Grafana Cloud that lets you create dashboards, query data, analyze alerts, manage incidents, improve instrumentation and much more. With the Assistant, you can ramp up faster than ever.
The datagrid visualization is deprecated after spending roughly three years in an experimental state. While existing panels that use datagrid will continue to function, it will no longer be available for creating new panels. We strongly encourage you to begin migrating to the table visualization ahead of Grafana 13.0, at which point the datagrid will be fully removed.
Last year, we launched Dynamic dashboards as an experimental feature. Today, we’re pleased to announce that it is now in public preview. This change includes new functionality and a revamped user experience.
Manage your Grafana Cloud Logs costs and performance with the new Loki Query Limit Policies. This feature provides administrators with automated guardrails to prevent large queries that can lead to unexpected billing spikes or system slowdowns.
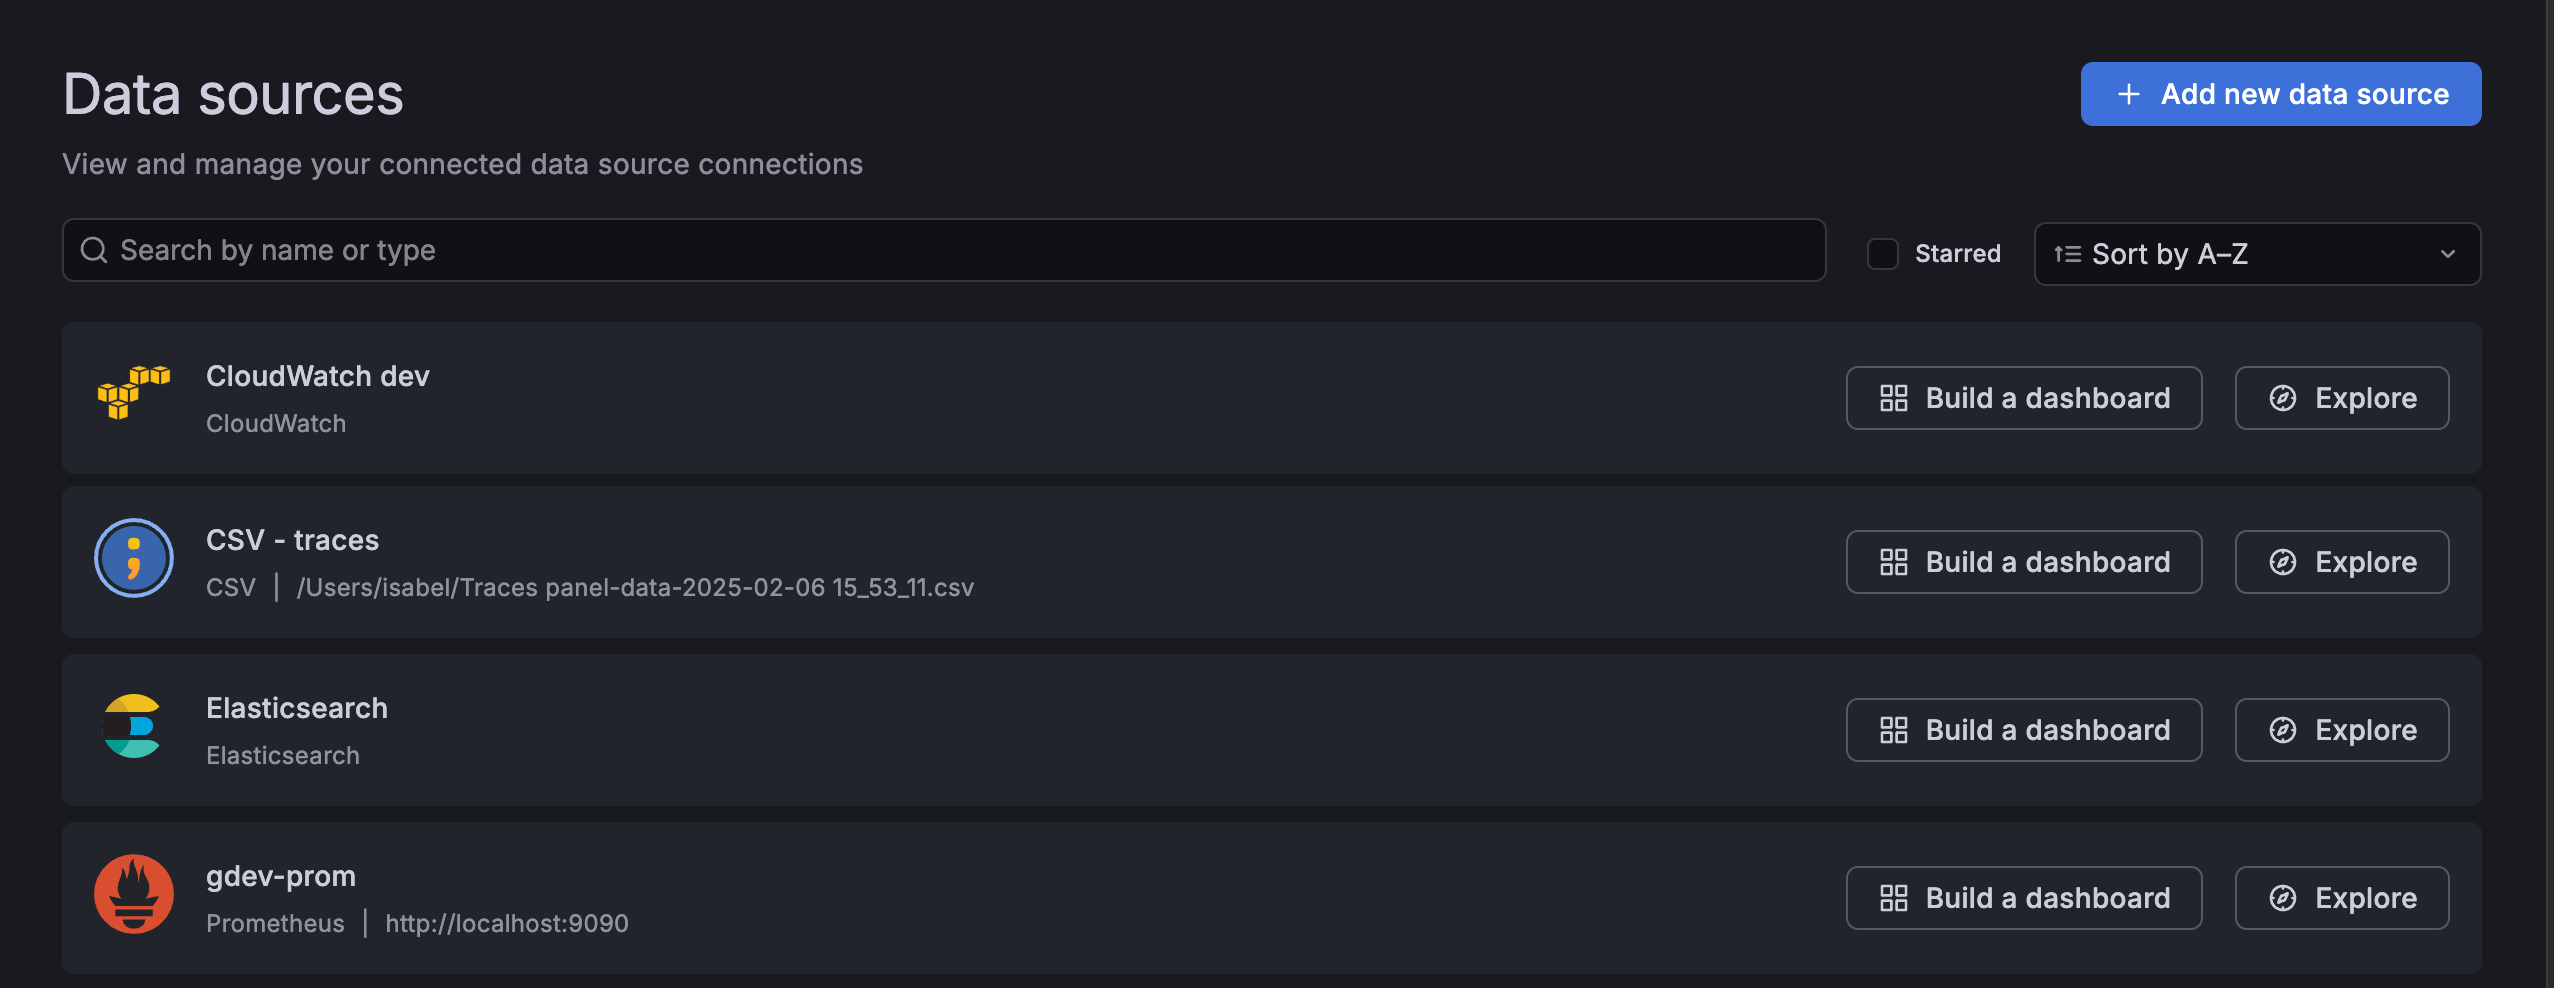
We’re introducing suggested dashboards, a feature designed to reduce the time it takes for you to create your first effective dashboard. Suggested dashboards address the challenge of an empty dashboard by leveraging the context of your data connections. The empty dashboard now includes suggestions for pre-built dashboards based on your connected data sources. With these dashboards, curated from both Grafana and the Community, you can achieve faster initial time-to-insight.
Incident status updates from Grafana IRM are now automatically posted as threaded replies to the original incident announcement message in Slack. This means:
- All incident updates are organized in one place.
- Team members can follow along on incident progress without leaving Slack.
- Stakeholders can subscribe to announcement threads using Slack’s Get notified of new replies setting.
Instead of manually instrumenting services one-by-one, you can remotely discover what’s running across your environment and selectively apply instrumentation where you need coverage.

After it’s installed, Instrumentation Hub automatically discovers what’s running across your environment, building a catalog of services organized by namespace and technology so teams can immediately see what exists, what’s instrumented, and what isn’t.
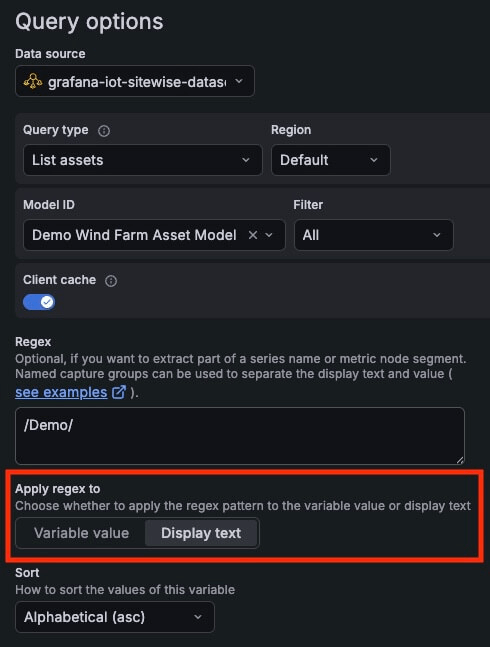
Find the right query variable values to show by applying a regex pattern to the display text instead of the variable value. This is a great shortcut for those times when the text you see in the UI doesn’t match the raw value you need to capture.
Grafana Fleet Management helps you monitor the health of your collectors - at a glance and across a variety of dimensions. With our latest feature, you now have one more way to track collector health. Visual indicators tell you when one of your collectors experiences a remote configuration error and show you where to fix it.
Grafana Fleet Management has introduced an integrated Assistant experience for configuration pipelines. With preconfigured prompts, you can use Assistant to explain, validate, fix, optimize, or visualize your pipelines.

Fine-grained role-based access control (RBAC) has come to Grafana Fleet Management! With the new Collector App Reader role, you can grant read-only access to Fleet Management resources such as collectors, attributes, and configuration pipelines.
Private Source Map Upload is now Generally Available. Grafana Frontend Observability uses source maps to convert stack traces from JavaScript browser errors back into their original representations so that you can see the line of code that cause the issue.