What's new from Grafana Labs Configure metrics and logs easily in AWS Observability app
What's new from Grafana Labs
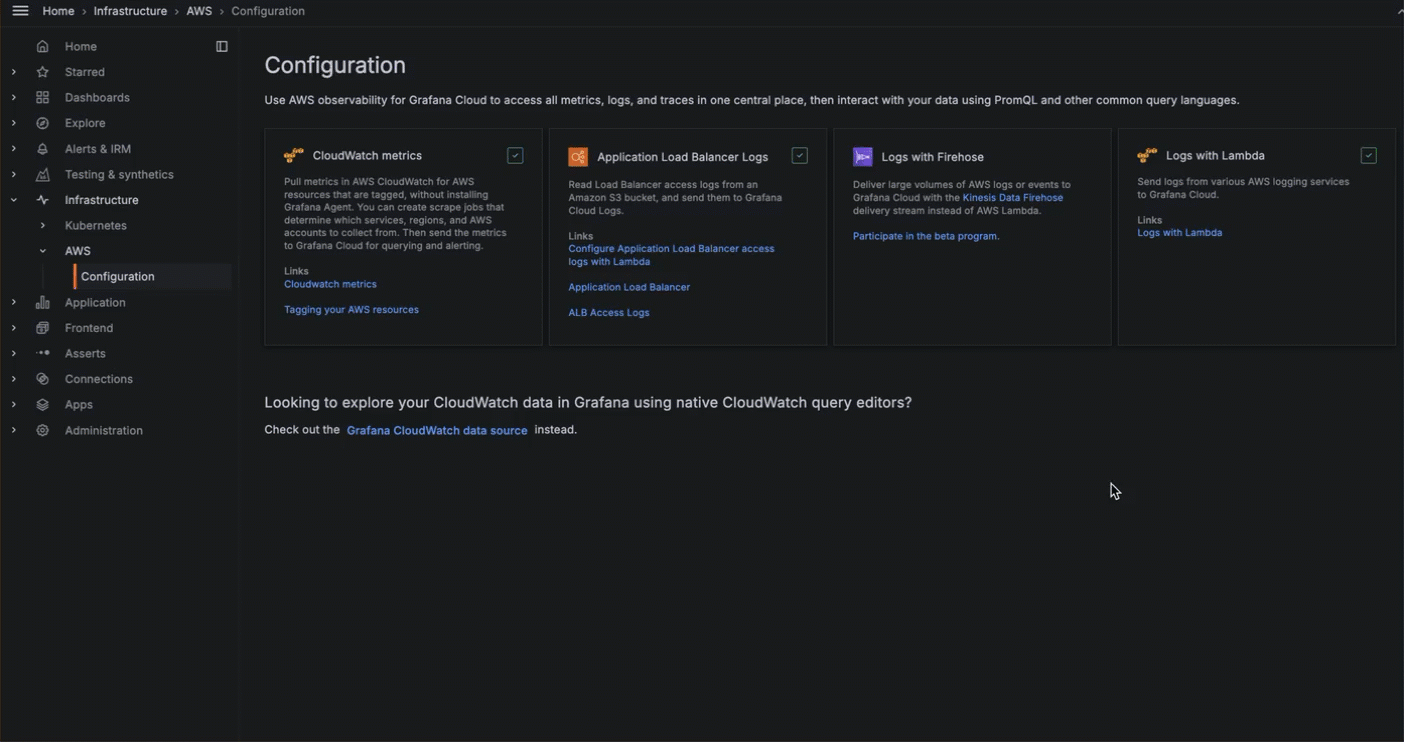
Configure metrics and logs easily in AWS Observability app
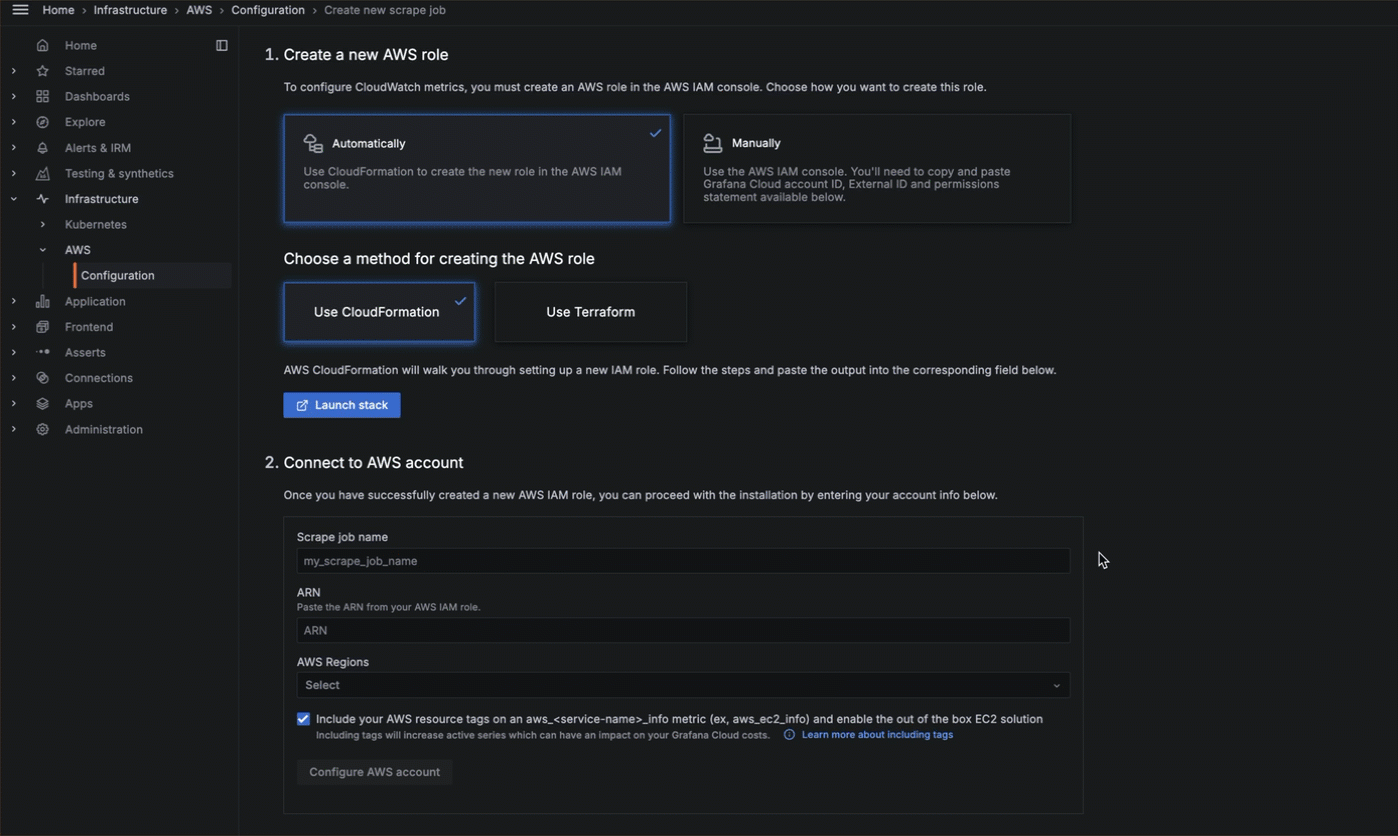
You can choose to configure manually, or use a more streamlined configuration process with CloudFormation or Terraform. To send CloudWatch metrics to Grafana Cloud, you:
- Connect to your AWS account.
- Configure the connection between Grafana Cloud and your AWS account.
- Continue configuration with either CloudFormation or Terraform.
- Choose what service to monitor, what metrics to gather, the scrape interval, and what statistics to gather.
- Add any custom namespaces you want to monitor.
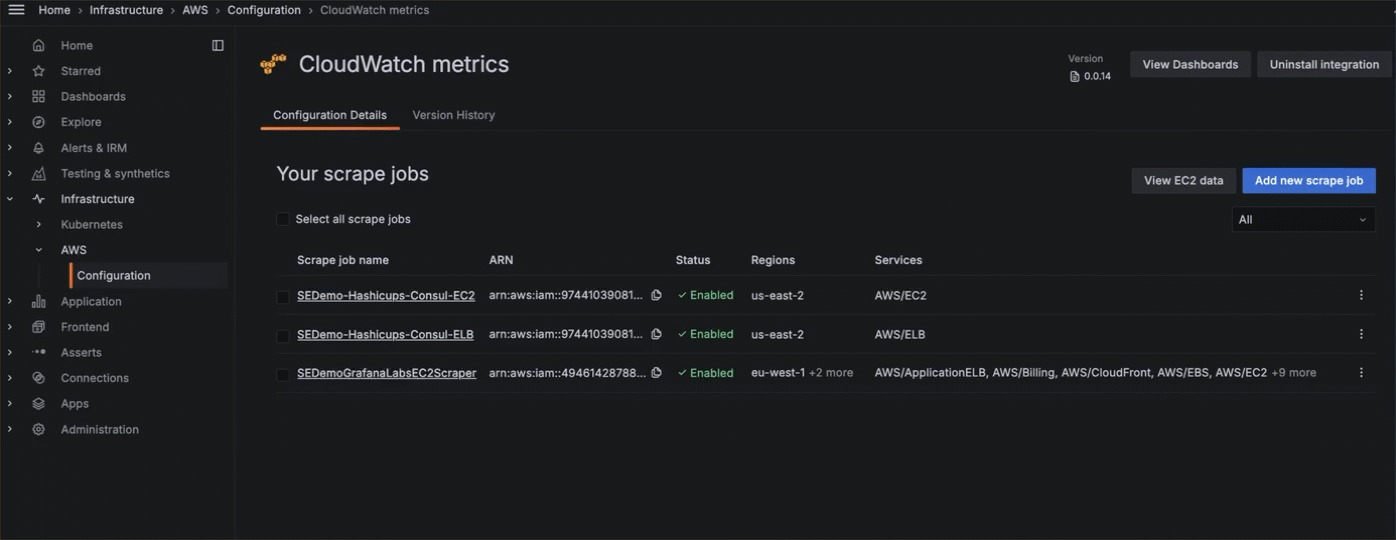
![Metrics configuration]()
You can also edit or delete scrape jobs.
To send CloudWatch or ALB logs to Grafana Cloud, choose CloudFormation or Terraform to configure for setting up a Lambda function.