
What's new from Grafana Labs Centralized Alerts in Kubernetes Monitoring
What's new from Grafana Labs
Centralized Alerts in Kubernetes Monitoring
You can respond to and troubleshoot alerts that are firing about your Kubernetes infrastructure and the applications running within it, without leaving the context of Grafana Kubernetes Monitoring. You can start your troubleshooting either through the home page or the Alerts page.
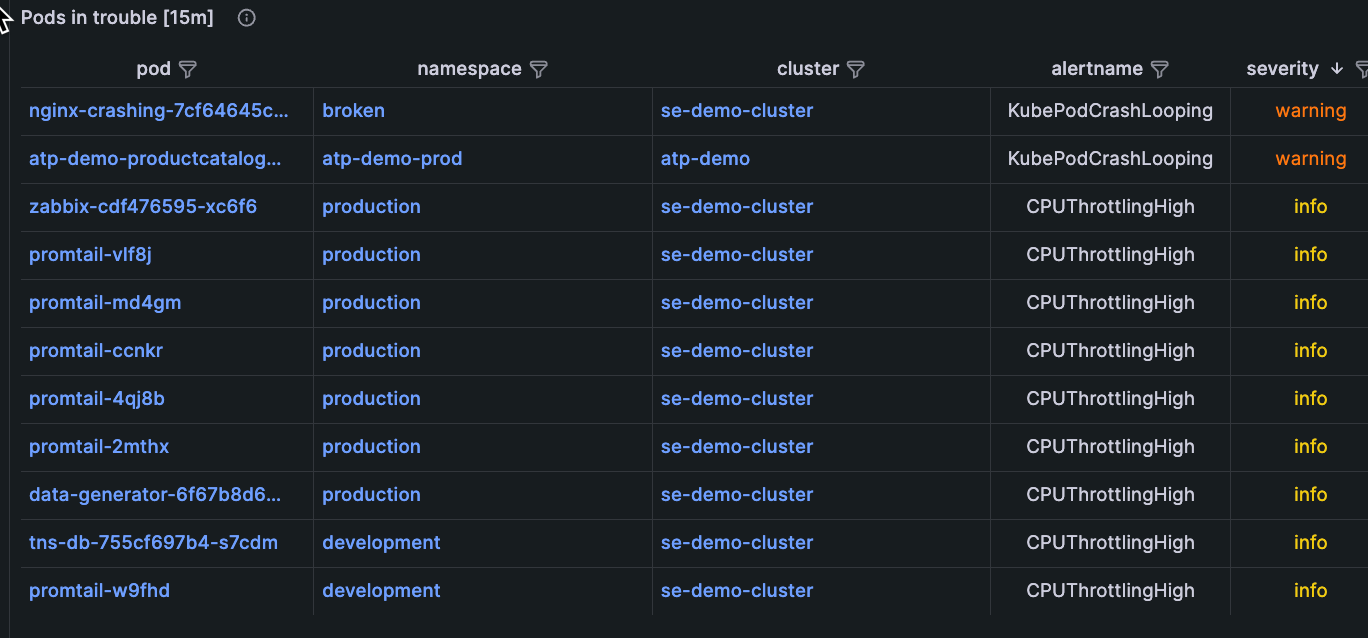
At the Pods in trouble section on the home page, you can view the alert associated with each Pod in the list.
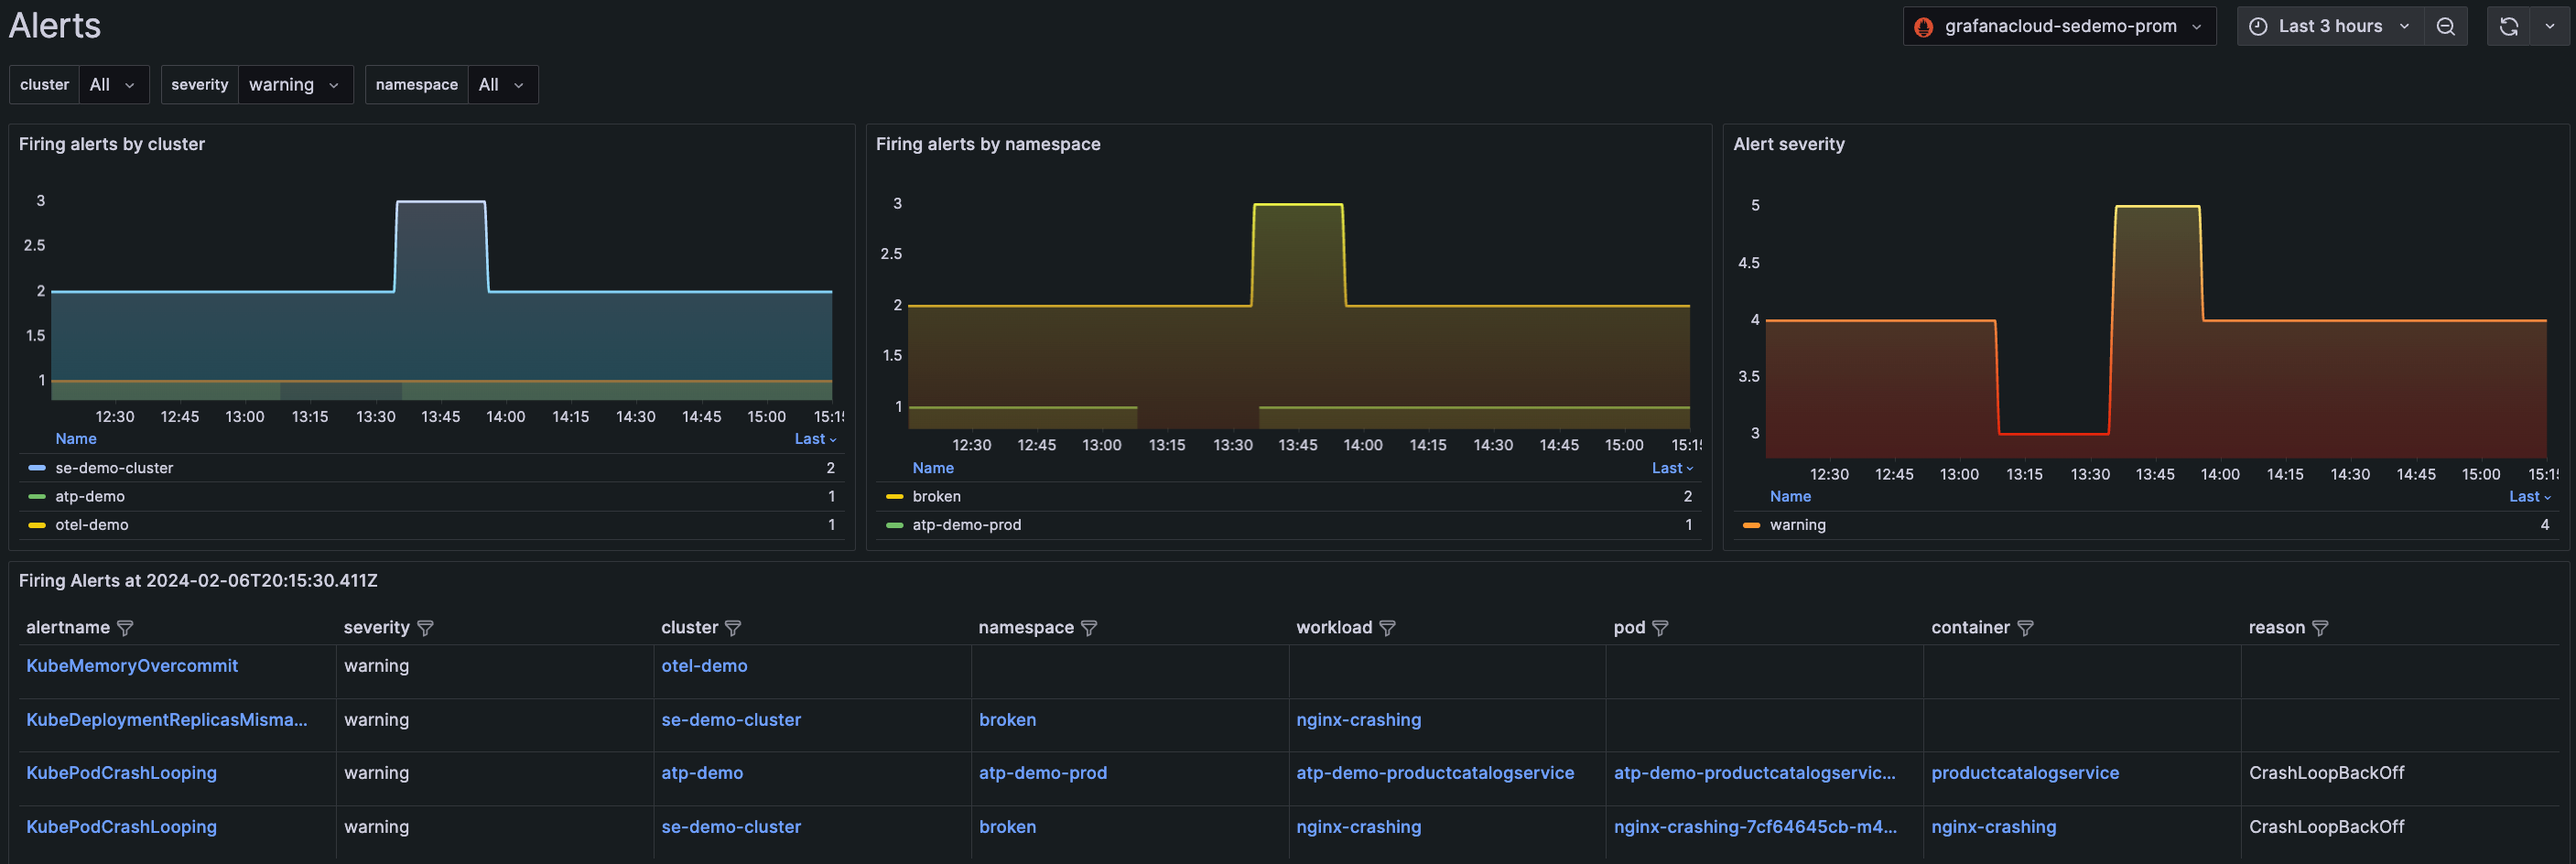
The Alerts page displays all alerts related solely to your Kubernetes infrastructure and any applications within your infrastructure. Here you can filter and drill into issues for quick resolution.
Release v2.0.0
Related What's new posts