
What's new from Grafana Labs Cluster and Node detail pages in Kubernetes Monitoring
What's new from Grafana Labs
Cluster and Node detail pages in Kubernetes Monitoring
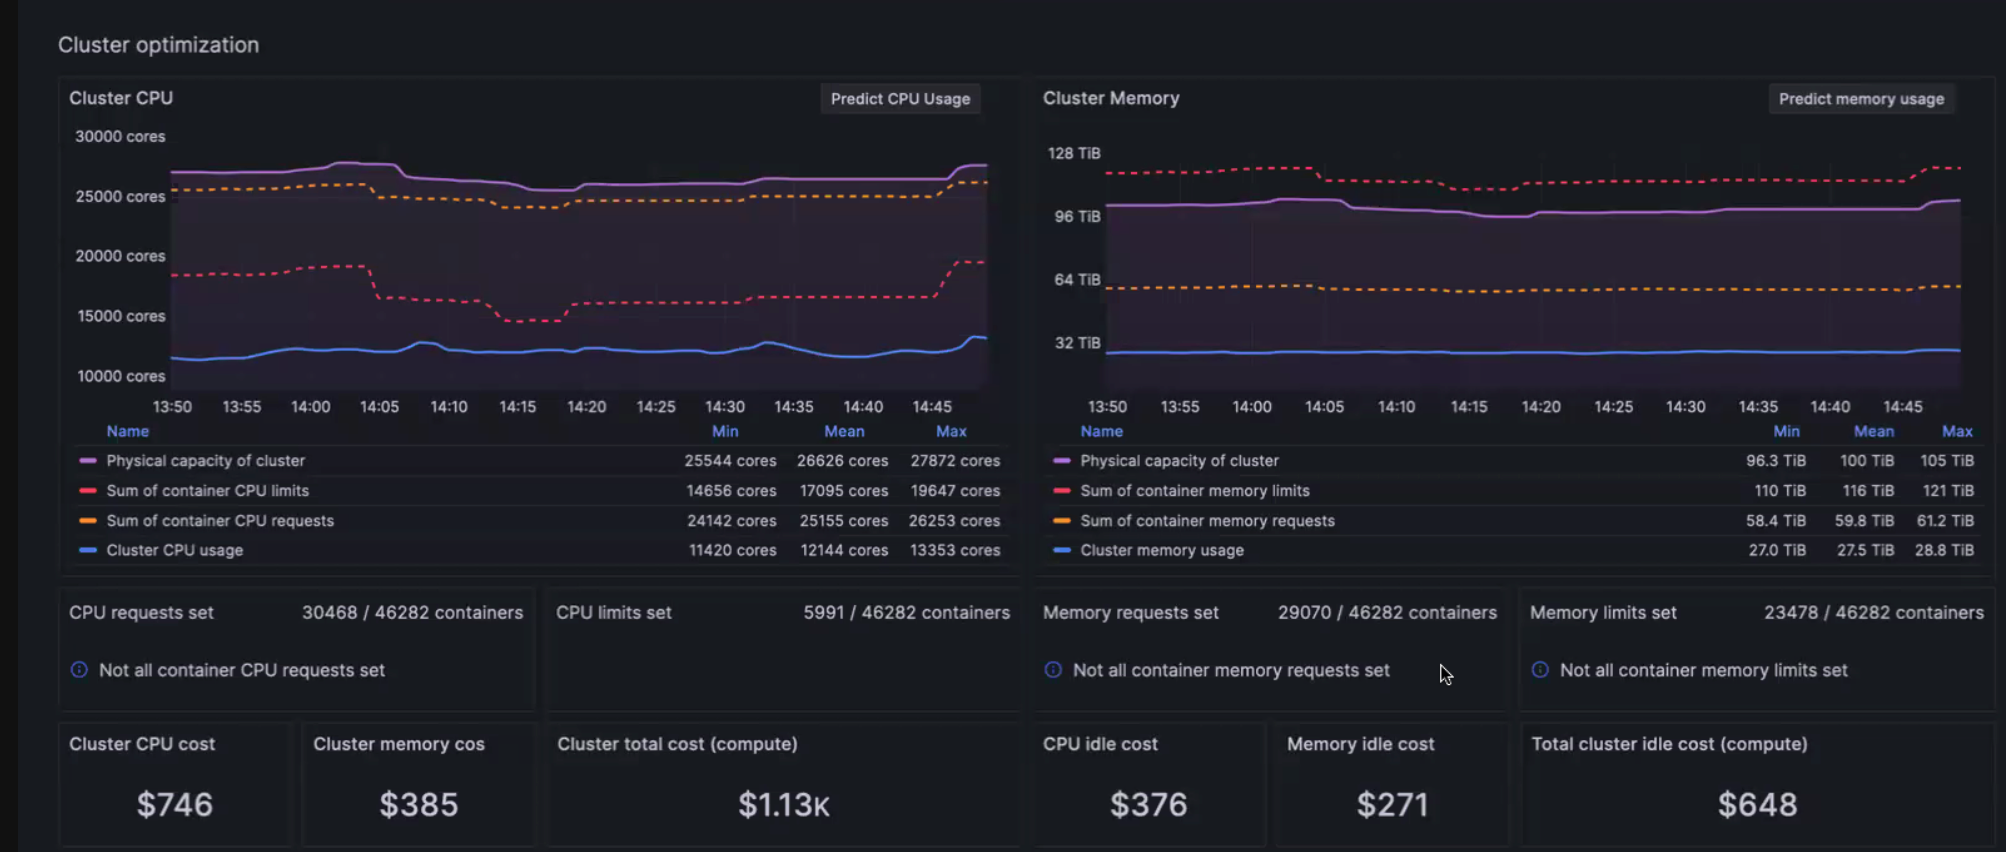
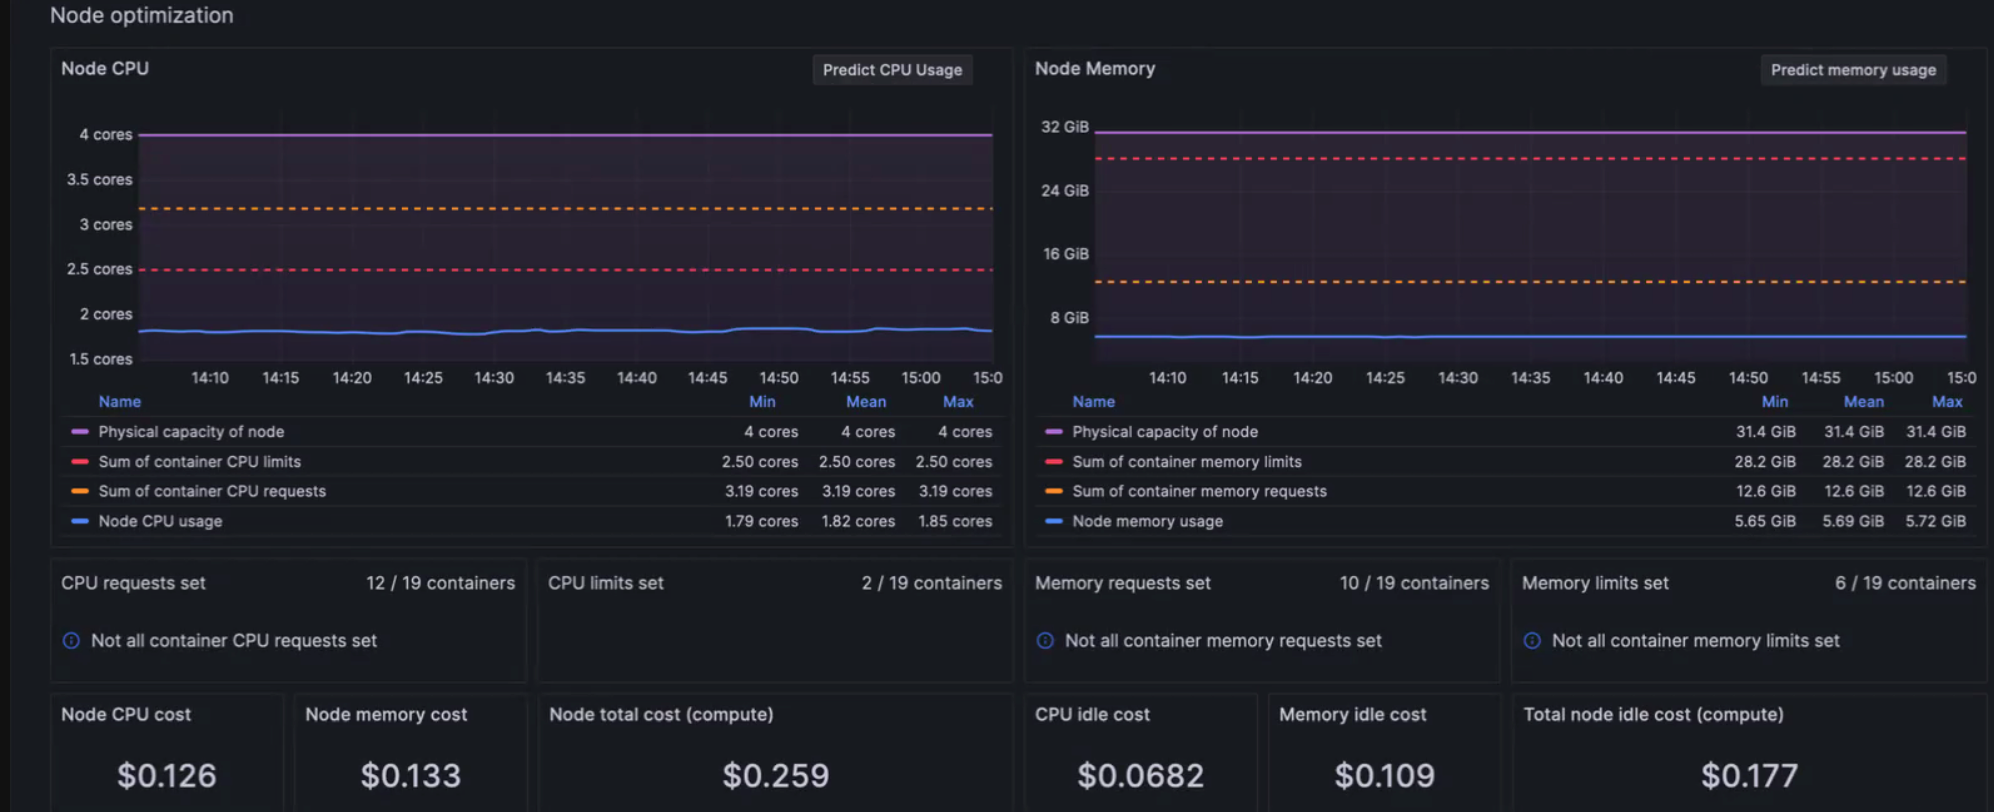
Cost monitoring and investigation and troubleshooting of CPU and memory usage are now easier for both Clusters and Nodes. Go to the optimization panels for the Cluster and Node detail pages to view the CPU and memory utilization, as well as cost information.
These graphs show a history based on the time range you select.
Related What's new posts