Log patterns
Log patterns let you work with groups of similar log lines. You can hide log patterns that are noisy, or focus only on the patterns that are most useful.
Loki automatically extracts patterns when your logs are ingested. Patterns are ephemeral and are only mined from the previous three hours of your logs.
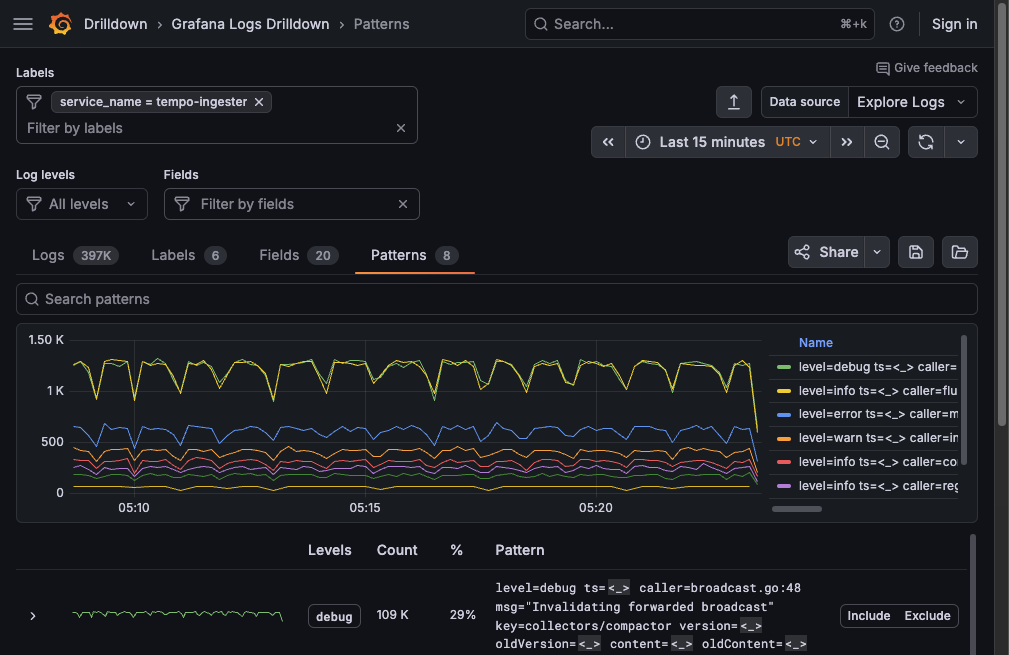
The Grafana Logs Drilldown app shows you the patterns alongside their log volumes. From this view, you can investigate spikes and include or exclude specific log lines from your view.
Patterns can change over time as your logging evolves. To see patterns on the Patterns tab, you must have the pattern ingester enabled in your Loki configuration file. If you don’t see any patterns, refer to Troubleshooting.
Pattern extraction
Loki extracts patterns from a stream of log lines.
For example, if your service logs lines like this:
duration=255ms trace_id=abc001 GET /path/to/endpoint/2
user loaded: 25666
user loaded: 14544
duration=255ms trace_id=abc002 POST /path/to/endpoint/2
user loaded: 25666
duration=355ms trace_id=abc003 GET /path/to/endpoint/1
duration=355ms trace_id=abc004 POST /path/to/endpoint/1
duration=255ms trace_id=abc005 POST /path/to/endpoint/2
user loaded: 89255
duration=4244ms trace_id=abc006 GET /path/to/endpoint/1
user loaded: 25666
duration=255ms trace_id=abc007 GET /path/to/endpoint/2
Two patterns would emerge where the static tokens are preserved literally, and dynamic values are turned into placeholders:
Pattern 1: duration=<_> trace_id=<_> <_> /path/to/endpoint/<_>
Pattern 2: user loaded: <_>
Note
Since Loki 3.0, you can make queries using this simplified pattern match filter operator which is much faster than using regex.
Pattern use cases
Using log patterns you can:
- Browse the log volume over time of different types of logs.
- Simplify log management by grouping similar log entries.
- Enhance log searches by focusing on relevant patterns.
- Improve troubleshooting efficiency by highlighting critical log lines.
- Reduce storage requirements by minimizing log data.
- Filter out noisy log lines during exploration.
- Identify specific log lines for targeted analysis.
Patterns tab user interface overview
Let’s take a closer look at what you can do on the Patterns tab.
The top navigation bar is common across the Grafana interface. The next section is common across all the Logs Drilldown pages.

Patterns tab user interface:
- Search patterns field: Lets you search for text that appears in patterns, for example HTTP methods or response codes.
- >: Expand or collapse a pattern row to view log lines with that pattern.
- Patterns graph: The graph shows you the patterns alongside their log volumes.
- Include and Exclude buttons: Lets you include or exclude the log pattern from the log view.
When you expand a pattern row to view log lines with that pattern, each row has a menu with the following options:
- Show/Hide log details: Select from the menu for the individual log line to view the log line, index labels, parsed fields, and structured metadata. For more information, refer to View logs.
- Show context: Select from the menu to view the log line in the context of the logs that occurred before and after that specific log.
- Copy log line: Select from the menu to copy individual log lines to the clipboard.
The patterns table includes infinite scroll. Scroll to the bottom of the list to load more results.
Guided tour of log patterns
You can follow these steps to perform some common use cases using your own instance or Grafana Play.
Browse log volumes by type
Grafana Logs Drilldown proactively visualizes your log volume data per detected pattern, broken down in various ways. At a glance you can immediately spot spikes or other changes.
For example, if your HTTP service is suffering from a DDoS attack, the relevant graphs will clearly show the spikes. From here you can drill down to discover enough details about the attack to counter it.
Target your analysis
If you know the kind of log line you’re looking for, log patterns are an easy way to remove unwanted log lines from the view.
To view only a specific set of patterns, perform the following steps:
- From the Grafana main menu, select Drilldown > Logs.
- Click Show logs for the relevant service.
- On the service details page, click the Patterns tab.
- Identify a pattern that matches the type of logs you’re interested in viewing.
- Click the Include button for the pattern.
- Return to the Logs tab and note the view only shows log lines that match your selected pattern.
You can repeat steps 4 and 5 to include multiple patterns.
Hide noisy log lines
To hide noisy log lines, perform the following steps:
- From the Grafana main menu, select Drilldown > Logs.
- Click Show logs for the relevant service.
- On the service details page, click the Patterns tab.
- Identify a pattern that represents noise in the logs that you want to remove.
- Click the Exclude button to exclude that pattern.
- Return to the Logs tab and notice the noisy pattern has been removed.
You can repeat steps 4 and 5 to exclude multiple patterns.
Was this page helpful?
Related resources from Grafana Labs


