
Logs
Logs are structured records of events or messages generated by a system or application—that is, a series of text records with status updates from your system or app. They generally include timestamps, messages, and context information like the severity of the logged event.
The logs visualization displays these records from data sources that support logs, such as Elastic, Influx, and Loki. The logs visualization has colored indicators of log status, as well as collapsible log events that help you analyze the information generated.
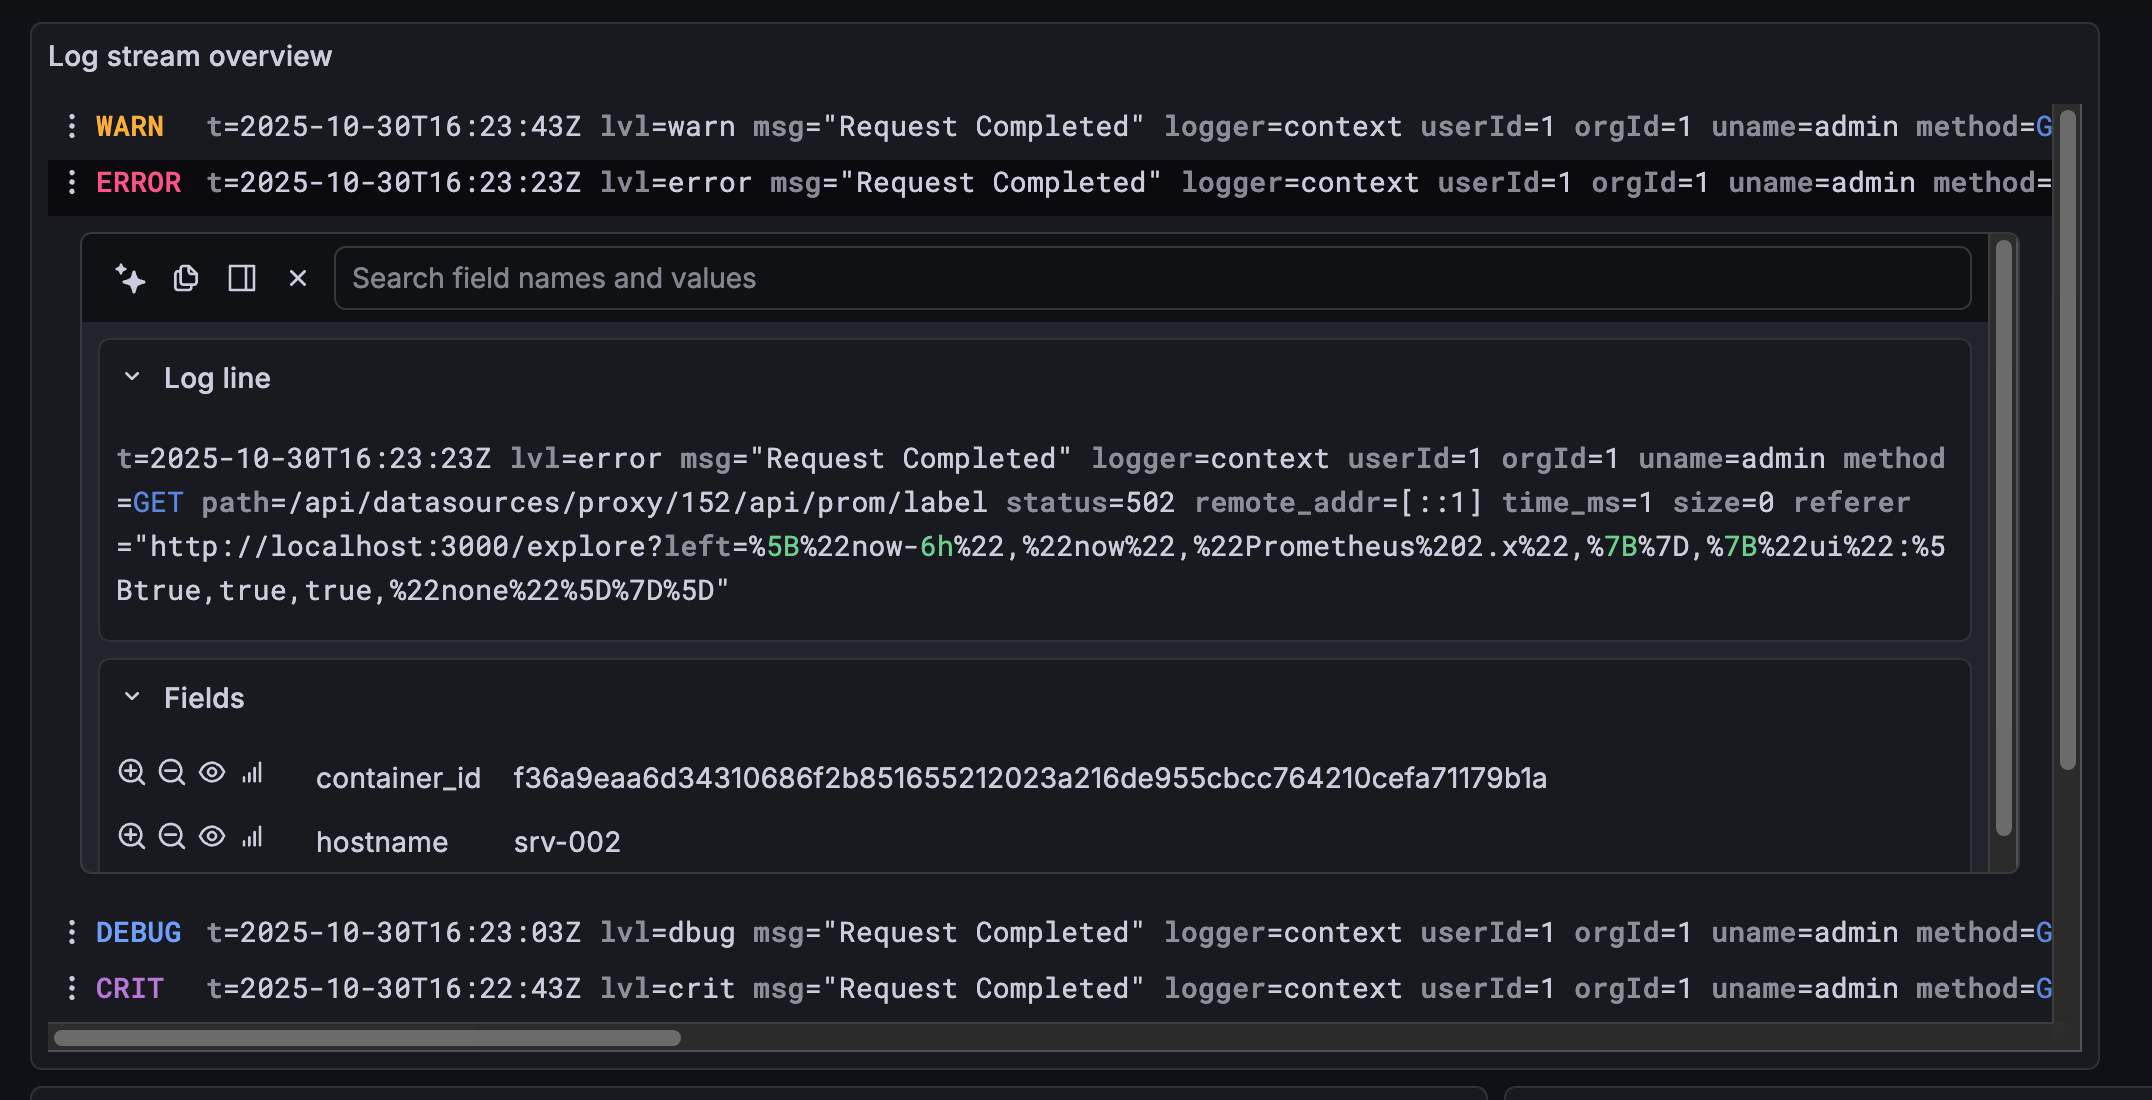
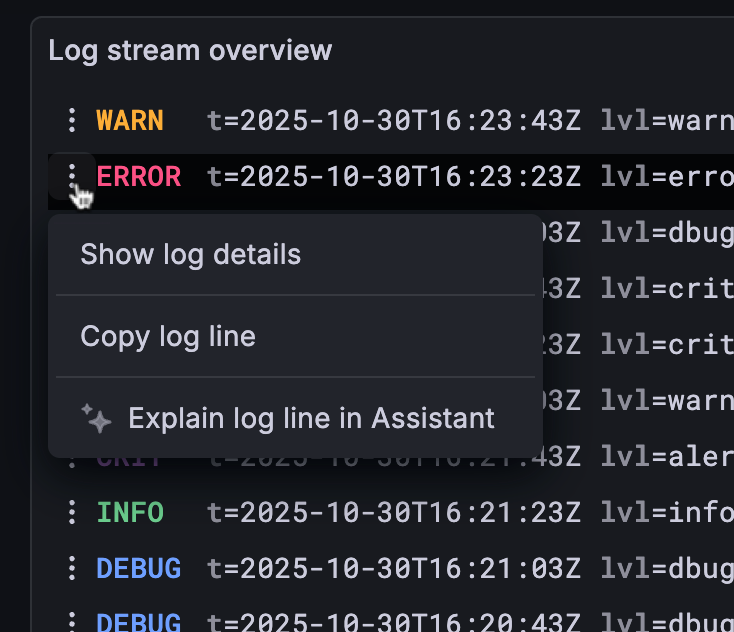
When the log line details are open, you have access to the following additional options:
- Explain log line in Assistant
- Copy to clipboard
- Anchor to the right
- Close log details

You can access the first three options from the log line details or from the log line menu:
With Grafana Play, you can explore and see how it works, learning from practical examples to accelerate your development. This feature can be seen on Logs Panel.
Typically, you use logs with a graph visualization to display the log output of a related process. If you have an incident in your application or systems, such as a website disruption or code failure, you can use the logs visualization to help you figure out what went wrong, when, and even why.
Configure a log visualization
The following video provides a walkthrough of creating a logs visualization. You’ll also learn how to customize some settings and log visualization caveats:
Supported data formats
The logs visualization works best with log-type datasets such as queries from data sources like Loki, Elastic, and InfluxDB.
You can also build log-formatted data from other data sources as long as the first field is a time type followed by string, number, and time fields. The leading time field is used to sort and timestamp the logs and if the data contains other time-type fields, they’re included as elements of the logged record.
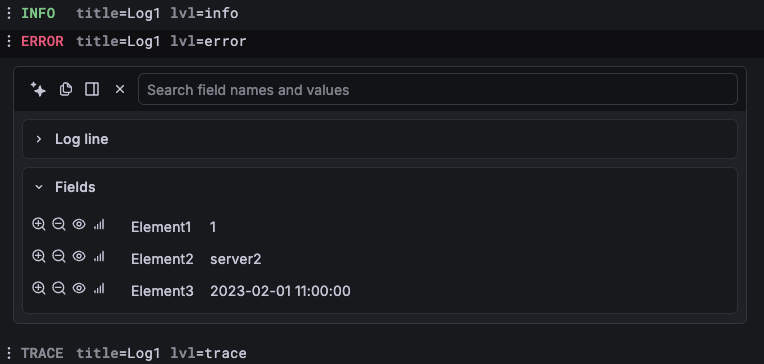
The second field is used as the log record title regardless of whether it’s a time, numeric, or string field. Usually the second field is a text field containing multiple string elements, but if the message level (or lvl) is present, the visualization uses the values in it to add colors to the record, as described in
Log levels integration.
Subsequent fields are collapsed inside of each log record.
To limit the number of log lines rendered in the visualization, you can use the Max data points setting in the panel Query options. If that option isn’t set, then the data source typically enforces its own default limit.
Example
Log level
For logs where a level label is specified, we use the value of the label to determine the log level and update color accordingly. If the log doesn’t have a level label specified, we try to find out if its content matches any of the supported expressions (see below for more information). The log level is always determined by the first match. In case Grafana is not able to determine a log level, it will be visualized with unknown log level. See
supported log levels and mappings of log level abbreviation and expressions.
Configuration options
The following section describes the configuration options available in the panel editor pane for this visualization. These options are, as much as possible, ordered as they appear in Grafana.
Panel options
In the Panel options section of the panel editor pane, set basic options like panel title and description, as well as panel links. To learn more, refer to Configure panel options.
Logs options
Use these settings to refine your visualization:


