
Configure data links and actions
Data links allow you to link to other panels, dashboards, and external resources and actions let you trigger basic, unauthenticated, API calls. In both cases, you can carry out these tasks while maintaining the context of the source panel.
Data links
With data links, you can create links that include the series name or even the value under the cursor. For example, if your visualization shows four servers, you can add a data link to one or two of them.
The link itself is accessible in different ways depending on the visualization. For the time series visualization you need to click a data point or line:

For visualizations like stat, gauge, or bar gauge you can click anywhere on the visualization to open the context menu:
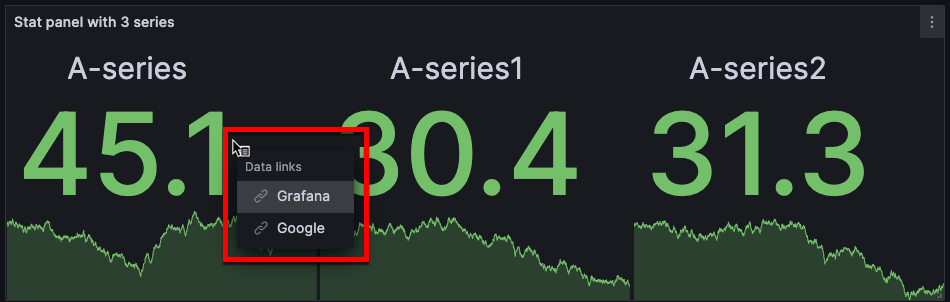
If there’s only one data link in the visualization, clicking anywhere on the visualization opens the link rather than the context menu.
Supported visualizations
You can configure data links for the following visualizations:
Actions
Using actions, you can trigger processes like starting or shutting down a server, directly from a dashboard panel. API settings are configured in the Add action dialog box. You can also pass variables in the API editor.
Supported visualizations
You can configure actions for the following visualizations:
Data link and action variables
Variables in data links and actions let you send people to a detailed dashboard or trigger an API call with preserved data filters. For example, you could use variables to specify a label, time range, series, or variable selection.
To see a list of available variables, enter $ in the data link or action URL field.
Note
These variables changed in 6.4 so if you have an older version of Grafana, then use the version picker to select docs for an older version of Grafana.
Azure Monitor, CloudWatch, and Google Cloud Monitoring have pre-configured data links called deep links.
You can also use template variables in your data links or actions URLs. For more information, refer to Templates and variables.
Time range panel variables
These variables allow you to include the current time range in the data link or action URL:
When you create data links and actions using time range variables like __url_time_range in the URL, you have to form the query parameter syntax yourself; that is, you must format the URL by appending query parameters using the question mark (?) and ampersand (&) syntax. These characters aren’t automatically generated.
Series variables
Series-specific variables are available under __series namespace:
Field variables
Field-specific variables are available under __field namespace:
Value variables
Value-specific variables are available under __value namespace:
Using value-specific variables in data links and actions can show different results depending on the set option of Tooltip mode.
When you create data links and actions using time range variables like __value.time in the URL, you have to form the query parameter syntax yourself; that is, you must add the question mark (?) and ampersand (&). These characters aren’t automatically generated.
Data variables
To access values and labels from other fields use:
Template variables
When linking to another dashboard that uses template variables, select variable values for whoever clicks the link.
${var-myvar:queryparam} - where var-myvar is the name of the template variable that matches one in the current dashboard that you want to use.
If you want to add all of the current dashboard’s variables to the URL, then use ${__all_variables}.
When you link to another dashboard, ensure that:
- The target dashboard has the same variable name. If it doesn’t (for example,
serverin the source dashboard andhostin the target), you must align them or explicitly map values (for example,&var-host=${server}). - You use the variable name, and not the label. Labels are only used as display text and aren’t recognized in URLs.
For example, if you have a variable with the name var-server and the label ChooseYourServer, you must use var-server in the URL, as shown in the following table:
Add data links or actions
The following tasks describe how to configure data links and actions.
To add a data link, follow these steps:
Navigate to the panel to which you want to add the data link.
Hover over any part of the panel to display the menu icon in the upper-right corner.
Click the menu icon and select Edit to open the panel editor.
Scroll down to the Data links and actions section and expand it.
Click + Add link.
In the dialog box that opens, enter a Title.
This is a human-readable label for the link displayed in the UI. This is a required field.
Enter the URL to which you want to link.
(Optional) To add a data link variable, click in the URL field and enter
$or press Ctrl+Space or Cmd+Space to see a list of available variables.If you want the link to open in a new tab, toggle the Open in a new tab switch.
If you want the data link to open with a single click on the visualization, toggle the One click switch.
Only one data link can have One click enabled at a time. One click is only supported for some visualizations.
Click Save to save changes and close the dialog box.
Click Save dashboard.
Click Back to dashboard and then Exit edit.
Note
Actions are not supported for all visualizations. For the list of supported visualizations, refer to Supported visualizations.
To add an action, by follow these steps:
Navigate to the panel to which you want to add the action.
Hover over any part of the panel to display the menu icon in the upper-right corner.
Click the menu icon and select Edit to open the panel editor.
Scroll down to the Data links and actions section and expand it.
Click + Add action.
In the dialog box that opens, define the API call settings:
Click Save to save changes and close the dialog box.
Click Save dashboard.
Click Back to dashboard and then Exit edit.
If you add multiple data links or actions, you can control the order in which they appear in the visualization. To do this, click and drag the data link or action to the desired position.


