
Create and manage reports
Note
The redesigned reporting feature is currently in public preview. Grafana Labs offers limited support, and breaking changes might occur prior to the feature being made generally available. To use this feature, enable the
newShareReportDrawerfeature toggle in your Grafana configuration file or, for Grafana Cloud, contact Support.
Reporting allows you to send automated and scheduled emails from any of your dashboards. You can configure several elements of these reports and generate PDFs and CSV files. Any changes you make to a dashboard used in a report are reflected the next time the report is sent.
Requirements
For Grafana Enterprise, the Reporting feature has the following requirements:
- SMTP must be configured for reports to be sent. Refer to SMTP configuration documentation for more information.
- The Grafana image renderer plugin (v3.10+) must be installed or the remote rendering service must be set up. Refer to Image rendering for more information.
Rendering configuration
By default, attachments (PDFs, CSV files, and embedded images) larger than 10 MB are not sent, which keeps email servers from rejecting the email. You can increase or decrease this limit in the reporting configuration.
When a report file is generated, it’s temporarily written to the corresponding folder (csv, pdf, png) in the Grafana data folder.
A background job runs every 10 minutes and removes temporary files.
You can set how long a file should be stored before being removed by configuring the
temp_data_lifetime setting in your ini file.
Access control
Only organization administrators can create reports by default. You can customize who can create reports with role-based access control (RBAC).
When RBAC is enabled, you need to have the relevant permissions to create and manage reports. Refer to specific guides to understand what permissions are required.
Create a report
The report creation process is multi-step, but you don’t need to complete these steps in order.
You can also save the report as a draft at any point during the initial creation process.
You can create directly from a dashboard or from the Reporting page. Select one of the following tabs for directions on each option.
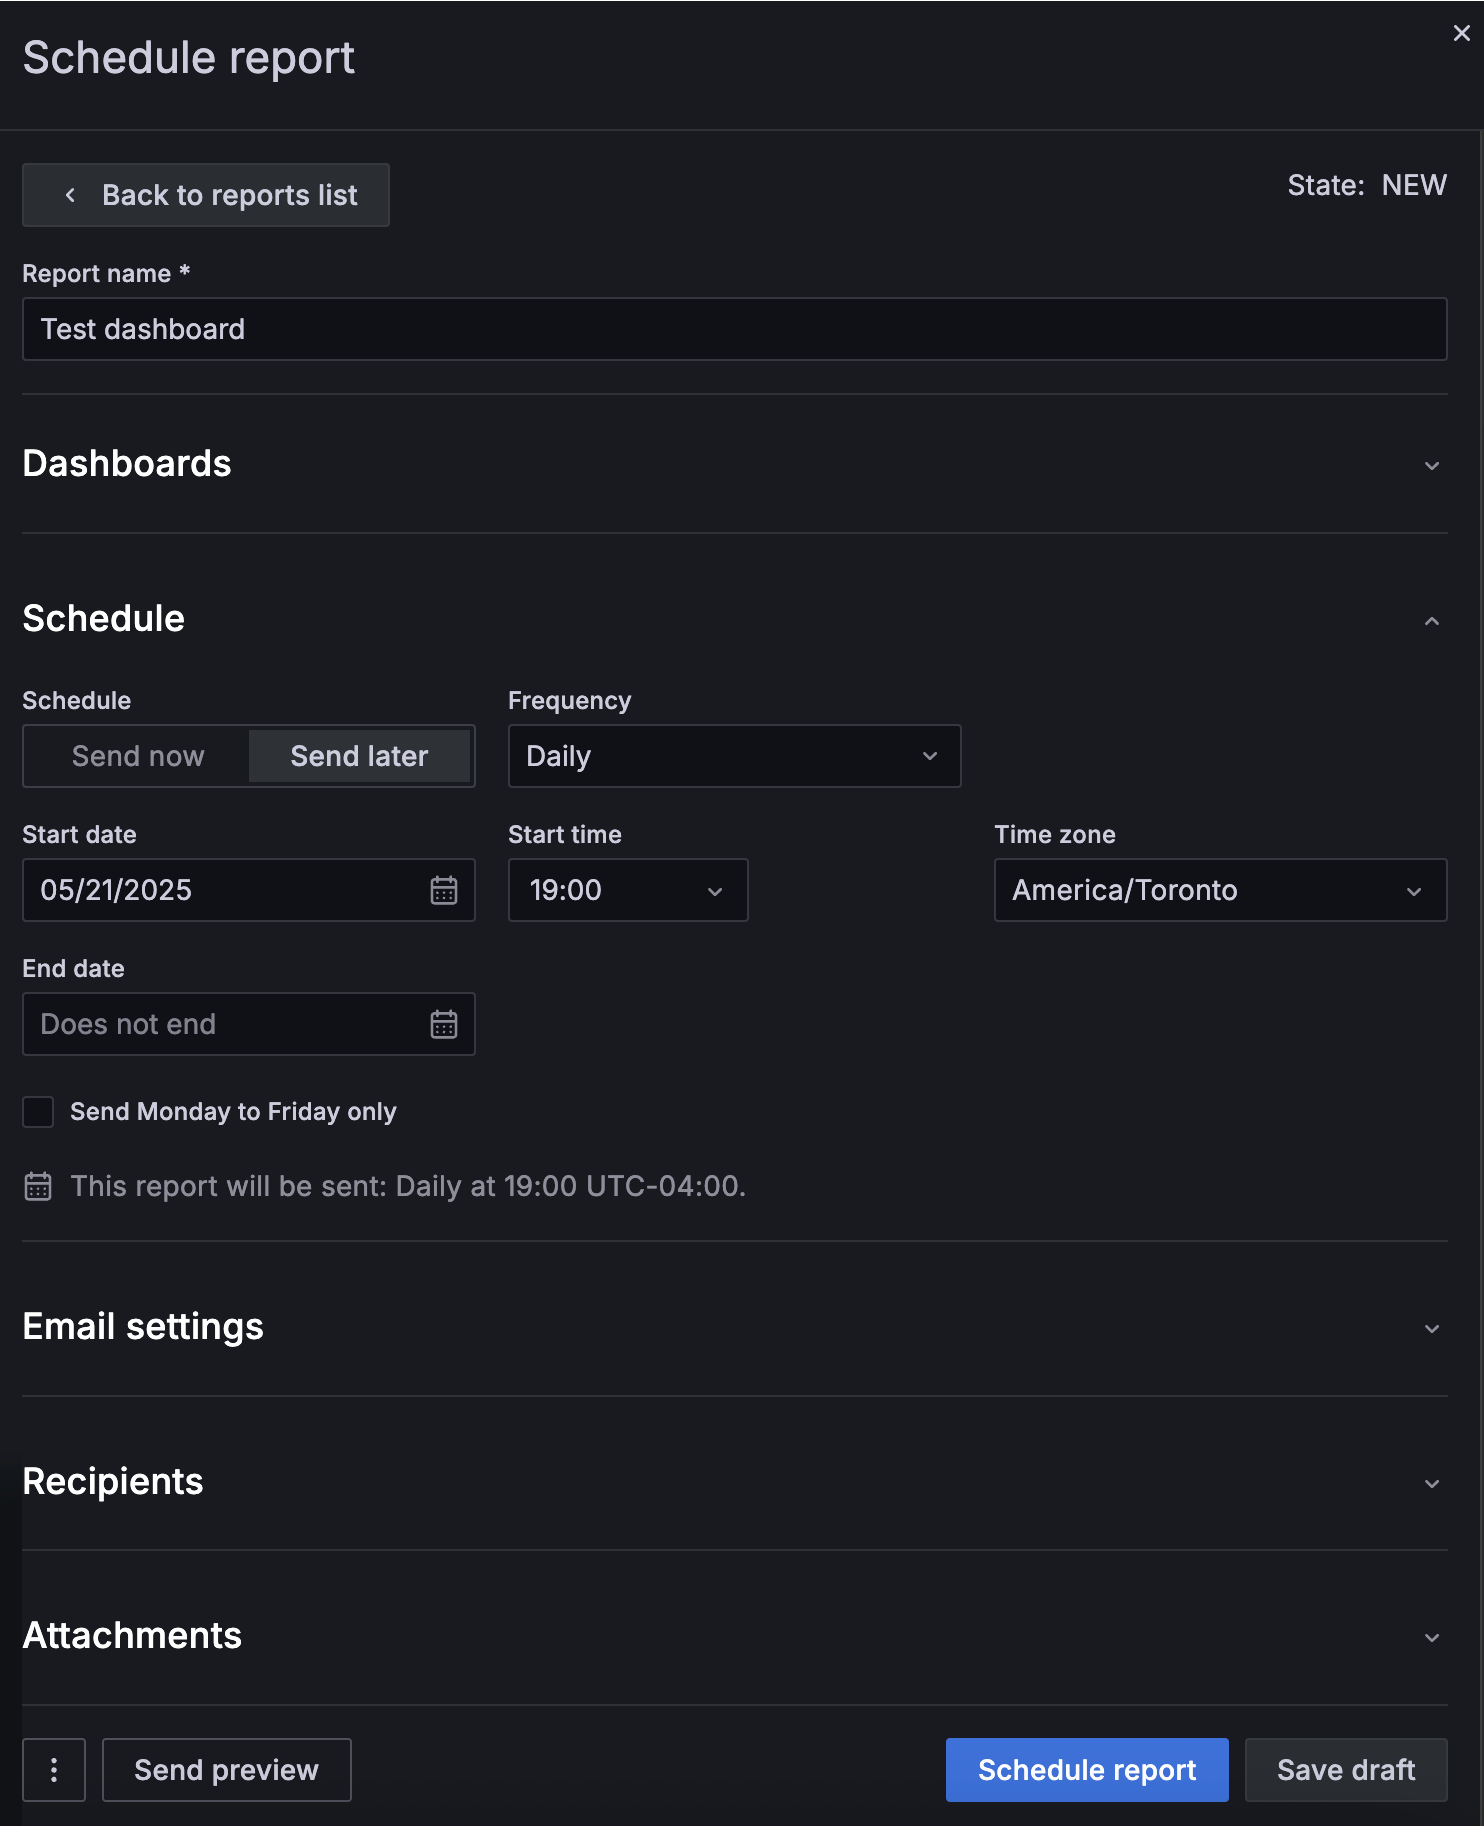
To create a report, follow these steps:
In the main menu, click Dashboards.
Navigate to the dashboard from which you want to create a report.
Click the Share drop-down list in the top-right corner of the dashboard.
Click Schedule report.
The Schedule report drawer opens. Any other reports using this dashboard are listed in the drawer. You can also click See all reports to navigate to Reporting for a full list of reports generated from all dashboards.
Click + Create a new report.
Update the name of the report, if needed.
By default, the report name is the name of the dashboard.
Expand and complete each section of the report, as needed:
Click one of the following buttons at the bottom of the Schedule report drawer:
The menu icon to access the following options:
- Download CSV
- Preview PDF
- Report settings - Takes you to Reporting in a new browser tab and opens the Report template settings drawer, where you can configure organization-level report settings.
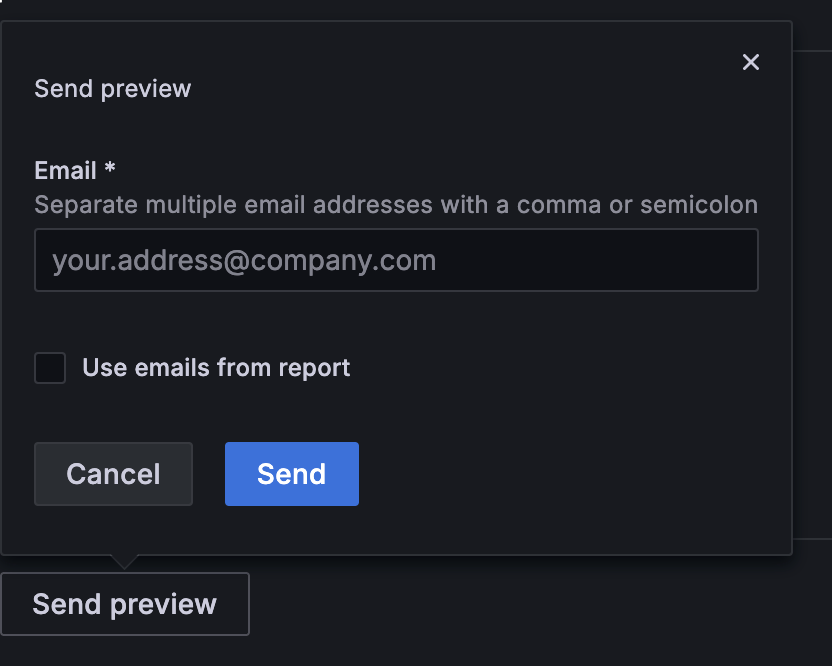
Send preview - Send a preview of the report to your desired recipient. You can choose to use the report recipients:
![The Send preview modal]()
Schedule report - The report is sent according the schedule you’ve set.
Save draft - You can save a draft at any point during the initial report creation process, even if it’s missing required fields. The report won’t be sent according to its schedule while it’s a draft.
If you click the x at the top of the drawer without scheduling or saving the report as a draft, the report is discarded. This action can’t be reversed.
When you finish configuring the report, click the x at the top of the Schedule report drawer to close it.
In the main menu, click Dashboards > Reporting.
Click + Create a new report.
The Schedule report drawer opens.
Enter a name for the report.
Expand and complete each section of the report, as needed:
Click one of the following buttons at the bottom of the Schedule report drawer:
The menu icon to access the following options:
- Download CSV
- Preview PDF
- Report settings - Opens the Report template settings drawer, where you can configure organization-level report settings.
Send preview - Send a preview of the report to your desired recipient. You can choose to use the report recipients:
![The Send preview modal]()
Schedule report - The report is sent according the schedule you’ve set.
Save draft - Save a draft at any point during the initial report creation process, even if it’s missing required fields. The report won’t be sent according to its schedule while it’s a draft.
If you click the x at the top of the drawer without scheduling or saving the report as a draft, the report is discarded. This action can’t be reversed.
When you finish configuring the report, click the x at the top of the Schedule report drawer to close it.
1. Dashboards
At this step, select the dashboard or dashboards on which the report is based, as well as the variables and time ranges for those dashboards. The options are:
Time range
If you leave the Time range field empty, reports use the saved time range of the dashboard. Optionally, you can change the time range of the report by setting it in the Time range field. If specified, the custom time range overrides the time range from the report’s dashboard.
Customize template variables
Configure report-specific template variables for the dashboard. The variables that you select override the variables from the dashboard. For detailed information about using template variables, refer to Variables.
The query variables saved with a report might become out of date if the results of that query change. For example, if your template variable queries for a list of hostnames and a new hostname is added, then it won’t be included in the report. If that occurs, the selected variables must be manually updated in the report. If you select the All value for the template variable or if you keep the dashboard’s original variable selection, then the report stays up-to-date as new values are added.
This option is only displayed if the dashboard has variables.
2. Schedule
At this step, set scheduling information. Options vary depending on the frequency you select.
Time zone
Reports use the time zone of the dashboard from which they’re generated. You can control the time zone for your reports by setting the dashboard to a specific time zone. Note that this affects the display of the dashboard for all users.
If a dashboard has the Browser Time setting, the reports generated from that dashboard use the time zone of the Grafana server. As a result, this time zone might not match the time zone of users creating or receiving the report. If you want to use a specific time zone, save the dashboard with a fixed time zone instead of Browser Time
Each dashboard’s time zone setting is visible in the time range controls.
3. Email settings
At this step, configure the report email:
4. Recipients
Enter the email addresses of the people or teams that you want to receive the report, separated by commas or semicolons.
5. Attachments
At this step, select one or more report attachment options. You can select multiple options, but you must select at least one:
- Attach the report as a PDF - Attach the report as one PDF file.
- Attach a separate PDF of table data - Attach a separate PDF file to the report email for each table panel on the selected dashboard. Public preview only.
- Attach a CSV file of table panel data - Attach a CSV file to the report email for each table panel on the selected dashboard.
PDF format
If you selected a PDF attachment, configure the following formatting options:
Layout and orientation
| Layout | Orientation | Description | Preview |
|---|---|---|---|
| Simple | Portrait | Generates an A4 page in portrait mode with three panels per page. | 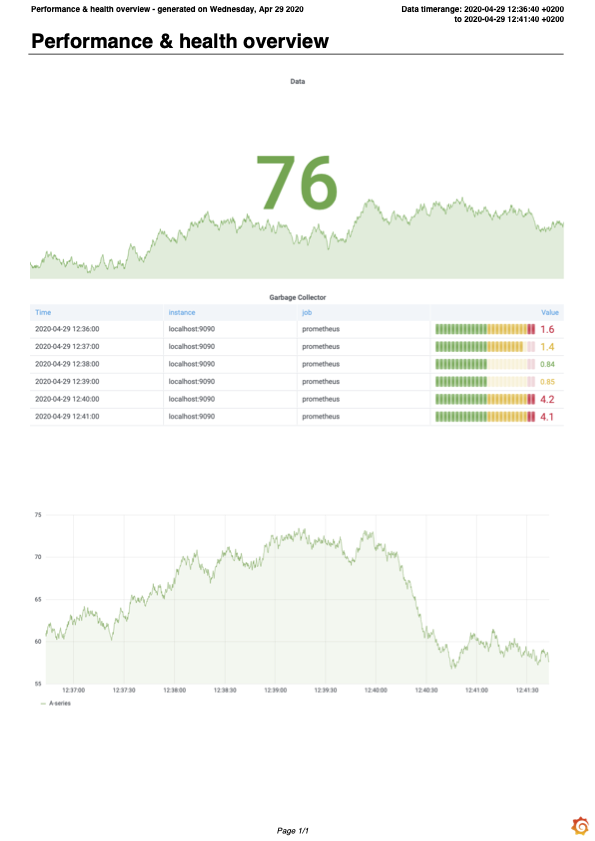 |
| Simple | Landscape | Generates an A4 page in landscape mode with a single panel per page. | 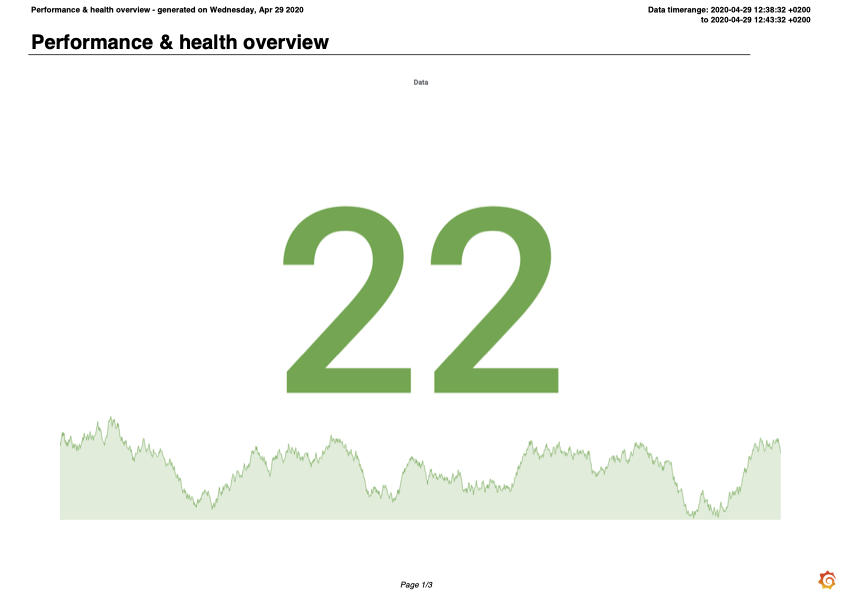 |
| Grid | Portrait | Generates an A4 page in portrait mode with panels arranged in the same way as at the original dashboard. | 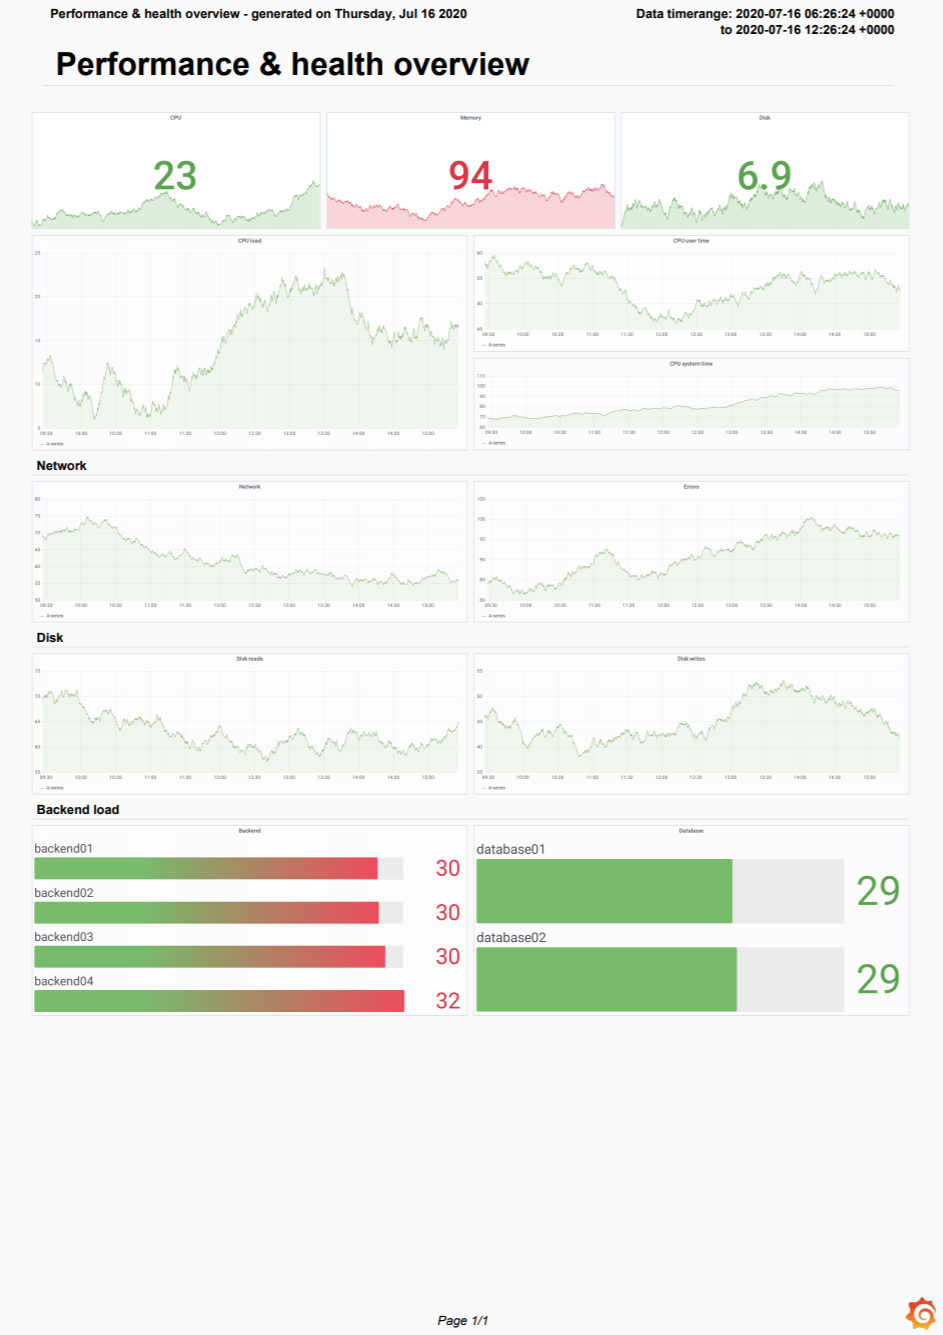 |
| Grid | Landscape | Generates an A4 page in landscape mode with panels arranged in the same way as in the original dashboard. | 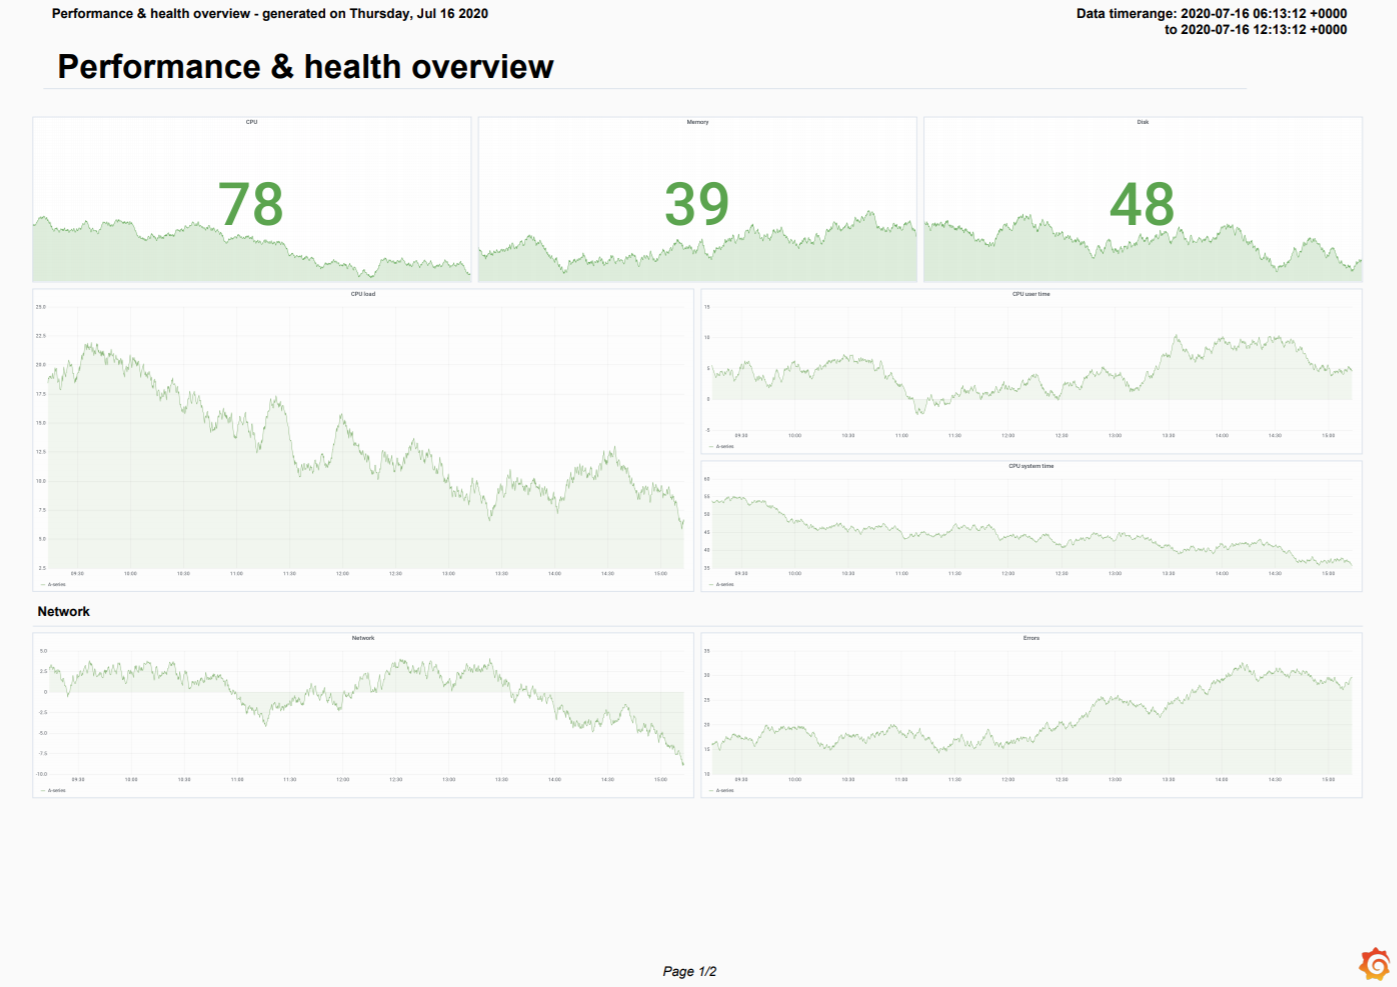 |
Table data in PDF
Note
Available in public preview (
pdfTablesfeature toggle) in Grafana Enterprise v10.3+ with the Grafana image renderer plugin v3.0+, as well as in Grafana Cloud.
When there’s more data in your table visualizations than can be shown in the dashboard PDF, you can select one of these two options to access all table visualization data as PDF in your reports:
- Include table data as PDF appendix - Adds an appendix to the dashboard PDF.
- Attach a separate PDF of table data - Generates a separate PDF file.
Send a report using the API
You can send reports programmatically with the send report endpoint using the HTTP API.
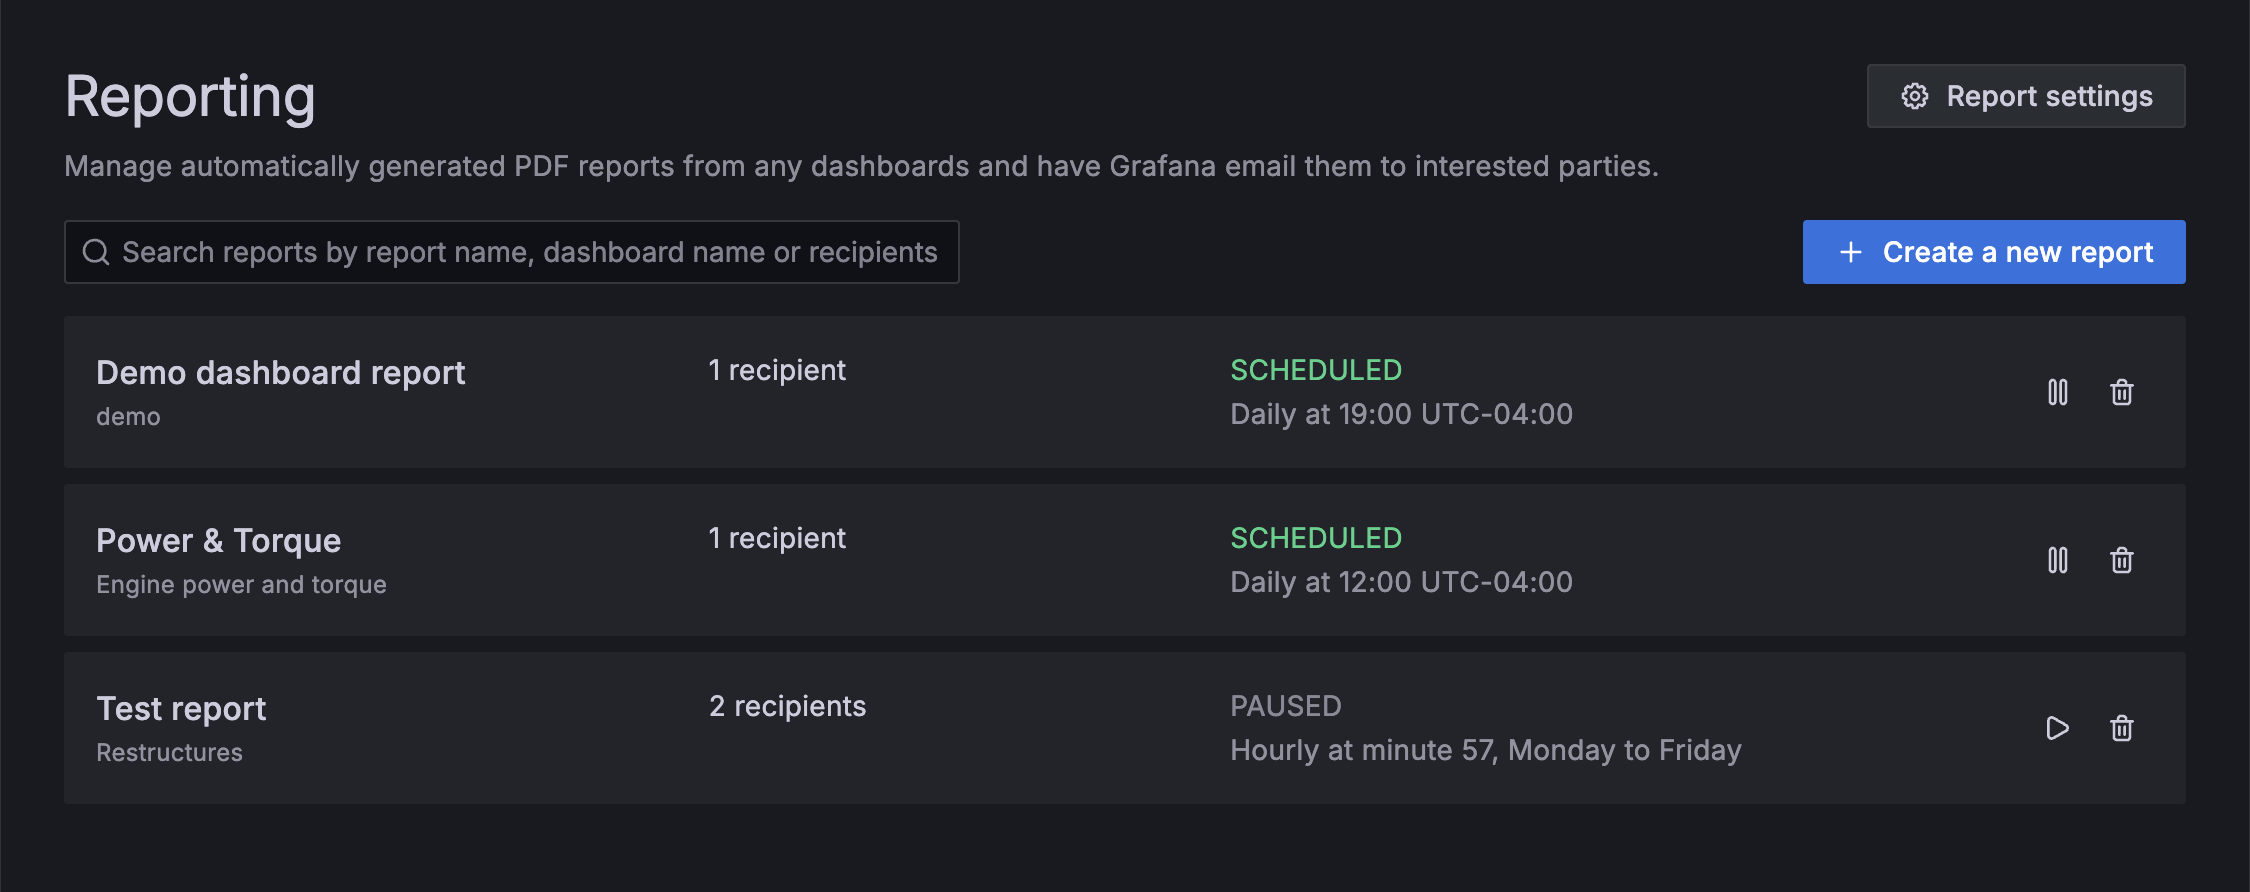
Manage reports
You can view and manage all your reports, and create new ones, on the Reporting page:
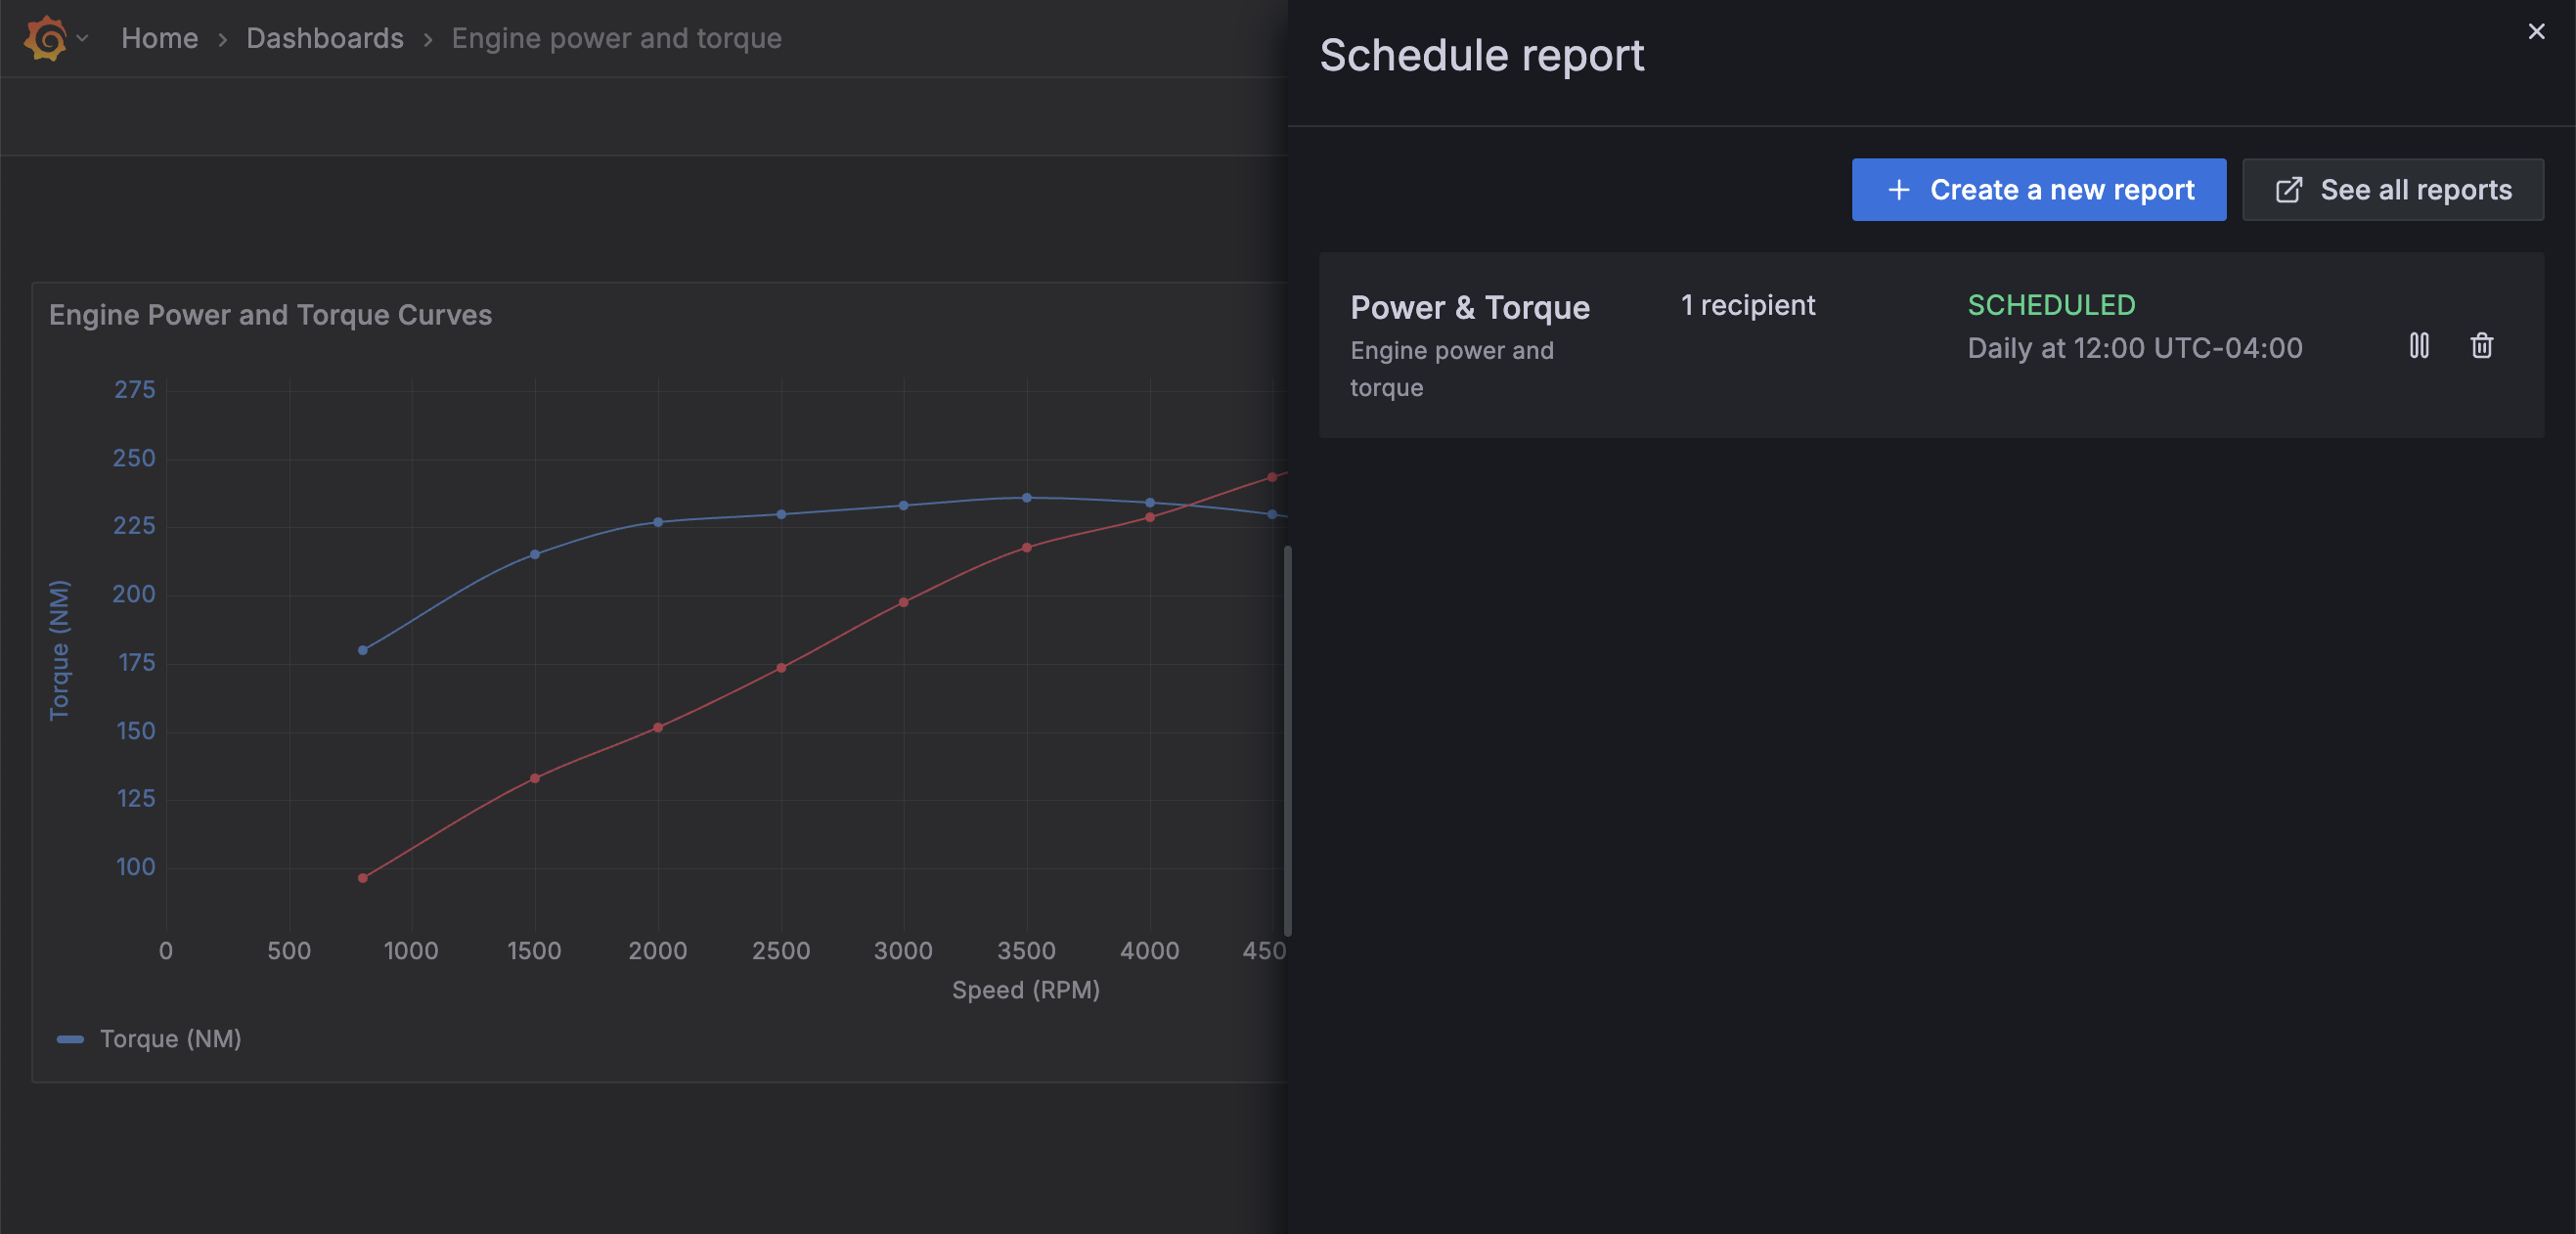
Alternatively, from any dashboard you can view and manage any reports generated from that dashboard, as well as create a new report You can also navigate to the list of all reports from the dashboard-specific list:
Edit reports
To edit a report, follow these steps:
Do one of the following:
- In the main menu, click Dashboards > Reporting.
- Navigate to the dashboard from which the report was generated and click Share > Schedule report.
Click the row of the report you want to update.
Make the necessary changes.
Click Update report.
Click the x at the top of the drawer to close it.
Pause or resume reports
You can pause and resume sending reports from the report list view. To do this, follow these steps:
Do one of the following:
- In the main menu, click Dashboards > Reporting.
- Navigate to the dashboard from which the report was generated and click Share > Schedule report.
On the row of the report you want to update, do one of the following:
- Click the pause icon - The report won’t be sent according to its schedule until it’s resumed.
- Click the resume icon - The report resumes on its previous schedule.
You can also pause or resume a report from Update report drawer.
Delete reports
To delete a report, follow these steps:
Do one of the following:
- In the main menu, click Dashboards > Reporting.
- Navigate to the dashboard from which the report was generated and click Share > Schedule report.
On the row of the report you want to update, click the trash can icon.
Click Delete to confirm.
You can also delete a report from Update report drawer.
Deleting a report is irreversible.
Troubleshoot Reporting
To troubleshoot and get more log information, enable debug logging in the configuration file. Refer to the log filters configuration documentation for more information.
[log]
filters = rendering:debug,report.api:debug,report.render:debug,report.scheduler:debug,report.sender:debug,report.service:debug

