k6 scripted checks can execute k6 tests in Synthetic Monitoring. Use k6 scripted checks to monitor transactions and user flows by implementing workflows, custom logic, and validations in JavaScript.
With k6 scripted checks, you can:
Define custom user behavior and complex request logic.
Leverage the flexibility of a scripting language.
Test HTTP/S and WebSocket services.
Utilize the k6 API and other JavaScript libraries.
Enable OpenTelemetry traces for server-side correlation.
Reuse the same k6 script for distinct testing goals.
How it works
A k6 check runs one iteration of a k6 test at short, frequent intervals to proactively monitor applications and services.
Synthetic Monitoring results are stored as Prometheus metrics and Loki logs, which allow you to set up Grafana alerts for custom notifications and incident management.
The k6 scripts in Synthetic Monitoring are broadly compatible with other k6 products, like the k6 CLI and Grafana Cloud Performance Testing. This allows you to reuse the same k6 script for various use cases, enhancing testing productivity and coverage.
Get started
You can write and execute a k6 script from the code editor in the Synthetics UI.
On the left-side menu, select Testing & synthetics and then Synthetics.
For development and debugging, you can write and execute the k6 script from your local machine using the k6 CLI and your IDE. After completing the k6 script, create a new scripted check or update the script of an existing one.
The Synthetics script editor includes a few scripts with basic examples. To get started implementing your first k6 scripts, refer to:
Refer to the check name. Check metrics include a job label with the value of this option.
Target
Target of the check request. Check metrics include an instance label with the value of this option.
Probe locations
The locations where the check should run from. Check metrics include a probe label with the value of the probe location running the check.
Frequency
The frequency the check should run in seconds. The value can range from 60 to 3600 seconds. Only the sm_check_info metric includes the frequency label.
Timeout
Maximum execution time for the check. The value can range from 1 to 180 seconds.
Custom labels
(Optional) Custom labels applied to check metrics. Refer to Custom labels for querying instructions.
Additionally, k6 scripted checks have the following options:
Option
Description
Script
The k6 script to execute periodically. For further details, refer to k6 compatibility.
Supported k6 Options
k6 options can be used to configure a wide range of features when running the k6 script. In Synthetic Monitoring, k6 options can only be set in the script options object:
A string specifying the User-Agent header when sending HTTP requests
Metrics
Synthetic checks store their results as Prometheus metrics, including the list of common metrics to all check types:
Metric
Description
probe_all_duration_seconds
Returns how long the probe took to complete in seconds (histogram).
probe_duration_seconds
Returns how long the probe took to complete in seconds.
probe_all_success
Displays whether or not the probe was a success (summary).
probe_success
Displays whether or not the probe was a success.
sm_check_info
Provides information about a single check configuration.
k6 metrics
Scripted checks also collect the metrics produced by k6 and store them as Prometheus metrics.
k6 has two types of metrics:
Built-in metrics: These are metrics collected by every k6 test, such as data received and total number of requests.
Custom metrics: These are metrics that you can create in your test script to measure anything that’s specific to your system or business logic. In Prometheus, they’re renamed to probe_K6_METRIC_NAME and mapped to Prometheus gauges.
k6 built-in metrics are transformed in Synthetic Monitoring as follows:
Metric
Description
probe_check_success_rate
The pass/fail rate of assertions (calls to check()). The check label identifies the assertion by name. The value can range between 0 (all failed) and 1 (all passed).
probe_checks_total
The number of passing/failing assertions (calls to check()). The check label identifies the assertion by name. The result label can have a value of pass or fail.
probe_data_received_bytes
The total data received for all requests made in executing the script. It corresponds to the data_received metric.
probe_data_sent_bytes
The total data sent for all requests made in executing the script. It corresponds to the data_sent metric.
probe_http_duration_seconds
Duration of HTTP request by phase, in seconds. This is the combined total of the http_req_blocked, http_req_connecting, http_req_receiving, http_req_sending, http_req_tls_handshaking, and http_req_waitingk6 HTTP metrics.
The expected_reponse tag set on HTTP requests by k6. By default, response statuses between 200 and 399 are true. For more details, refer to k6 HTTP Request Tags.
probe_http_info
This metric includes additional labels associated with an HTTP request such as HTTP version, TLS version, and error message on failed requests. It always returns a value of 1.
probe_http_requests_failed_total
The number of failed HTTP requests while executing the script.
probe_http_requests_total
The number of HTTP requests initiated while executing the script.
Returns the amount of time it took the script to execute, in seconds. It corresponds to the iteration_duration metric.
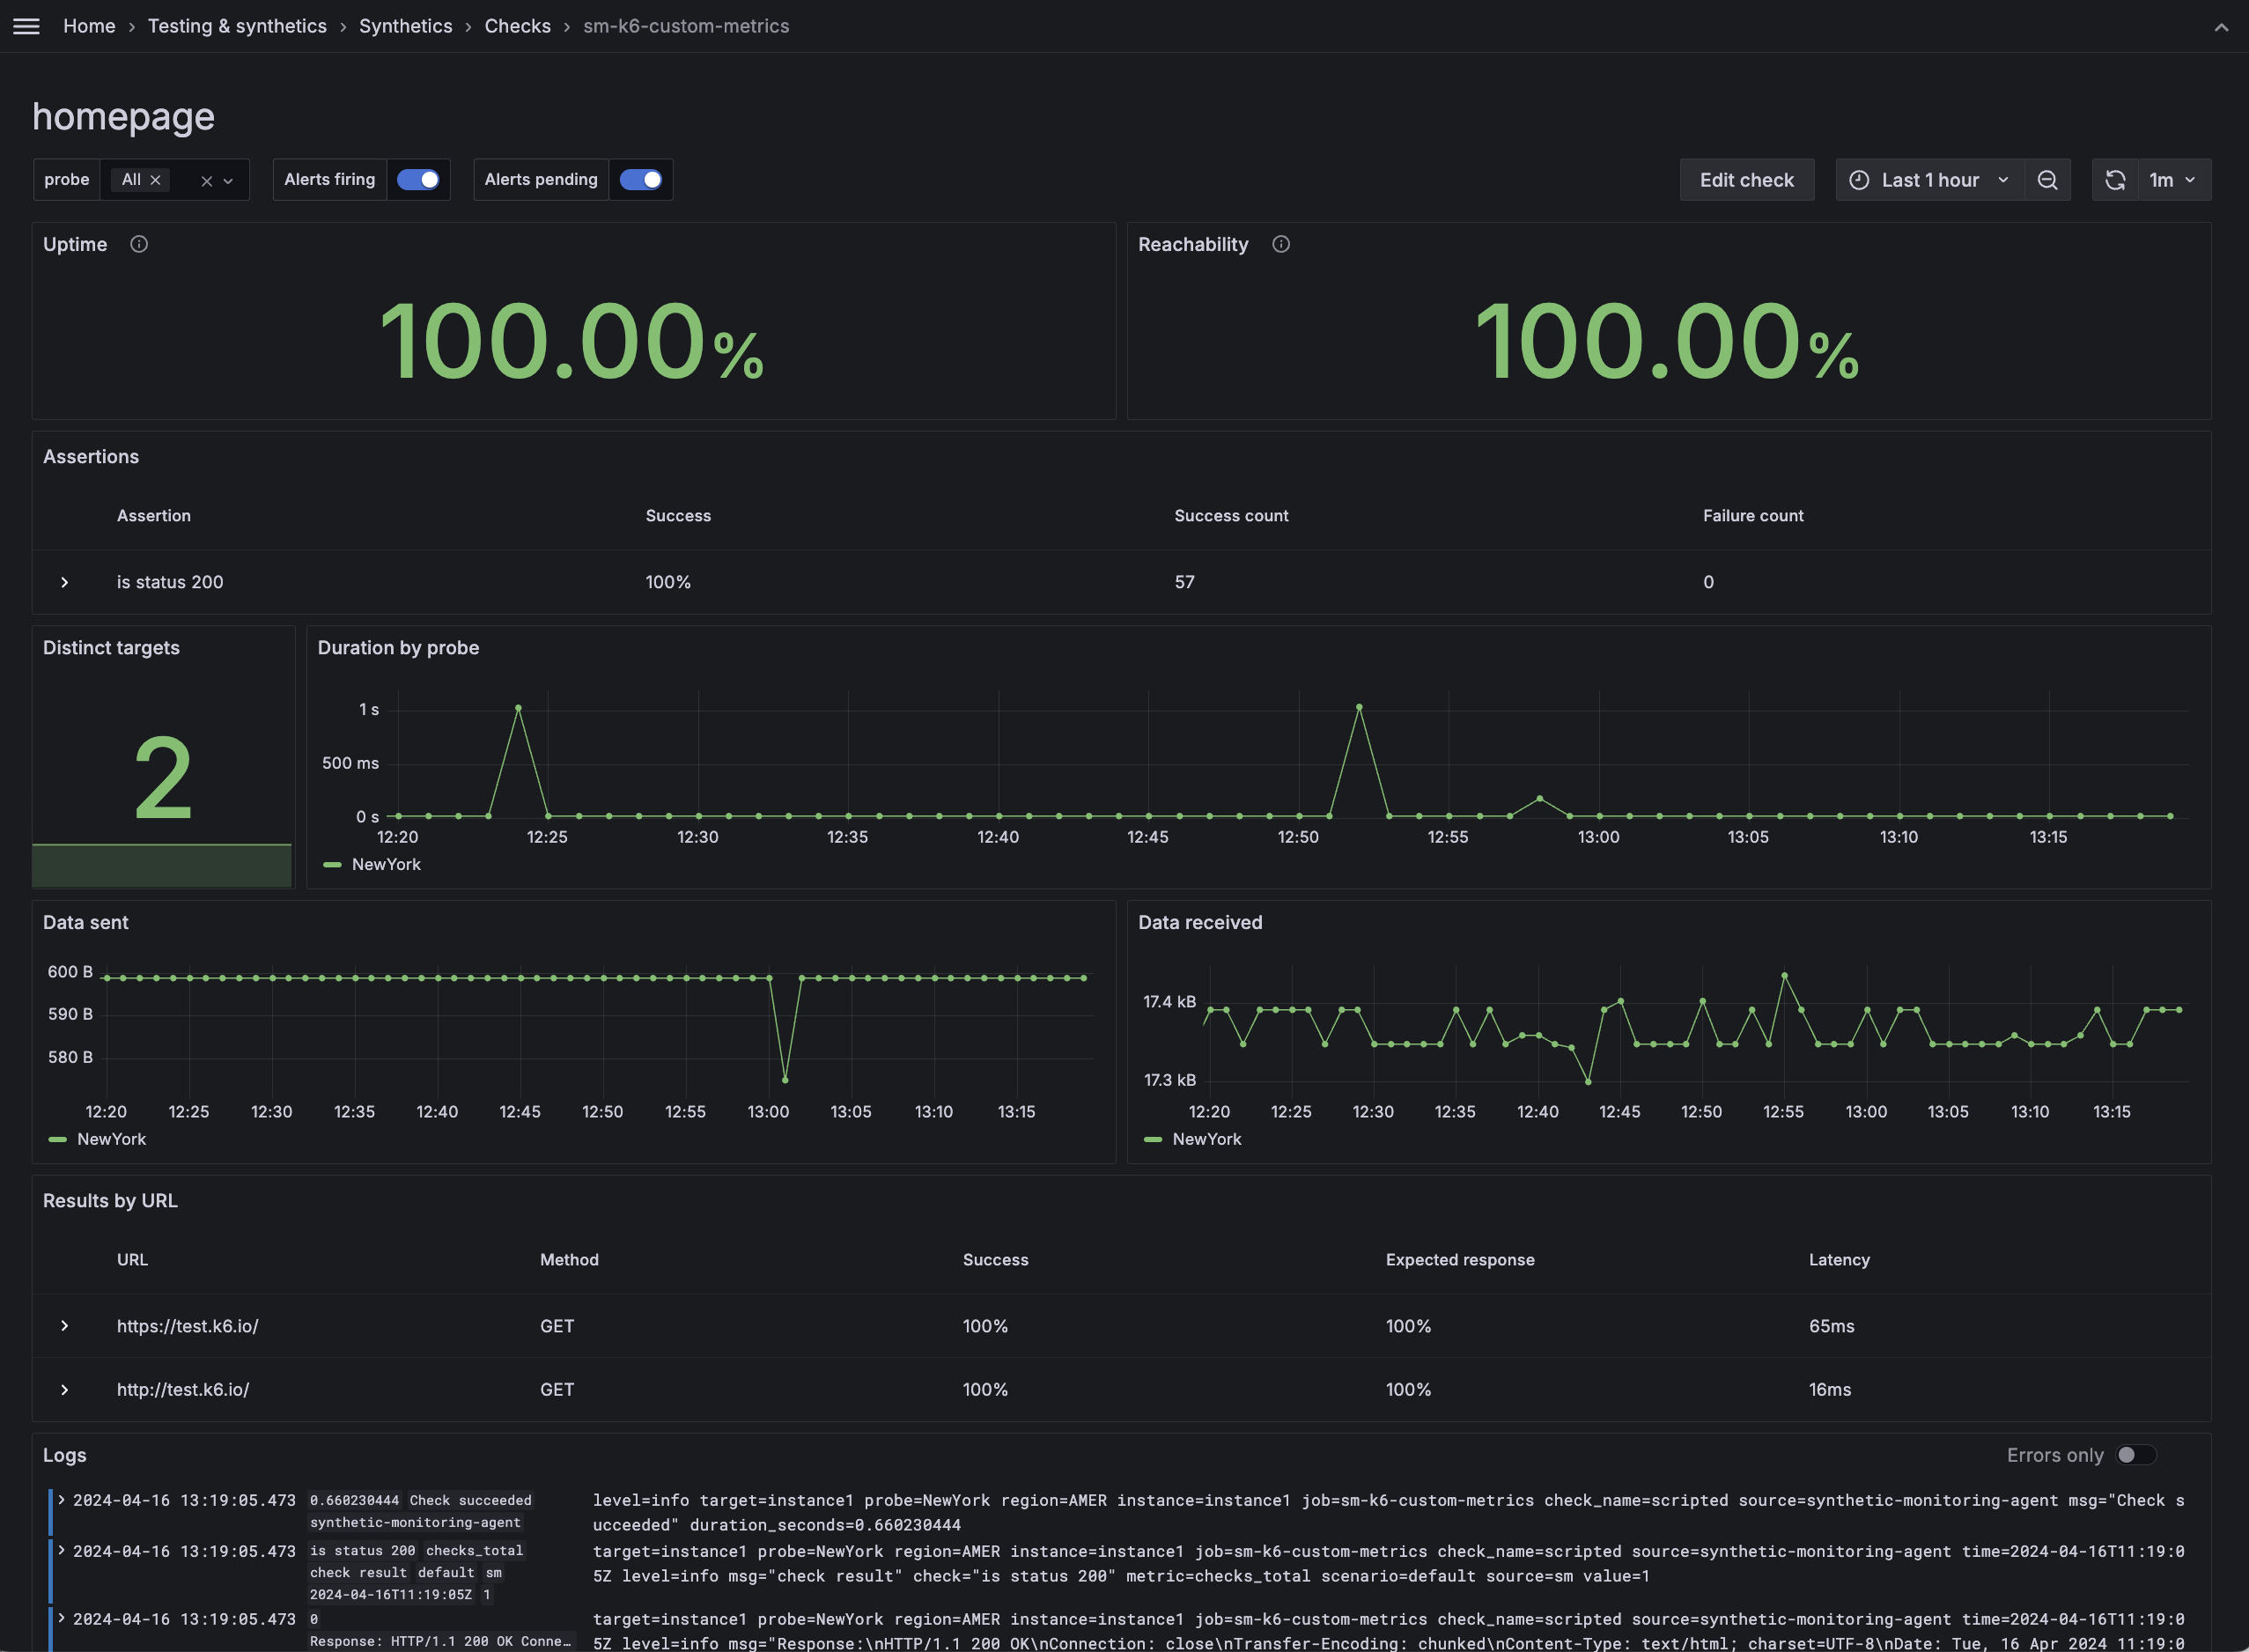
Visualization
You can query all the produced check metrics with Grafana Explore, where you can create custom panels and add them to your dashboards.
Additionally, each check includes a dashboard displaying the results of the most relevant metrics. To learn more about the various visualization options, refer to Analyze results.
Compatibility
Grafana Cloud Synthetic Monitoring has the following limitations for k6 scripts, compared to running them locally or using Grafana Cloud k6:
Workload options
Each k6 check runs only one iteration of the test. The system ignores options such as vus, duration, stages, and iterations.
Timeout
k6 checks have a maximum execution time. Configure this limit with the Timeout option in the UI.
k6 CLI
You can’t use the k6 CLI to run or upload k6 scripts to Grafana Cloud Synthetic Monitoring.
Custom labels that you define in the UI aren’t included in k6 metrics. Non-k6 metrics don’t include labels that you define in the k6 tags option.
Load local files
For security reasons, probes can’t load local files. k6 APIs such as open, fs, and grpc.load (non-reflection) aren’t supported.
To import local modules or libraries, use a bundler to build your k6 script with its dependencies locally, then copy the output into the script option.