Configure per-check alerts
Per-check alerts allow you to create check-specific thresholds for common Synthetic Monitoring alert scenarios, including:
- Number of test failures within a time window.
- TLS certificate expiration threshold (HTTP and TCP checks only).
- Average latency (HTTP, DNS, and Ping checks).
Per-check alerts differ from legacy alert rules in the following ways:
- You can specify thresholds on a check-by-check basis.
- They leverage Grafana-managed alert rules, while legacy alert rules use data source-managed alert rules.
There are two steps to configure per-check alerts:
- Enable per-check alerts on a check
- Configure alert notifications
Enable per-check alerts on a check
To configure per-check alerts on a check:
- Navigate to Testing & Synthetics > Synthetics > Checks.
- Click New Check to create a new check or edit a preexisting check from the list.
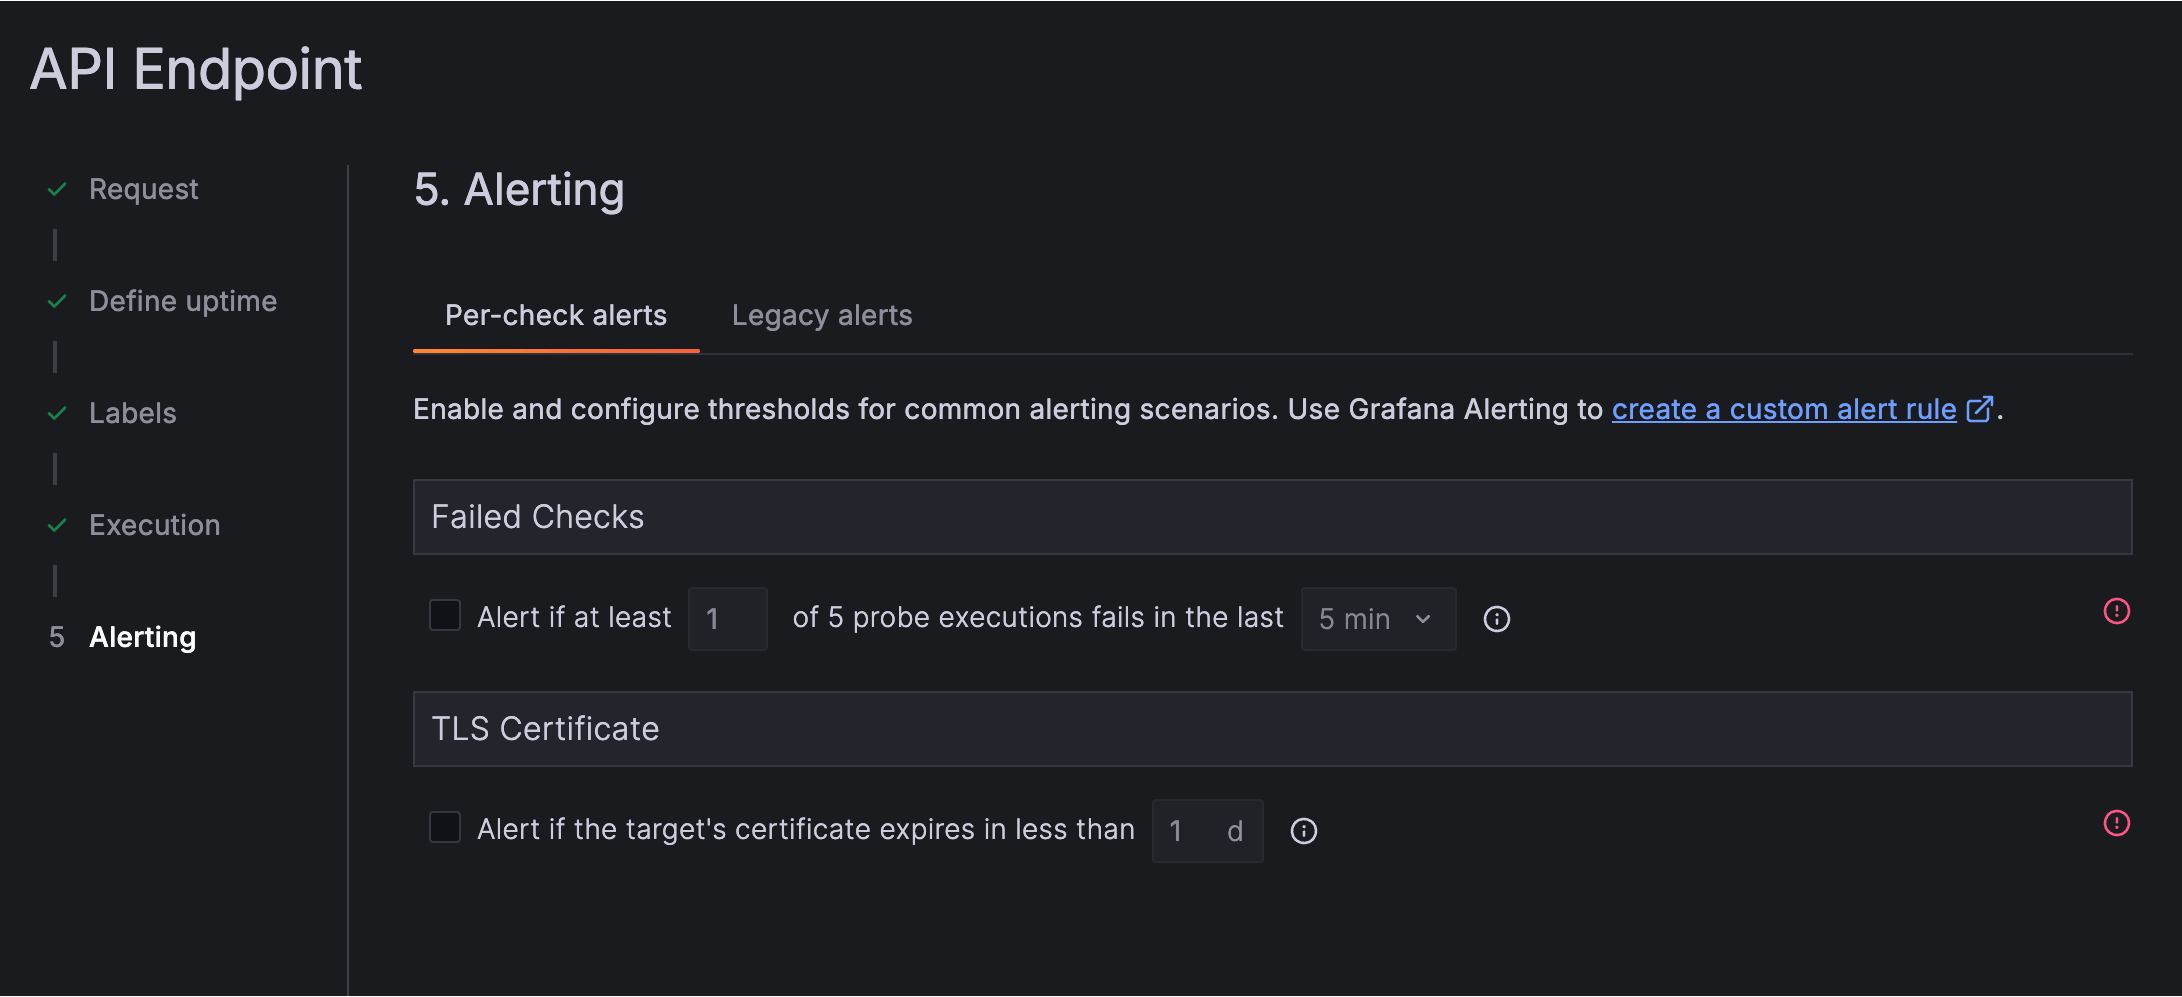
- Click on the Alerting section, then click on the Per-check alerts tab.
- Select the checkbox beside each alert you would like to enable.
- Specify the trigger conditions for the alert. Refer to Per-check alerts for alert-specific conditions.
Configure alert notifications
To receive notifications when alerts are triggered, configure notification policies to route the Synthetic Monitoring alerts to the appropriate contact point. Refer to Notification policies and Configure notification policies for more details.
Example
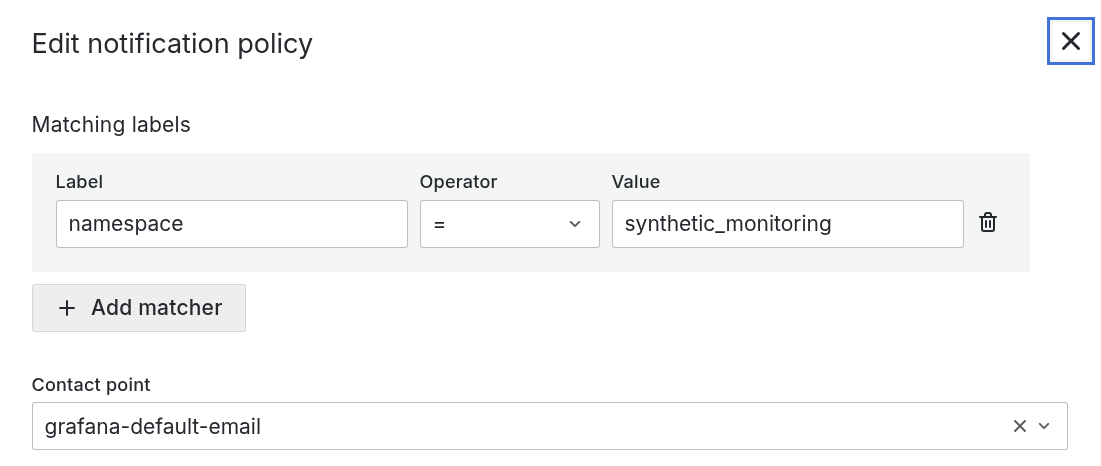
To configure notification policies, go to Alerting > Notification policies on the main menu. As an example for Synthetic Monitoring, create a child notification policy that matches the label namespace = synthetic_monitoring and assign the desired contact point. This label is included in every alert rule for Synthetic Monitoring.
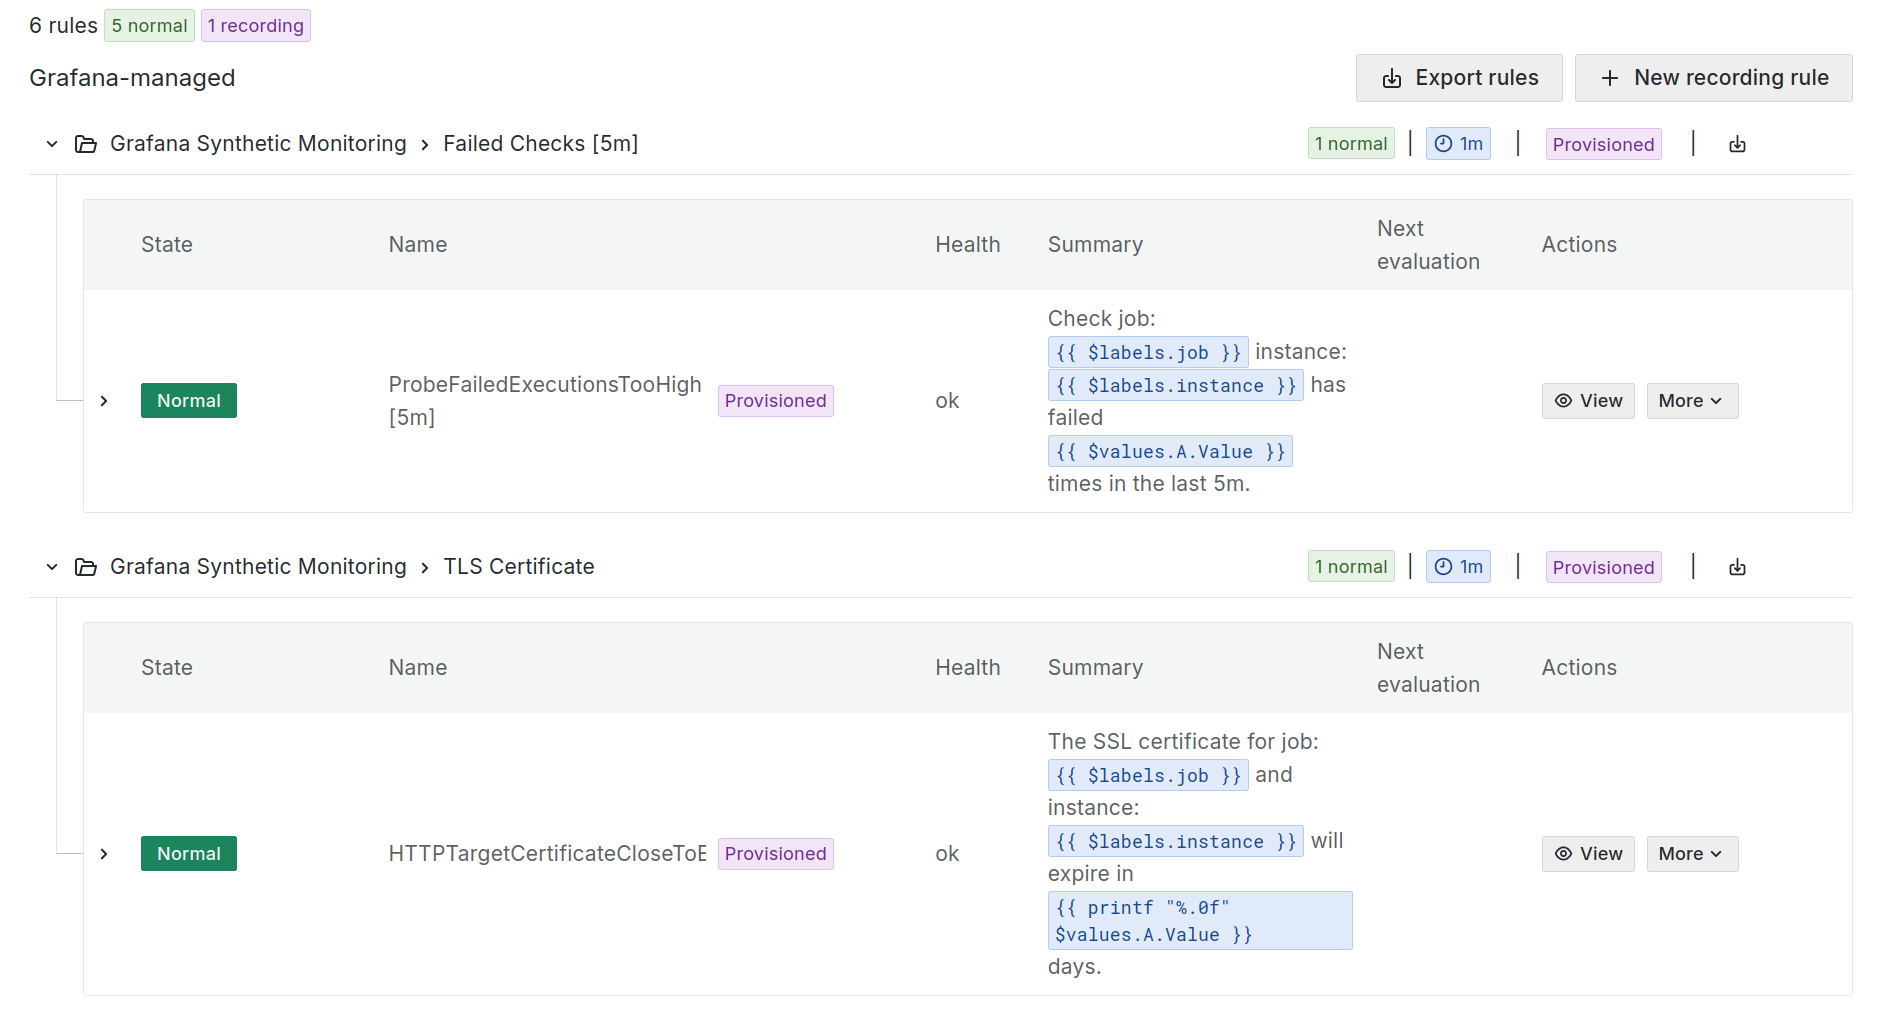
Grouping
By default, notifications are grouped by Grafana folder and alert name. For details, refer to Group alert notifications.
For example, all alert instances for the failed checks alert are grouped under the same notification. Each alert is represented as a separate instance within that notification.
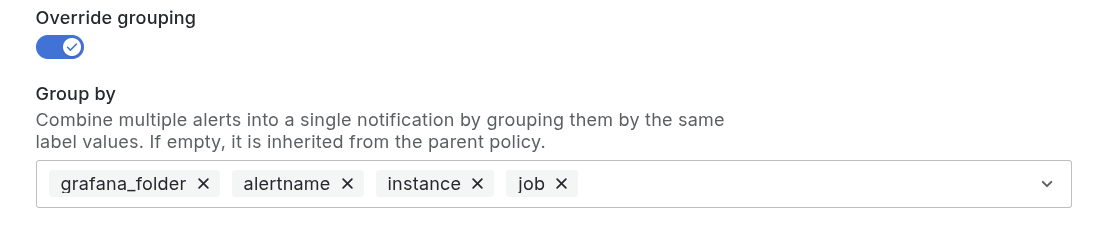
You can change the grouping configurations in the notification policy. For Synthetic Monitoring, add the instance and job labels to group notifications by check. These labels uniquely identify a check, so each check that triggers an alert generates a separate notification.
Per-check alerts
Failed checks
The failed checks alert lets you define a threshold condition that determines when check execution failures should trigger an alert. The threshold can be defined based on:
- Number of failures: Number of check execution failures in the selected time range.
- Time range: Has to be greater or equal to the check frequency. Supported values are
5m,10m,15m,20m,30m,1h.
TLS certificate expiration
Note
TLS certificate expiration alerts are only available for HTTP and TCP checks.
The TLS certificate expiration alert lets you define a threshold condition that determines when to trigger an alert for an upcoming certificate expiration for the target under monitoring. The threshold can be defined based on:
- Number of days until expiration.
Latency alerts
Note
Latency alerts are only available for HTTP, DNS, and Ping checks.
Latency alerts fire when the average latency across all probes is higher than the specified threshold. The alert can be defined based on:
- Threshold Value: Average latency (ms).
- Time range: Time range on which the average latency is calculated. Has to be greater or equal to the check frequency. Supported values are
5m,10m,15m,20m,30m,1h.
Per-check alerts status
You can view per-check alerts associated with a check by hovering over the bell icon on the checks list. From there, you can access the specific alert rule definition in IRM, and see any errors associated with the alert.
How per-check alert rules work
Per-check alert rules are composed of two parts:
- A metric associated with the alert type: This is a metric reported as a result of the Synthetic Monitoring check executions. For example
probe_ssl_earliest_cert_expiry. - A metric associated with the threshold: This is a metric that identifies the threshold set by the user for each specific alert type and check combination, and that’s continuously pushed as long as the alert is enabled for the check.
Note
The threshold metric time series counts against the credit of active series for Synthetic Monitoring as long as the alert is enabled for the check. Refer to Understand your Synthetic Monitoring invoice for more details.
These two parts are evaluated together in the alert rule, where the values of the metric for the alert type is evaluated against the specific threshold value.
Some alert types can be configured for different time ranges, for example the alert for failed checks. In these cases multiple alert rules might be created in Grafana if the alert is enabled for various checks using different time ranges.